

Abstract
Melanoma is the most notorious and fatal of all skin cancers and the existing treatment options have not been proven to effectively manage this neoplasm, especially the metastatic disease. Sirtuin (SIRT) proteins have been shown to be differentially expressed in melanoma. We have shown that SIRTs 1 and 2 were overexpressed in melanoma and inhibition of SIRT1 imparts anti-proliferative responses in human melanoma cells. To elucidate the impact of SIRT 1 and/or 2 in melanoma, we created stable knockdowns of SIRTs 1, 2, and their combination using shRNA mediated RNA interference in A375 human melanoma cells. We found that SIRT1 and SIRT1&2 combination knockdown caused a decreased cellular proliferation in melanoma cells. Further, the knockdown of SIRT 1 and/or 2 resulted in a decreased colony formation in melanoma cells. To explore the downstream targets of SIRTs 1 and/or 2, we employed a label-free quantitative nano-LC-MS/MS proteomics analysis using the stable lines. We found aberrant levels of proteins involved in many vital cellular processes, including cytoskeletal organization, ribosomal activity, oxidative stress response, and angiogenesis. These findings provide clear evidence of cellular systems undergoing alterations in response to sirtuin inhibition, and have unveiled several excellent candidates for future study.
Keywords: Sirtuins, Melanoma
Graphical abstract

Introduction
As the fifth and sixth most common types of cancer diagnosed in men and women, respectively, melanoma is a frequently diagnosed cancer in the United States [1]. It is estimated that over 87,000 new diagnoses and nearly 10,000 deaths will be attributed to this malignancy in the United States in 2017. In its early stages, melanoma can be treated with relative ease through surgical excision or radiation therapy. However, if melanoma is not caught early or it is in a location that is difficult to treat via surgical excision or other localized therapies, it can rapidly metastasize with fatal consequences. At this time, both immunologic and targeted therapies are under investigation for melanoma treatment, but low effectiveness, adverse effects, and recurrence are the major obstacles that are yet to be addressed, especially for metastatic melanoma (reviewed in [2]). The lack of a successful treatment regimen and the expected increases in melanoma deaths due to an aging population and increased sun exposure, stresses the need for novel chemotherapeutic for melanoma management.
The sirtuins are a family of enzymes categorized as Class III histone deacetylases (HDACs). Their deacetylase activity is unique in that it is NAD(+)-dependent rather than zinc-dependent like the other HDACs [3]. Although their roles as histone deacetylases were the first to be delineated, subsequent research has shown that sirtuins possess additional enzymatic activities in the cell, including mono-ADP-ribosyltransferase and general deacylase activities [4]. In humans, seven sirtuins (SIRTs 1-7) have been discovered to date. This family of enzymes has been implicated in a wide range of cellular and biological processes, including aging, apoptosis, oxidative stress, and carcinogenesis. The different sirtuins have distinct cellular localizations, which may contribute to their range of activities in the cell. SIRTs 1, 6, and 7 are primarily in the nucleus, while SIRTs 3, 4, and 5 are generally found in the mitochondria. Interestingly, SIRT2 is the only sirtuin mostly found in the cytoplasm, although there is abundant evidence that many sirtuins, including SIRTs 1 and 2 shuttle in and out of their primary location and may be cell and tissue dependent [5, 6]. Because sirtuins have multiple roles in cellular metabolism and have been implicated in tumorigenesis, they present as an attractive target for cancer therapeutics. SIRT1 and SIRT2 are shown to be upregulated in human melanomas, suggesting that they may be used as chemotherapeutic targets [7, 8]. Additionally, our previous work investigating the roles of SIRT1 and SIRT2 in melanoma has suggested that one or both of these sirtuins play a role in melanoma progression [7, 8]. However, these studies relied on the use of chemical inhibitors, which could have off-target effects, as well as inhibit SIRT3 at higher levels. In order to perform a more specific analysis, here we have employed short-hairpin RNAs (shRNAs) in an assessment of melanoma cell growth, and a proteomics-based mechanistic evaluation. In this study, we compared the growth inhibitory effects of knockdown of SIRT1, SIRT2, and their combination, and discuss the potential mechanistic basis of these observations.
Materials and Methods
The overall experimental plan is depicted in Fig. 1. Specific methods used are described below.
Figure 1. Outline of experimental plan for analysis of shRNA-mediated stable knockdown of SIRT 1 and/or 2 in A375 human melanoma cells.
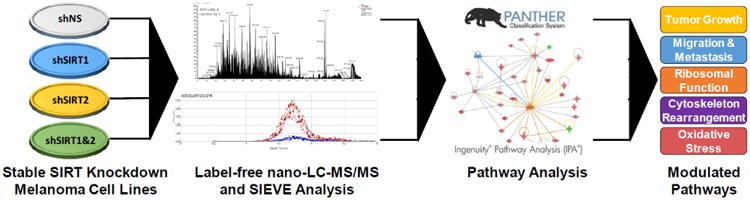
Following stable knockdown of SIRT1 and/or 2 and assessing the effects on cell growth/proliferation, the cell lines were submitted to label-free nano-LC-MS/MS. Resulting peaks were analyzed using SIEVE software and the proteins identified as up- or down-regulated were entered into PANTHER and IPA to determine the modulated pathways after knockdown. Further details are provided in ‘Materials and Methods’ section.
Cell culture
The human melanoma line A375 and 293T cells (ATCC; Manassas, VA) were maintained in Dulbecco's Modified Eagle's Medium (Corning; Tewksbury, MA) with 10% FBS (Sigma Aldrich; St. Louis, MO) in standard cell culture conditions (37°C, 5% CO2 in humidified incubator).
Lentiviral production and transduction
The stable knockdown was achieved by shRNA mediated RNA interference. To create shSIRT and control lentivirus, 293T cells were transfected via calcium phosphate precipitation with plasmid DNA and the envelope and 2nd generation packaging plasmids VSV-G and Δ8.2. To ensure maximal knockdown, 5 separate shRNAs for each protein were purchased and tested, with the clone inducing the best knockdown chosen for experimental use. Protocol specifics are as follows: 10 μg shRNA plasmid DNA (nonsense-NS (SHC002, Sequence: CCGGCAACAAGATGAAGAGCACCAACTCGAGTTGGTGCTCTTCATCTTGTTGTTTTT), SIRT1 (Sequence: CCGGGCGGCTTGATGGTAATCAGTACTCGAGTACTGATTACCATCAAGCCGCTTTTT, TRC number: TRCN0000018983, Clone ID: NM_012238.3-1958s1c1), SIRT2 (Sequence: CCGGGCTAAGCTGGATGAAAGAGAACTCGAGTTCTCTTTCATCCAGCTTAGCTTTTTG, TRC number: TRCN0000040222, Clone ID: NM_012237.2-815s1c1) (Sigma Aldrich), 5 μg VSV-G and 6 μg Δ8.2 plasmids were transfected into HEK293T cells as before [9]. Transfection media was discarded after 24 hours and replaced with fresh media. Virus-containing media was collected and replaced after an additional 24 hours and stored at 4°C, then combined with a second batch of media collected at 72 hours post-transfection. Virus-containing media was then filtered with a 0.45 μM PES filter, aliquoted into single use portions, and frozen at -80°C for future use. For target cell transduction, viral media was thawed in a 37°C water bath, then added to cells with 8 μg/ml polybrene four times over 36 hours. After 48 hours of transduction, viral media was removed and cells were allowed to recover for 24 hours. For stable cell selection, puromycin (0.5 μg/ml) was added in media to the cells and changed every 2-3 days until separate colonies became distinguishable. Distinct colonies were transferred to each well of a 12-well plate and subsequently grown while maintaining puromycin selection and tested for knockdown via western blotting. For the SIRT1&2 combination knockdown cell line, the single SIRT1 knockdown cell line was then transfected with SIRT2 shRNA as above. Cells were replated at very low density to allow adequate separation of colonies for selection, and knockdown was verified by western blot. The clones with the best knockdown were used in further experiments.
SDS-PAGE and Western Blot Analysis
Protein was isolated by resuspending pelleted cells in radioimmunoprecipitation assay (RIPA) buffer (Millipore, Billerica, MA) supplemented with phenylmethylsulfonylfluoride (PMSF) and Protease Inhibitor Cocktail (ThermoFisher Scientific, Waltham, MA). Cells were incubated on ice for 30 minutes and then centrifuged for 30 minutes to eliminate cellular debris. Supernatant was transferred to a clean tube and quantified using a BCA Assay (ThermoFisher Scientific) according to manufacturer instructions. 20 μg of total protein was loaded in each well of a SDS-PAGE gel and electrophoresed to the appropriate point, then transferred to a nitrocellulose membrane. Blots were incubated with primary antibody [SIRT1 (Cat #2496); SIRT2 (Cat #12650); β-actin (Cat #4970); Cell Signaling Technology, Danvers, MA)] overnight according to manufacturer's suggestion before incubating with anti-rabbit secondary antibody (Cat #7074; Cell Signaling). Blots were developed using ECL detection kit and imaged using the GE ImageQuant LAS 4000 (GE Healthcare).
Trypan Blue Viability Assay
A375 shNS and stable knockdown cells were plated (30,000 cells/well) in triplicate into 6-well plates. At each time point (48, 72, 96 hours), media was transferred to a collection tube and cells were incubated with trypsin and moved to the same tube. PBS was used to rinse any remaining cells and was transferred into the same tube. Cells were mixed thoroughly and 15 μL aliquots were mixed with 15 μL of trypan blue (ThermoFisher Scientific) and 10 μL was transferred to each side of the counting slide. Cells were counted in quadruplicate using the Countess FL Automated Cell Counter (ThermoFisher Scientific). Data is shown as mean of 3 replicates ± standard error.
Colony Formation
The A375 stable shNS and knockdown cells were plated (1000 cells/well) in triplicate. Media containing puromycin was changed every 2-3 days for 7-9 days or until desired confluency was reached. For staining, media was removed from cells and 450 μL of 1% crystal violet solution (in 1:1 water:methanol) was added and incubated for 30 minutes. Wells were destained with 2× PBS rinses of 750 μL each and imaged.
MTT Assay
Stable knockdown and A375 shNS cells were plated in 96-well plates (6 replicates, 1000 cells/well) in complete medium with puromycin. At each time point (24, 48, 72, 96 hours), media was removed from all wells, PBS was used to rinse, and MTT reagent (1-(4,5-Dimethylthiazol-2-yl)-3,5-diphenylformazan) diluted in media was added. Cells were incubated at 37°C for 2 h, and then crystals were dissolved using DMSO. Absorbance was measured at 570 nm using a BioTek Synergy H1 plate reader.
Protein Sample Preparation for Proteomics Analysis
Protein was prepared as outlined in Cholewa et al with minor modifications [10]. Briefly, after 96 hours of growth, cells were pelleted using trypsin followed by three PBS washes on ice, and immediately lysed. For lysis, 0.25 mL of 50 mM ammonia bicarbonate was added to the cell pellet and cells were mechanically lysed with a 26-gauge needle. After centrifugation to remove the insoluble fraction, protein was quantified and 20 μg of each protein was digested as described before, dried, resuspended, and desalted on C18 Zip-Tips according to manufacturer's protocol (Millipore). Samples were then resuspended in 0.1% formic acid (v/v) and analyzed by nano-LC-MS/MS.
Label-Free Protein Identification and Quantification by nano-LC-MS/MS
Biological triplicate samples were injected twice each (making a total of 6 replicates per sample) and analyzed by nano-LC-MS/MS for each knockdown line, using the same settings as described previously with 15 data dependent MS/MS per primary scan [10], with the exception of using a 7 s duration for the dynamic exclusion in these runs. Briefly, for each sample replicate, after cleanup, 2.5 μg was injected on a 100 μm × 100 mm, reverse phase C18 BEH column with 1.7 μm particles and a 300 Å pore size. Peptides were eluted from the column over 180 min with an increasing acetonitrile gradient, top 15 ms/ms data dependent method using a Q-Exactive Orbitrap mass spectrometer (ThermoFisher Scientific). The instrument was set to fragment precursors ions of +2 to +7. A 50 min linear gradient blank was run in between each sample to ensure no carry-over.
Data Processing
The data was processed as described earlier [10]. Briefly, following acquisition of nano-LC-MS/MS data, the resulting raw files were processed using Proteome Discoverer 1.4 Software (ThermoFisher Scientific) using SEQUEST HT and Uniprot Human with a decoy database added to establish control variability and false discovery rates. Search parameters included a full tryptic digest, with 2 missed cleavages allowed with precursor ion mass tolerance of 10 ppm (a window of +/- 5ppm in each direction) and fragment mass tolerance of 0.6 Da. Modifications of oxidation (M) variable and carbamidomethyl (C) were searched for and allowed at up to 3 modifications per peptide. The false discovery rate was set to 1%. Chromalign was used to align the data following protein identification, and normalization of the peak intensities of all runs was performed by using the total ion chromatogram intensity. Peptides eluted between 38 and 145 minutes were analyzed via SIEVE to quantify the peak intensities. In order to reduce the effect of run-to-run variability, calculated protein ratios used in further analysis steps had a p value <0.05 and the CV raw MS intensities of the replicates (biological and technical) was limited to those within 25%.
Data Analysis
From each knockdown line, proteins identified as having unique peptides with a confidence value of P<0.05 and more than 4 hits (peptides that triggered MS/MS fragmentation scans) was uploaded into Ingenuity Pathway Analysis (IPA, Ingenuity Systems, CA). Using IPA filters set to eliminate proteins with less than 1.8-fold expression changes, the resulting identified proteins were used to analyze which biological processes and pathways were affected by knockdown of each SIRT or set of SIRTs. The same filtered set of proteins were also entered into PANTHER (Protein ANalysis Through Evolutionary Relationships) to determine the molecular functions and biological processes involved with those proteins.
Statistical Anlyses
Data were analyzed with GraphPad Prism 7 Software (GraphPad Software, La Jolla, CA). One-way ANOVA with Tukey's post hoc test or two-tailed Student's t-test were used to determine significance. Data is shown as mean ± SEM. P-values of ≤0.05 were considered significant, and greater significance levels are indicated where appropriate.
Results
Effects of shRNA-mediated knockdown of SIRT1 and/or SIRT2 on human melanoma cell growth and clonogenic survival
To assess the effects of specific sirtuin inhibition in melanoma, we created four stable knockdown lines from A375 melanoma cells; one with SIRT1 shRNA, a second with SIRT2 shRNA, and a third with both SIRT1 and SIRT2 shRNA, as well as a non-targeting (NS) shRNA control. Successful knockdown was confirmed via western blot as shown in Figure 2A.
Figure 2. Stable SIRT knockdown reduces cellular growth and proliferation.
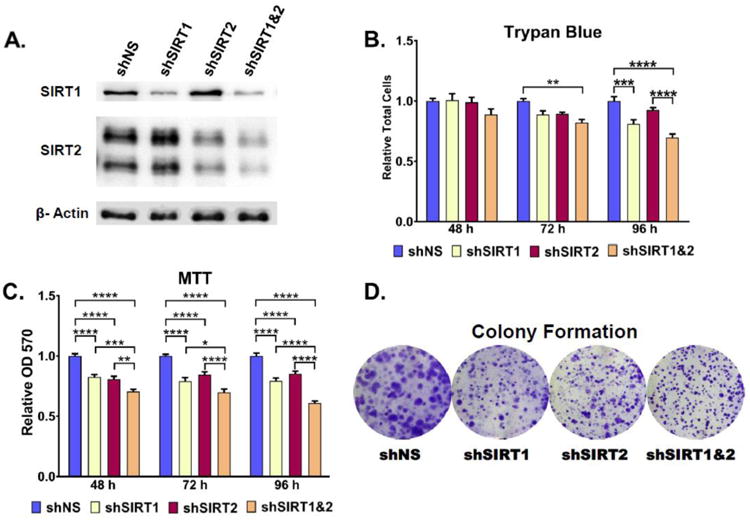
A) Stable knockdown was verified by western blot analysis. β-actin was used as a loading control. Cellular proliferation was analyzed for 48, 72, and 96 hours by B) Trypan blue and C) MTT analysis. Clonogenic cell survival of melanoma cell lines was assessed by a colony formation assay D). Representative images of crystal violet stained colonies after 8 days of incubation. Error bars represent mean ± SEM. * P ≤ 0.05; ** P ≤ 0.01; *** P ≤ 0.001; **** P ≤ 0.0001. Further details are provided in ‘Materials and Methods’ section.
To establish the effects of SIRT1 and/or SIRT2 knockdown on melanoma cell growth and viability, a trypan blue exclusion assay was performed (Fig. 2B). Results showed a steady decrease in the relative growth of SIRT1 and SIRT1&2 combination knockdown cells relative to the NS control. shSIRT2 cells showed a decrease in growth by 72 hours post-plating, but slightly increased relative to the NS control by the 96 hour time point. The reason for this is unclear, but the pattern was observed consistently over all three experimental runs. No significant effects on cell viability were observed in any of the cell lines for the duration of the experiment (data not shown).
To confirm the growth inhibitory effects observed in the trypan blue exclusion assay, an MTT (3-(4,5-dimethylthiazol-2-yl)-2,5-diphenyltetrazolium bromide) cellular proliferation assay was performed (Fig. 2C). Results show the same growth patterns observed in the trypan blue results. shSIRT2 cells again showed a mild growth inhibition relative to the control cells, with an upward trend starting at 72 hrs post-plating. This may be explained by the influence of cellular metabolism on the MTT assay results, i.e. an increase in metabolism leads to an increased NAD(P)H-dependent oxidoreductase activity, which is responsible for reducing the MTT tetrazolium salts quantified in this assay [11]. Thus, an early decrease in MTT results followed by a slightly later increase is not unexpected. Similar metabolic influence on MTT measures of proliferation could account for the lower relative growth observed for the combination SIRT1&2 knockdown cells at 96 hours post-plating when compared to the same time-point for the trypan blue exclusion assay.
As a further investigation into the impact of SIRT1 and SIRT2 knockdown on melanoma cell growth, a colony formation assay was performed. Live cells were plated in triplicate at equal density and stained with crystal violet to visualize colonies after 7-9 days of growth (Fig. 2D). The results showed marked decreases in the areas of the colonies formed for each of the single knockdown cell lines, as well as for the combination SIRT1&2 knockdown cell line. A closer analysis of the data revealed that the majority of the A375 shNS cell colonies were not only relatively broad, but also had a blurred appearance, suggesting significant radial migration of the cells. The single shSIRT1 and shSIRT2 knockdown cell colonies were much smaller, but still retained an overall blurred appearance, whereas the combination shSIRT1&2 cell colonies were not only small, but had very clear, sharp edges as well. This could suggest a decreased cellular migration rate, and future analysis of migration potential is warranted for these cells.
Effects of shRNA-mediated knockdown of SIRT 1 and/or 2 on global protein changes and their Ingenuity Pathway Analysis (IPA)
As a mechanistic investigation into the anti-proliferative effects of SIRT1 and 2 inhibition, we performed a proteomics evaluation of all four knockdown cell lines. Cells were plated in triplicate and grown for 96 hours prior to collection and analysis via nano-LC-MS/MS on a Q-Exactive spectrometer. A detailed discussion of the decision to use label-free quantitative proteomics, the advantages inherent to this approach, and an explanation of the pilot study performed prior to sample analysis can be found in our previously published study [10].
The initial data analysis was done using SIEVE software to produce a list of proteins within each sample which show an acceptable (>0.75) chromatographic peak alignment with the A375 shNS control. The average alignment scores for our samples were 0.80, 0.89, and 0.87 for shSIRT1, shSIRT2, and shSIRT1&2, respectively. The resulting datasets included 1991, 2839, and 2470 proteins for shSIRT1, shSIRT2, and shSIRT1&2 respectively, and 1730, 2483, and 2117 proteins when only unique peptides were considered in protein identification. We chose to analyze only the datasets with unique peptides, based on the possible impact on protein fold change for peptides that are conserved in more than one protein. We further limited our datasets to proteins that showed a minimum of 4 hits, and showed a fold-change of at least +/- 1.8. This resulted in a total of 7, 2, and 43 upregulated proteins, and 3, 4, and 2 downregulated proteins in the SIRT1, SIRT2 and combination SIRT1&2 knockdown cell lines respectively. The resulting lists of proteins were then uploaded into the Ingenuity Pathway Analysis (IPA) software, and analyzed for the presence of interacting proteins with related functions. The outcome of IPA is discussed below.
shRNA-mediated knockdown of SIRT1 and/or 2 alters proteins involved in cytoskeletal organization
We found a ≥1.8-fold change in the expression of two proteins involved in cytoskeletal organization in both of the single knockdown cell lines, and in multiple proteins in the SIRT1&2 combination knockdown cells (Table 1). Cytoskeletal reorganization is a critical step in the acquisition of migratory properties in tumor cells. The process, known as the epithelial-mesenchymal transition (EMT), was first recognized during embryogenesis, when epithelial cells de-differentiate into a mesenchymal stem cell like state, move to a new location, then redifferentiate and divide [12]. It is characterized by a reorganization of the cytoskeleton promoting a loss of cell polarity, detachment of cellular adhesion structures, and development of cell motility structures such as filopodia and lamellipodia. In addition, cytoskeletal reorganization is a key component of normal chromosomal separation and cell division during the cell cycle [13]. Thus, the change in expression of proteins involved in cytoskeletal reorganization would be predicted to affect both tumor cell metastasis, and cellular proliferation.
Table 1. Cytoskeletal Proteins Associated with SIRT Knockdown.
| Set ID | Gene | Swiss-Prot ID | Description | Peptides | Frames | Hits | N Ratio | Fold Change |
|---|---|---|---|---|---|---|---|---|
| SIRT1 | DPYSL2 | Q16555 | Dihydropyrimidinase_related protein 2 - DPYL2 | 4 | 4 | 41 | 2.166 | 2.166 |
| ABRACL | Q9P1F3 | Costars family protein ABRACL - ABRAL | 2 | 2 | 40 | 0.538 | -1.859 | |
| SIRT2 | DPYSL2 | Q16555 | Dihydropyrimidinase_related protein 2 - DPYL2 | 4 | 5 | 45 | 1.911 | 1.911 |
| ABRACL | Q9P1F3 | Costars family protein ABRACL - ABRAL | 2 | 2 | 39 | 0.417 | -2.398 | |
| SIRT1&2 | STMN1 | P16949 | Stathmin - STMN1 | 2 | 2 | 63 | 4.026 | 4.026 |
| TBCA | O75347 | Tubulin_specific chaperone A -TBCA | 3 | 4 | 28 | 3.199 | 3.199 | |
| DES | P60981 | Destrin - DEST | 2 | 2 | 37 | 2.904 | 2.904 | |
| MAST2 | Q6P0Q8 | Microtubule_associated serine/ threonine_protein kinase 2 -MAST2 | 2 | 2 | 24 | 2.528 | 2.528 | |
| STIP1 | P31948 | Stress_induced_phosphoprotein 1 - STIP1 | 7 | 8 | 174 | 2.358 | 2.358 | |
| HSP90AA 1 | P07900 | Heat shock protein HSP 90_alpha - HS90A | 8 | 10 | 444 | 2.139 | 2.139 | |
| XPO1 | O14980 | Exportin_1 - XPO1 | 3 | 3 | 37 | 2.113 | 2.113 | |
| MAPRE1 | Q15691 | Microtubule_associated protein RP/EB family member 1 -MARE1 | 2 | 2 | 23 | 2.110 | 2.110 | |
| KRT9 | P35527 | Keratin_ type I cytoskeletal 9 -K1C9 | 2 | 2 | 5 | 2.103 | 2.103 | |
| DAAM1 | Q9Y4D1 | Disheveled_associated activator of morphogenesis 1 - DAAM1 | 2 | 2 | 6 | 2.085 | 2.085 | |
| DPYSL2 | Q16555 | Dihydropyrimidinase_related protein 2 - DPYL2 | 3 | 4 | 39 | 2.082 | 2.082 | |
| KRT1 | P04264 | Keratin_ type II cytoskeletal 1 -K2C1 | 2 | 2 | 4 | 2.034 | 2.034 | |
| CHEK1 | O14757 | Serine/threonine_protein kinase Chk1 - CHK1 | 2 | 2 | 14 | 1.988 | 1.988 | |
| FSCN1 | Q16658 | Fascin - FSCN1 | 10 | 12 | 260 | 1.845 | 1.845 | |
| COPB2 | P35606 | Coatomer subunit beta - COPB2 | 4 | 4 | 24 | 1.815 | 1.815 | |
| TGM2 | P21980 | Protein_glutamine gamma_ glutamyltransferase 2 - TGM2 | 2 | 2 | 28 | 0.244 | -4.094 |
The two cytoskeletal-related proteins that change expression in response to the single knockdown of SIRT1 or SIRT2 are ABRACL and DPYSL2. Very little is known about ABRACL, also known as Costars, with research to date mostly involving broad spectrum proteomics or sequencing projects. However, a recent study showed that in the amoeba Dictyostelium discoideum, Costars knockdown results in reduced motility and changes in the actin cytoskeleton, suggesting that its downregulation in our cell lines could have a suppressive effect on cell migration [14]. While its function in humans has not yet been elucidated, its downregulation in our SIRT1 and SIRT2 knockdown cells is worth investigating, especially in light of the reduced colony formation ability in both cells lines.
The second cytoskeletal-related protein affected in both the SIRT1 and SIRT2 knockdown cell lines was the only protein in the entire dataset to show at least 1.8-fold upregulation in all three knockdown cell lines. Dihydropyrimidinase-like 2 (DPYSL2), also known as collapsin response mediator protein 2 (CRMP2), has long been known to promote microtubule assembly [15]. Microtubules function in the cell cycle to separate chromosomes during mitosis. In the case of cancer, they are also involved in both EMT and tumor metastasis through their interactions with the actin cytoskeleton, their role in vesicular trafficking, and their interactions with Rho GTPases [16]. CRMP2 was has been shown to play a role in the cell cycle through stabilization of the mitotic apparatus during cell division [17]. Recent data also show a potential role in tumor cell metastasis, as CRMP2 expression was downregulated in late stage invasive tumor cells relative to early stage cells in a small-intestinal neuroendocrine mouse xenograft study [18]. CRMP2 expression is also decreased in breast cancer tissues, suggesting it could function in tumor suppression [19]. While its role in melanoma is unknown, a growth inhibitory or anti-migratory effect would be predicted by its increased levels in our cells.
Changes in additional proteins known to play roles in microtubule dynamics were found in the SIRT1&2 combination knockdown cells. Stathmin, the most upregulated protein in our dataset, is a highly studied microtubule destabilizing protein. It is overexpressed in many types of cancer, and is thought to play a role in metastasis and EMT initiation [16, 20]. Stathmin was recently identified as a potential oncogene in melanoma, and its >4-fold regulation in our dataset is likely to have pro-metastatic effects [21]. Tubulin binding chaperone A (TBCA) is the second most highly upregulated protein in our shSIRT1&2 cells, and it also likely plays an oncogenic, pro-metastatic role in cancer. While less studied than Stathmin, there is evidence that silencing TBCA results in changes in the microtubule cytoskeleton, initiates G1 phase cell cycle arrest, and induces cell death in breast and ovarian cancer cells [22]. It has also been shown to positively regulate clear cell renal cell carcinoma (ccRCC) metastasis, and its silencing initiates G2/S phase cell cycle arrest in these cells [21].
In addition to the microtubule-associated proteins, the combination shSIRT1&2 dataset was also found to contain several proteins with well-defined roles in the formation of filopodia or lamellopodia. HSP90A, Destrin, DAAM1, and Fascin are known to promote tumor cell migration in this way. HSP90A and Destrin are required for the formation of lamellipodia [23, 24], whereas Fascin and DAAM1 interact to promote the formation of filopodia [25]. However, the status of HSP90A, Destrin, and DAAM1 is unclear in melanoma, and while Fascin expression is increased in metastatic melanoma, the increase does not correlate with tumor progression or overall survival [26]. In addition, a recent study has found that the pan-sirtuin inhibitor nicotinamide, as well as SIRT1 siRNA, inhibit lamellipodia formation in melanoma [27]. This finding brings into question whether upregulation of HSP90A, Fascin, and DAAM1 is sufficient for the formation of motility protrusions in our cells, and further investigation of this possibility is required.
Finally, our SIRT1&2 combination knockdown cells showed >4-fold downregulation in a protein that has been strongly implicated as a tumor promoter. Transglutaminase 2 (TGM2) has a well-established role in protein stabilization as a mediator of Ca-(2+)-dependent lysine-glutamine cross-linkages, but its substrates are numerous, and it participates in a wide variety of cellular processes [28]. While the exact mechanism is still being elucidated, TGM2 is known to be upregulated in many types of cancer, including melanoma, and is strongly associated with chemotherapeutic resistance, tumor cell invasion, and poor patient survival [29]. Its expression has recently been implicated in EMT initiation in breast cancer cells, and silencing TGM2 is sufficient to reverse the transition [29, 30]. Thus, the considerable downregulation of TGM2 in our cells is predicted to induce a tumor suppressive response.
In summary, while the cytoskeletal-related proteins in the SIRT1 and SIRT2 single knockdown cells are predicted to have tumor suppressive effects, the large number of proteins affected by the combined knockdown make any predictions regarding overall tumor impact impossible. Several proteins with predicted oncogenic function are strongly upregulated, while the change in expression observed for others is predicted to result in strong tumor suppressive effects. However, these data provide strong evidence that some sort of cytoskeletal changes are occurring, and further investigation into these changes, and their potential role in EMT, cellular metastasis, and/or the cell cycle, is warranted.
shRNA-mediated knockdown of SIRT1 and/or 2 alters ribosomal proteins
We observed upregulation of several ribosomal proteins (RPs) in the combination SIRT1&2 knockdown cell line, as well as in the SIRT1 single knockdown cells (Table 2). Ribosomal proteins function with ribosomal RNA (rRNA) to form the complete ribosome, with those designated RPS belonging to the small (40S) ribosomal subunit, and RPL proteins belonging to the large (60S) subunit. In addition to their basic role in translation, ribosomal proteins also play a major role as chaperone proteins in ribosome biogenesis. In recent years, additional extra-ribosomal functions of RPs have been discovered, including roles in cellular proliferation, the cell cycle, and apoptosis [31-33].
Table 2. Ribosomal Proteins Associated with SIRT Knockdown.
| Set ID | Gene | Swiss-Prot ID | Description | Peptides | Frames | Hits | N Ratio | Fold Change |
|---|---|---|---|---|---|---|---|---|
| SIRT1 | RPS10 | P46783 | 40S ribosomal protein S10 -RS10 | 2 | 2 | 168 | 2.284 | 2.284 |
| RPS5 | P46782 | 40S ribosomal protein S5 - RS5 | 5 | 7 | 227 | 1.909 | 1.909 | |
| SIRT2 | RPS10 | P46783 | 40S ribosomal protein S10 -RS10 | 2 | 2 | 166 | 1.640 | 1.640 |
| SIRT1&2 | RPS10 | P46783 | 40S ribosomal protein S10 -RS10 | 2 | 2 | 119 | 6.490 | 6.490 |
| RPS11 | P62280 | 40S ribosomal protein S11 -RS11 | 3 | 3 | 70 | 3.139 | 3.139 | |
| RPL27 | P61353 | 60S ribosomal protein L27 -RL27 | 2 | 2 | 17 | 2.632 | 2.632 | |
| RPL7 | P18124 | 60S ribosomal protein L7 RL7 | 4 | 4 | 90 | 2.605 | 2.605 | |
| RPS25 | P62851 | 40S ribosomal protein S25 -RS25 | 3 | 3 | 77 | 2.385 | 2.385 | |
| RPL9 | P32969 | 60S ribosomal protein L9 - RL9 | 3 | 3 | 38 | 2.144 | 2.144 | |
| RPS3a | P61247 | 40S ribosomal protein S3a -RS3A | 7 | 7 | 144 | 1.995 | 1.995 | |
| RPS18 | P62269 | 40S ribosomal protein S18 -RS18 | 4 | 4 | 130 | 1.839 | 1.839 |
Several of the RPs found here to be upregulated in response to shRNA-mediated sirtuin inhibition participate in extra-ribosomal processes. RPS3a has been shown to positively regulate migration of osteosarcoma cells and its suppression in NIH 3T3 cells induces apoptosis, suggesting that its overexpression here would promote cell survival and metastasis [34, 35]. Further support for an overall impact of tumor promotion in our cells is the observed overexpression of both RPS11 and RPL7 in gastric and colorectal cancers, of RPL27 in liver cancer, and of RPS11 in glioblastoma, the latter of which was also associated with shorter patient survival [32, 33]. However, data suggest that several of these proteins play tumor suppressive roles as well, including an observed downregulation of RPS18 in colorectal cancer [32, 33]. Increased expression of RPS5 in murine leukemia cells results in decreased levels of the cyclin-dependent kinases CDK2, CDK4, and CDK6, indicating an anti-proliferative role in these cells [36]. While RPL7 was shown to be overexpressed in some cancers, its constitutive expression in Jurkat T-lymphoma cells induces G1 cell cycle arrest and apoptosis [37]. Extra-ribosomal roles for RPS10 and RPL27 are not clearly defined, however, both are frequently mutated in Diamond-Blackfan anemia, a condition associated with a predisposition to several types of cancer [33]. Finally, there is a clearly defined role for RPS25 in the activation of p53 and the induction of p53-dependent cell cycle arrest and apoptosis upon ribosomal stress [38].
While our data showed the upregulation of several ribosomal proteins in both the SIRT1 and SIRT1&2 combination knockdown cells, the differing functions of the proteins identified make it difficult to draw any conclusions about the overall effect on tumor cell growth. However, it is clear that ribosomal proteins are being activated. The fact that the two cell lines with increased RP activity are the same two which show decreased growth rates relative to normal cells makes further study of the effects of RPs on the growth rate of these cells worthwhile.
Predicted effects of shRNA-mediated knockdown of SIRT1 and 2 on the activity of the tumor suppressor p53
In a previous study involving the use of the SIRT 1 and 2 chemical inhibitor Tenovin-1 in melanoma, we found a decrease in melanoma cell growth and clonogenic survival that correlated with an increase in expression and activity of the tumor suppressor p53 [7]. As p53 is highly involved in numerous cellular processes, including metabolism, cell survival, cell cycle, and genome integrity, and both SIRTs 1 and 2 have been found to be involved in regulation of this protein [39-41], we expected to find the effect of SIRTs-knockdown on p53 in our nano-LC-MS/MS datasets. However, one of the limitations of our study is that the LC-MS system is only capable of analyzing the top proteins during any given sampling period. Therefore, we are only able to report changes in more abundant cellular proteins. However, IPA software allows for prediction of the activity of additional proteins based on changes observed within the dataset, combined with a comparison to an extensive database of known protein interactions. Thus, the IPA analysis was able to provide a prediction of p53 activation, following SIRT knockdown (Fig. 3). Interestingly, in our study, we observed the activation of the ribosomal protein RPS25, following SIRT1&2 combination knockdown. Indeed, RPS25 is known to activate p53 and induce p53-dependent cell cycle arrest and apoptosis upon ribosomal stress [38]. Its upregulation in the SIRT1&2 combination knockdown dataset, but not in the single datasets, could indicate that inhibition of both SIRT1 and SIRT2 is required for the increased p53 activity observed in our previous Tenovin-1 studies. If that is the case, a combination SIRT1&2 inhibitor might be a preferential therapeutic to the inhibition of individual sirtuins. However, further detailed investigation is required to confirm this prediction regarding p53 activity.
Figure 3. Predicted effects of sirtuin knockdown on the activity of the tumor suppressor p53 by Ingenuity Pathway Analysis (IPA).

IPA was used to assess a prediction of association between sirtuins and p53, indirectly via the regulation of p53-related proteins observed in our proteomics study. IPA suggested a potential increase in p53 protein activity following knockdown of shSIRT1&2. Further details are provided in the text.
Effects on additional proteins following shRNA-mediated knockdown of SIRT 1 and/or 2
The list of proteins affected by SIRT1, SIRT2, or combination SIRT1&2 knockdown is not limited to those discussed above, and additional proteins in our datasets that show ≥1.8-fold change can be found in Table 3. While it is beyond the scope of this paper to discuss all of them, there are several additional proteins with functions related to cancer that we would like to highlight.
Table 3. Other SIRT Knockdown-Associated Proteins.
| Set ID | Gene | Swiss-Prot ID | Description | Peptides | Frames | Hits | N Ratio | Fold Change |
|---|---|---|---|---|---|---|---|---|
| SIRT1 | DHX37 | Q8IY37 | Probable ATP_dependent RNA helicase - DHX37 | 2 | 2 | 12 | 2.755 | 2.755 |
| SYQ | P47897 | Glutamine__tRNA ligase - SYQ | 3 | 3 | 65 | 2.159 | 2.159 | |
| SYIC | P41252 | Isoleucine__tRNA ligase_ cytoplasmic - SYIC | 3 | 3 | 29 | 2.069 | 2.069 | |
| CAN1 | P07384 | Calpain_1 catalytic subunit-CAN1 | 2 | 2 | 8 | 1.896 | 1.896 | |
| NSRP1 | Q9H0G5 | Nuclear speckle splicing regulatory protein 1 - NSRP1 | 2 | 2 | 4 | 0.448 | -2.231 | |
| C8AP2 | Q9UKL3 | CASP8_associated protein 2 - C8AP2 | 2 | 2 | 5 | 0.421 | -2.373 | |
| SIRT2 | PEX10 | O60683 | Peroxisome biogenesis factor 10 -PEX10 | 2 | 2 | 4 | 1.801 | 1.801 |
| SAP | P07602 | Proactivator polypeptide - SAP | 3 | 3 | 28 | 0.540 | -1.853 | |
| S10AD | Q99584 | Protein S100_A13 - S10AD | 2 | 2 | 89 | 0.444 | -2.252 | |
| NEST | P48681 | Nestin - NEST | 16 | 16 | 341 | 0.428 | -2.338 | |
| SIRT1&2 | CH10 | P61604 | 10 kDa heat shock protein_ mitochondrial - CH10 | 4 | 4 | 78 | 2.957 | 2.957 |
| AHNK | Q09666 | Neuroblast differentiation_associated protein AHNAK-AHNK | 4 | 2 | 36 | 2.839 | 2.839 | |
| PSA1 | P25786 | Proteasome subunit alpha type_1 -PSA1 | 2 | 2 | 12 | 2.749 | 2.749 | |
| PGK1 | P00558 | Phosphoglycerate kinase 1 - PGK1 | 8 | 10 | 447 | 2.496 | 2.496 | |
| GSTP1 | P09211 | Glutathione S_transferase P-GSTP1 | 4 | 5 | 108 | 2.478 | 2.478 | |
| SYQ | P47897 | Glutamine__tRNA ligase - SYQ | 11 | 11 | 179 | 2.429 | 2.429 | |
| S10AG | Q96FQ6 | Protein S100_A16 - S10AG | 3 | 3 | 62 | 2.428 | 2.428 | |
| UBP14 | P54578 | Ubiquitin carboxyl_terminal hydrolase 14 - UBP14 | 2 | 2 | 12 | 2.402 | 2.402 | |
| SAHH | P23526 | Adenosylhomocysteinase - SAHH | 8 | 8 | 160 | 2.252 | 2.252 | |
| NONO | Q15233 | Non_POU domain_containing octamer binding protein-NONO | 3 | 3 | 29 | 2.226 | 2.226 | |
| H4 | P62805 | Histone H4 - H4 | 3 | 5 | 84 | 2.193 | 2.193 | |
| HSP90 AA1 | P07900 | Heat shock protein HSP 90_alpha -HS90A | 8 | 10 | 444 | 2.139 | 2.139 | |
| IPYR | Q15181 | Inorganic pyrophosphatase - IPYR | 2 | 2 | 25 | 2.080 | 2.080 | |
| SMD3 | P62318 | Small nuclear ribonucleo-protein Sm D3 - SMD3 | 2 | 2 | 36 | 2.023 | 2.023 | |
| NOG1 | Q9BZE4 | Nucleolar GTP_binding protein 1-NOG1 | 2 | 2 | 24 | 1.984 | 1.984 | |
| AMPL | P28838 | Cytosol aminopeptidase - AMPL | 2 | 2 | 14 | 1.966 | 1.966 | |
| PRDX6 | P30041 | Peroxiredoxin_6 - PRDX6 | 10 | 11 | 326 | 1.921 | 1.921 | |
| ELYS | Q8WYP5 | Protein ELYS - ELYS | 2 | 2 | 8 | 1.909 | 1.909 | |
| PAPS2 | O95340 | Bifunctional 3_phosphoadeno-sine 5_phosphosulfate synthase 2 - PAPS2 | 4 | 4 | 15 | 1.887 | 1.887 | |
| SUGT1 | Q9Y2Z0 | Suppressor of G2 allele of SKP1 homolog - SUGT1 | 3 | 4 | 37 | 1.874 | 1.874 | |
| GSHB | P48637 | Glutathione synthetase - GSHB | 2 | 2 | 12 | 1.799 | 1.799 | |
| NEST | P48681 | Nestin - NEST | 24 | 24 | 564 | 0.533 | -1.878 |
In the SIRT1&2 combination knockdown cells, three proteins with functions in the oxidative stress response are upregulated: peroxiredoxin 6 (PRDX6), glutathione s transferase p (GSTP1), and glutathione synthetase (GSS). Peroxiredoxin and glutathione are both endogenous antioxidants, and glutathione s transferases and synthetases play roles in the regulation of glutathione detoxification activity and expression, respectively [42-44]. While the increased expression of antioxidants is a common phenomenon in cancer cells, it can lead to interference with normal redox homeostasis and chemotherapeutic resistance [45]. PRDX6 has been shown to play a specific role in melanoma cell growth, and GSPT1 inhibition leads to increased susceptibility to chemotherapeutics in melanoma [46, 47]. While the role of GSS in melanoma is unclear, the increased expression of players in the oxidative stress response and redox signaling is worth noting, especially in light of the roles that sirtuins 1 and 2 have been shown to play in response to oxidative stress in the skin [48, 49].
AHNAK is an interesting protein in that it was discovered over 25 years ago, and yet its molecular function has still not been clearly defined [50]. However, it does appear that it plays a role in cancer. While AHNAK has been linked to poor survival in laryngeal carcinoma, and to be overexpressed and increase cell migration in mesothelioma, it has been shown to act through TGF-β as a tumor suppressor in breast cancer [51-53]. Thus, its role as a tumor suppressor or promoter is unclear. AHNAK was not studied in melanoma until recently, when a study revealed that AHNAK is commonly downregulated in metastatic melanoma, and that its downregulation correlates with a poor prognosis [54]. While there was previously no known connection between AHNAK and the sirtuins, its upregulation in our SIRT1&2 knockdown cells therefore suggests that AHNAK could play a tumor suppressive role in response to sirtuin inhibition in melanoma.
Nestin is another protein of interest in the study of tumor metastasis. Nestin is an intermediate filament protein, and as such, could also have been discussed in the context of cytoskeletal reorganization [55]. However, in recent years, it has been more actively studied for its role in cancer. Of particular significance, a strong case has been made for Nestin as a cancer stem cell marker [56]. It has also been implicated in angiogenesis, which is critical for the survival of metastatic cancer in its new location [57]. Even more relevant, Nestin has been associated with aggressive, metastatic melanomas, poor patient prognosis, and its inhibition has been shown to reduce melanoma growth and invasiveness [58-61]. In our datasets, Nestin is not only downregulated in the SIRT1&SIRT2 combination knockdown cells, but also in the SIRT2 single knockdown cells. This suggests that knockdown of SIRT2 might reduce melanoma aggressiveness and metastatic potential. While we did not observe a decrease in growth for the SIRT2 knockdown cells, a shift in phenotype away from a cancer stem cell like state, with reduced angiogenic capabilities, would not have been evident in this type of assay. This type of shift would be beneficial in the treatment of melanoma, and this finding indicates that further investigation into SIRT2 is warranted.
Finally, in addition to its roles in cytoskeletal reorganization, HSP90A has been studied extensively as a tumor promoter, as it interacts with multiple tumor-promoting proteins such as TGF-β, which has a well-established role in EMT induction [12, 62]. Several HSP90 inhibitors have been developed, but while they are successful in inhibiting tumor growth, cancer cells begin proliferating again when the treatment is stopped [63]. Recent studies have shown that resistance to HSP90 inhibitors is overcome when SIRT1 is inhibited as a combination treatment in both chronic myeloid leukemia and multidrug-resistant lymphoblastic leukemia [64, 65]. This is interesting given the upregulation of HSP90A in our SIRT1&2 combination knockdown cells. There is clearly a mixed response of both tumor promoters and suppressors in response to SIRT1&2 combination knockdown. However, we still observed an overall effect of growth inhibition in this cell line. It is possible that this growth reduction could be magnified through combined inhibition with some of the oncogenic proteins found to be upregulated here. Further study into combination therapies with sirtuin inhibitors could prove to be a useful strategy in the development of effective melanoma treatment.
Conclusion
We have shown that the shRNA-mediated inhibition of SIRT1 results in reduced growth of A375 melanoma cells. While knockdown of SIRT2 does not significantly affect melanoma cell growth alone, the combined inhibition of SIRT1 and SIRT2 results in amplification of the growth inhibition seen with SIRT1 inhibition alone. Interestingly, there are significant changes in colony formation abilities in response to all three knockdowns: SIRT1, SIRT2 and SIRT1&2 combination. The difference was not immediately apparent in the number of colonies that formed, but rather in the diameter of the colonies present, encouraging further investigation into a potential role in cell migration for both SIRT1 and SIRT2.
In response to shRNA-mediated SIRT1 and/or SIRT2 inhibition, we have identified a number of proteins previously unknown to be associated with or affected by sirtuin activity. The first set of proteins identified in all three knockdown sets of cells are involved in microtubule dynamics. While both sirtuins have been shown to be involved in regulation of microtubules previously, their effects on the proteins identified in our screen have not been enumerated to date. We found greater than 1.8-fold changes in 2, 2, and 16 cytoskeletal-linked proteins in the shSIRT1, shSIRT2, and shSIRT1&2 cells, respectively. This suggests that inhibition of both sirtuins has a larger effect on cytoskeletal organization than the inhibition of either alone. However, several of the protein regulation findings seem to contradict each other, which leaves the question of the exact mechanism of regulation of cytoskeletal proteins unanswered. The same trend was found in the ribosomal proteins. Greater than 1.8-fold protein levels were identified in 2, 1, and 8 ribosomal protein levels in the shSIRT1, shSIRT2, and shSIRT1&2 cells, respectively, suggesting that they are being modulated at a much greater frequency by the combination knockdown of SIRTs 1&2, than by either of these sirtuins alone. A key example of this is the protein RPS10, which was ∼2-fold greater in both the SIRT1 and SIRT2 sets, but ∼6.5-fold greater in the dual knockdown set. In addition, several other proteins were found to be modulated by the shSIRT1, shSIRT2, and shSIRT1&2 knockdown (6, 4, and 22, respectively; with ≥1.8-fold cutoff). Many of these proteins are known to play roles in critical tumor promoter functions such as angiogenesis, oxidative stress, and EMT. As with the cytoskeletal and ribosomal protein sets, the SIRT1&2 combined knockdown affects the expression of a large number of proteins, suggesting that the two sirtuins are closely tied together, and their interactions should be considered when targeting them for future experiments.
There are several implications of these findings in regards to the use of targeted inhibition of sirtuins in the treatment of melanoma. The finding that SIRT1&2 combination knockdown shows enhanced growth inhibition over either protein alone suggests that a combination therapy could be a superior approach over individual knockdown. However, the resulting upregulation of a mix of proteins with predicted tumor promoter and suppressor functions suggests that the vast number of sirtuin targets might make them poor candidates for inhibition, and downstream proteins should instead be targeted. This paradoxical response of the cellular proteins could also explain the conflicting reports of sirtuins functioning as tumor promoters or suppressors in different contexts. As an alternative to targeting multiple proteins downstream of sirtuins, combination therapies involving inhibition of one or more sirtuins as well as the major tumor promoters upregulated in our dataset could also prove effective, as in the case of HSP90 and SIRT1 inhibition. An additional candidate for combination therapy is Stathmin, since it is highly upregulated in response to sirtuin inhibition and plays such a strong role in tumor promotion. Finally, it is worth exploring whether Nestin inhibition in combination with SIRT1 (but not SIRT2) knockdown would be an effective alternative to a SIRT1&2 combination approach. Further investigation into several of these possibilities could prove useful in the development of effective melanoma treatments.
Highlights.
Inhibition of SIRT1 or SIRTs 1&2 reduces melanoma cell growth and clonogenicity.
Combined SIRT1 and SIRT2 inhibition has enhanced growth inhibition over either alone.
shRNA-mediated inhibition of SIRTs 1&2 affects cytoskeletal protein expression.
Ribosomal protein expression was altered in SIRT1 and SIRT 1&2 knockdown lines.
Significance.
Melanoma is the deadliest form of skin cancer, due to its aggressive nature, metastatic potential, and a lack of sufficient treatment options for advanced disease. Therefore, detailed investigations into the molecular mechanisms of melanoma growth and progression are needed. In the search for candidate genes to serve as therapeutic targets, the sirtuins show promise as they have been found to be upregulated in melanoma and they regulate a large number of proteins involved in cellular processes known to affect tumor growth, such as DNA damage repair, cell cycle arrest, and apoptosis. In this study, we used a large-scale label-free comparative proteomics system to identify novel protein targets that are affected following knockdown of SIRT1 and/or 2 in A375 metastatic melanoma cell line. Our study offers important insight into the potential downstream targets of SIRTs 1 and/or 2. This may unravel new potential areas of exploration in melanoma research
Acknowledgments
This work was supported by funding from the NIH (R01AR059130 and R01CA176748 to NA, and R01CA157429, R01CA192894, R01CA196835, R01CA196634 to XL), and the Department of Veterans Affairs (VA Merit Review Awards I01BX001008 and I01CX001441; and a Research Career Scientist Award IK6BX003780 to NA). We also acknowledge support from the NIH in form of the High-End, Shared Instrumentation grant (1S10RR029531) to the Analytical Instrumentation Center of the School of Pharmacy, for mass spectrometric analyses. In addition, we acknowledge the core facilities supported by the Skin Diseases Research Center (SDRC) Core Grant P30AR066524 from NIH/NIAMS.
Footnotes
Conflicts of Interest: The authors have no potential conflicts of interest to disclose.
Publisher's Disclaimer: This is a PDF file of an unedited manuscript that has been accepted for publication. As a service to our customers we are providing this early version of the manuscript. The manuscript will undergo copyediting, typesetting, and review of the resulting proof before it is published in its final citable form. Please note that during the production process errors may be discovered which could affect the content, and all legal disclaimers that apply to the journal pertain.
References
- 1.Siegel RL, Miller KD, Jemal A. Cancer Statistics, 2017. CA Cancer J Clin. 2017;67:7–30. doi: 10.3322/caac.21387. [DOI] [PubMed] [Google Scholar]
- 2.Tang T, Eldabaje R, Yang L. Current Status of Biological Therapies for the Treatment of Metastatic Melanoma. Anticancer Res. 2016;36:3229–41. [PubMed] [Google Scholar]
- 3.Lawson M, Uciechowska U, Schemies J, Rumpf T, Jung M, Sippl W. Inhibitors to understand molecular mechanisms of NAD(+)-dependent deacetylases (sirtuins) Biochim Biophys Acta. 2010;1799:726–39. doi: 10.1016/j.bbagrm.2010.06.003. [DOI] [PubMed] [Google Scholar]
- 4.Grabowska W, Sikora E, Bielak-Zmijewska A. Sirtuins, a promising target in slowing down the ageing process. Biogerontology. 2017;18:446–7. doi: 10.1007/s10522-017-9685-9. [DOI] [PMC free article] [PubMed] [Google Scholar]
- 5.North BJ, Verdin E. Interphase nucleo-cytoplasmic shuttling and localization of SIRT2 during mitosis. PLoS One. 2007;2:e784. doi: 10.1371/journal.pone.0000784. [DOI] [PMC free article] [PubMed] [Google Scholar]
- 6.Tanno M, Sakamoto J, Miura T, Shimamoto K, Horio Y. Nucleocytoplasmic shuttling of the NAD+-dependent histone deacetylase SIRT1. J Biol Chem. 2007;282:6823–32. doi: 10.1074/jbc.M609554200. [DOI] [PubMed] [Google Scholar]
- 7.Wilking MJ, Singh C, Nihal M, Zhong W, Ahmad N. SIRT1 deacetylase is overexpressed in human melanoma and its small molecule inhibition imparts anti-proliferative response via p53 activation. Arch Biochem Biophys. 2014;563:94–100. doi: 10.1016/j.abb.2014.04.001. [DOI] [PMC free article] [PubMed] [Google Scholar]
- 8.Wilking MJ, Ndiaye MA, Huang W, Ahmad N. Expression profile of SIRT2 in human melanoma and implications for sirtuin-based chemotherapy. Cell Cycle. 2017;16:574–7. doi: 10.1080/15384101.2017.1288323. [Available on 2018-02-06] [DOI] [PMC free article] [PubMed] [Google Scholar]
- 9.Schmit TL, Zhong W, Setaluri V, Spiegelman VS, Ahmad N. Targeted depletion of Polo-like kinase (Plk) 1 through lentiviral shRNA or a small-molecule inhibitor causes mitotic catastrophe and induction of apoptosis in human melanoma cells. J Invest Dermatol. 2009;129:2843–53. doi: 10.1038/jid.2009.172. [DOI] [PMC free article] [PubMed] [Google Scholar]
- 10.Cholewa BD, Pellitteri-Hahn MC, Scarlett CO, Ahmad N. Large-scale label-free comparative proteomics analysis of polo-like kinase 1 inhibition via the small-molecule inhibitor BI 6727 (Volasertib) in BRAF(V600E) mutant melanoma cells. J Proteome Res. 2014;13:5041–50. doi: 10.1021/pr5002516. [DOI] [PMC free article] [PubMed] [Google Scholar]
- 11.Berridge MV, Herst PM, Tan AS. Tetrazolium dyes as tools in cell biology: new insights into their cellular reduction. Biotechnol Annu Rev. 2005;11:127–52. doi: 10.1016/S1387-2656(05)11004-7. [DOI] [PubMed] [Google Scholar]
- 12.Yilmaz M, Christofori G. EMT, the cytoskeleton, and cancer cell invasion. Cancer Metastasis Rev. 2009;28:15–33. doi: 10.1007/s10555-008-9169-0. [DOI] [PubMed] [Google Scholar]
- 13.Hall A. The cytoskeleton and cancer. Cancer Metastasis Rev. 2009;28:5–14. doi: 10.1007/s10555-008-9166-3. [DOI] [PubMed] [Google Scholar]
- 14.Pang TL, Chen FC, Weng YL, Liao HC, Yi YH, Ho CL, Lin CH, Chen MY. Costars, a Dictyostelium protein similar to the C-terminal domain of STARS, regulates the actin cytoskeleton and motility. J Cell Sci. 2010;123:3745–55. doi: 10.1242/jcs.064709. [DOI] [PubMed] [Google Scholar]
- 15.Fukata Y, Itoh TJ, Kimura T, Menager C, Nishimura T, Shiromizu T, Watanabe H, Inagaki N, Iwamatsu A, Hotani H, Kaibuchi K. CRMP-2 binds to tubulin heterodimers to promote microtubule assembly. Nat Cell Biol. 2002;4:583–91. doi: 10.1038/ncb825. [DOI] [PubMed] [Google Scholar]
- 16.Fife CM, McCarroll JA, Kavallaris M. Movers and shakers: cell cytoskeleton in cancer metastasis. Br J Pharmacol. 2014;171:5507–23. doi: 10.1111/bph.12704. [DOI] [PMC free article] [PubMed] [Google Scholar]
- 17.Lin PC, Chan PM, Hall C, Manser E. Collapsin response mediator proteins (CRMPs) are a new class of microtubule-associated protein (MAP) that selectively interacts with assembled microtubules via a taxol-sensitive binding interaction. J Biol Chem. 2011;286:41466–78. doi: 10.1074/jbc.M111.283580. [DOI] [PMC free article] [PubMed] [Google Scholar]
- 18.Couderc C, Bollard J, Coute Y, Massoma P, Poncet G, Lepinasse F, Hervieu V, Gadot N, Sanchez JC, Scoazec JY, Diaz JJ, Roche C. Mechanisms of local invasion in enteroendocrine tumors: identification of novel candidate cytoskeleton-associated proteins in an experimental mouse model by a proteomic approach and validation in human tumors. Mol Cell Endocrinol. 2015;399:154–63. doi: 10.1016/j.mce.2014.09.006. [DOI] [PubMed] [Google Scholar]
- 19.Shimada K, Ishikawa T, Nakamura F, Shimizu D, Chishima T, Ichikawa Y, Sasaki T, Endo I, Nagashima Y, Goshima Y. Collapsin response mediator protein 2 is involved in regulating breast cancer progression. Breast Cancer. 2014;21:715–23. doi: 10.1007/s12282-013-0447-5. [DOI] [PubMed] [Google Scholar]
- 20.Lu Y, Liu C, Xu YF, Cheng H, Shi S, Wu CT, Yu XJ. Stathmin destabilizing microtubule dynamics promotes malignant potential in cancer cells by epithelial-mesenchymal transition. Hepatobiliary Pancreat Dis Int. 2014;13:386–94. doi: 10.1016/s1499-3872(14)60038-2. [DOI] [PubMed] [Google Scholar]
- 21.Zhang P, Ma X, Song E, Chen W, Pang H, Ni D, Gao Y, Fan Y, Ding Q, Zhang Y, Zhang X. Tubulin cofactor A functions as a novel positive regulator of ccRCC progression, invasion and metastasis. Int J Cancer. 2013;133:2801–11. doi: 10.1002/ijc.28306. [DOI] [PubMed] [Google Scholar]
- 22.Nolasco S, Bellido J, Goncalves J, Zabala JC, Soares H. Tubulin cofactor A gene silencing in mammalian cells induces changes in microtubule cytoskeleton, cell cycle arrest and cell death. FEBS Lett. 2005;579:3515–24. doi: 10.1016/j.febslet.2005.05.022. [DOI] [PubMed] [Google Scholar]
- 23.Mizuno K. Signaling mechanisms and functional roles of cofilin phosphorylation and dephosphorylation. Cell Signal. 2013;25:457–69. doi: 10.1016/j.cellsig.2012.11.001. [DOI] [PubMed] [Google Scholar]
- 24.Sidera K, Samiotaki M, Yfanti E, Panayotou G, Patsavoudi E. Involvement of cell surface HSP90 in cell migration reveals a novel role in the developing nervous system. J Biol Chem. 2004;279:45379–88. doi: 10.1074/jbc.M405486200. [DOI] [PubMed] [Google Scholar]
- 25.Jaiswal R, Breitsprecher D, Collins A, Correa IR, Jr, Xu MQ, Goode BL. The formin Daam1 and fascin directly collaborate to promote filopodia formation. Curr Biol. 2013;23:1373–9. doi: 10.1016/j.cub.2013.06.013. [DOI] [PMC free article] [PubMed] [Google Scholar]
- 26.Ma Y, Faller WJ, Sansom OJ, Brown ER, Doig TN, Melton DW, Machesky LM. Fascin expression is increased in metastatic lesions but does not correlate with progression nor outcome in melanoma. Melanoma Res. 2015;25:169–72. doi: 10.1097/CMR.0000000000000135. [DOI] [PubMed] [Google Scholar]
- 27.Kunimoto R, Jimbow K, Tanimura A, Sato M, Horimoto K, Hayashi T, Hisahara S, Sugino T, Hirobe T, Yamashita T, Horio Y. SIRT1 regulates lamellipodium extension and migration of melanoma cells. J Invest Dermatol. 2014;134:1693–700. doi: 10.1038/jid.2014.50. [DOI] [PubMed] [Google Scholar]
- 28.Park D, Choi SS, Ha KS. Transglutaminase 2: a multi-functional protein in multiple subcellular compartments. Amino Acids. 2010;39:619–31. doi: 10.1007/s00726-010-0500-z. [DOI] [PubMed] [Google Scholar]
- 29.Mehta K, Kumar A, Kim HI. Transglutaminase 2: a multi-tasking protein in the complex circuitry of inflammation and cancer. Biochem Pharmacol. 2010;80:1921–9. doi: 10.1016/j.bcp.2010.06.029. [DOI] [PubMed] [Google Scholar]
- 30.He W, Sun Z, Liu Z. Silencing of TGM2 reverses epithelial to mesenchymal transition and modulates the chemosensitivity of breast cancer to docetaxel. Exp Ther Med. 2015;10:1413–1418. doi: 10.3892/etm.2015.2679. [DOI] [PMC free article] [PubMed] [Google Scholar]
- 31.de Las Heras-Rubio A, Perucho L, Paciucci R, Vilardell J, ME LL. Ribosomal proteins as novel players in tumorigenesis. Cancer Metastasis Rev. 2014;33:115–41. doi: 10.1007/s10555-013-9460-6. [DOI] [PubMed] [Google Scholar]
- 32.Wang W, Nag S, Zhang X, Wang MH, Wang H, Zhou J, Zhang R. Ribosomal proteins and human diseases: pathogenesis, molecular mechanisms, and therapeutic implications. Med Res Rev. 2015;35:225–85. doi: 10.1002/med.21327. [DOI] [PMC free article] [PubMed] [Google Scholar]
- 33.Xu X, Xiong X, Sun Y. The role of ribosomal proteins in the regulation of cell proliferation, tumorigenesis, and genomic integrity. Sci China Life Sci. 2016;59:656–72. doi: 10.1007/s11427-016-0018-0. [DOI] [PubMed] [Google Scholar]
- 34.Nagao-Kitamoto H, Setoguchi T, Kitamoto S, Nakamura S, Tsuru A, Nagata M, Nagano S, Ishidou Y, Yokouchi M, Kitajima S, Yoshioka T, Maeda S, Yonezawa S, Komiya S. Ribosomal protein S3 regulates GLI2-mediated osteosarcoma invasion. Cancer Lett. 2015;356:855–61. doi: 10.1016/j.canlet.2014.10.042. [DOI] [PubMed] [Google Scholar]
- 35.Naora H, Takai I, Adachi M. Altered cellular responses by varying expression of a ribosomal protein gene: sequential coordination of enhancement and suppression of ribosomal protein S3a gene expression induces apoptosis. J Cell Biol. 1998;141:741–53. doi: 10.1083/jcb.141.3.741. [DOI] [PMC free article] [PubMed] [Google Scholar]
- 36.Matragkou CN, Papachristou ET, Tezias SS, Tsiftsoglou AS, Choli-Papadopoulou T, Vizirianakis IS. The potential role of ribosomal protein S5 on cell cycle arrest and initiation of murine erythroleukemia cell differentiation. J Cell Biochem. 2008;104:1477–90. doi: 10.1002/jcb.21722. [DOI] [PubMed] [Google Scholar]
- 37.Neumann F, Krawinkel U. Constitutive expression of human ribosomal protein L7 arrests the cell cycle in G1 and induces apoptosis in Jurkat T-lymphoma cells. Exp Cell Res. 1997;230:252–61. doi: 10.1006/excr.1996.3417. [DOI] [PubMed] [Google Scholar]
- 38.Zhang X, Wang W, Wang H, Wang MH, Xu W, Zhang R. Identification of ribosomal protein S25 (RPS25)-MDM2-p53 regulatory feedback loop. Oncogene. 2013;32:2782–91. doi: 10.1038/onc.2012.289. [DOI] [PMC free article] [PubMed] [Google Scholar]
- 39.Gonfloni S, Iannizzotto V, Maiani E, Bellusci G, Ciccone S, Diederich M. P53 and Sirt1: routes of metabolism and genome stability. Biochem Pharmacol. 2014;92:149–56. doi: 10.1016/j.bcp.2014.08.034. [DOI] [PubMed] [Google Scholar]
- 40.van Leeuwen IM, Higgins M, Campbell J, McCarthy AR, Sachweh MC, Navarro AM, Lain S. Modulation of p53 C-terminal acetylation by mdm2, p14ARF, and cytoplasmic SirT2. Mol Cancer Ther. 2013;12:471–80. doi: 10.1158/1535-7163.MCT-12-0904. [DOI] [PubMed] [Google Scholar]
- 41.van Leeuwen I, Lain S. Sirtuins and p53. Adv Cancer Res. 2009;102:171–95. doi: 10.1016/S0065-230X(09)02005-3. [DOI] [PubMed] [Google Scholar]
- 42.Hayes JD, Flanagan JU, Jowsey IR. Glutathione transferases. Annu Rev Pharmacol Toxicol. 2005;45:51–88. doi: 10.1146/annurev.pharmtox.45.120403.095857. [DOI] [PubMed] [Google Scholar]
- 43.Kwee JK. A paradoxical chemoresistance and tumor suppressive role of antioxidant in solid cancer cells: a strange case of Dr. Jekyll and Mr. Hyde Biomed Res Int. 2014;2014:209845. doi: 10.1155/2014/209845. [DOI] [PMC free article] [PubMed] [Google Scholar]
- 44.Njalsson R, Norgren S. Physiological and pathological aspects of GSH metabolism. Acta Paediatr. 2005;94:132–7. doi: 10.1111/j.1651-2227.2005.tb01878.x. [DOI] [PubMed] [Google Scholar]
- 45.Marengo B, Nitti M, Furfaro AL, Colla R, Ciucis CD, Marinari UM, Pronzato MA, Traverso N, Domenicotti C. Redox Homeostasis and Cellular Antioxidant Systems: Crucial Players in Cancer Growth and Therapy. Oxid Med Cell Longev. 2016;2016:6235641. doi: 10.1155/2016/6235641. [DOI] [PMC free article] [PubMed] [Google Scholar]
- 46.Depeille P, Cuq P, Passagne I, Evrard A, Vian L. Combined effects of GSTP1 and MRP1 in melanoma drug resistance. Br J Cancer. 2005;93:216–23. doi: 10.1038/sj.bjc.6602681. [DOI] [PMC free article] [PubMed] [Google Scholar]
- 47.Schmitt A, Schmitz W, Hufnagel A, Schartl M, Meierjohann S. Peroxiredoxin 6 triggers melanoma cell growth by increasing arachidonic acid-dependent lipid signalling. Biochem J. 2015;471:267–79. doi: 10.1042/BJ20141204. [DOI] [PubMed] [Google Scholar]
- 48.Rinnerthaler M, Bischof J, Streubel MK, Trost A, Richter K. Oxidative stress in aging human skin. Biomolecules. 2015;5:545–89. doi: 10.3390/biom5020545. [DOI] [PMC free article] [PubMed] [Google Scholar]
- 49.Kammeyer A, Luiten RM. Oxidation events and skin aging. Ageing Res Rev. 2015;21:16–29. doi: 10.1016/j.arr.2015.01.001. [DOI] [PubMed] [Google Scholar]
- 50.Davis TA, Loos B, Engelbrecht AM. AHNAK: the giant jack of all trades. Cell Signal. 2014;26:2683–93. doi: 10.1016/j.cellsig.2014.08.017. [DOI] [PubMed] [Google Scholar]
- 51.Dumitru CA, Bankfalvi A, Gu X, Zeidler R, Brandau S, Lang S. AHNAK and inflammatory markers predict poor survival in laryngeal carcinoma. PLoS One. 2013;8:e56420. doi: 10.1371/journal.pone.0056420. [DOI] [PMC free article] [PubMed] [Google Scholar]
- 52.Lee IH, Sohn M, Lim HJ, Yoon S, Oh H, Shin S, Shin JH, Oh SH, Kim J, Lee DK, Noh DY, Bae DS, Seong JK, Bae YS. Ahnak functions as a tumor suppressor via modulation of TGFbeta/Smad signaling pathway. Oncogene. 2014;33:4675–84. doi: 10.1038/onc.2014.69. [DOI] [PMC free article] [PubMed] [Google Scholar]
- 53.Sudo H, Tsuji AB, Sugyo A, Abe M, Hino O, Saga T. AHNAK is highly expressed and plays a key role in cell migration and invasion in mesothelioma. Int J Oncol. 2014;44:530–8. doi: 10.3892/ijo.2013.2183. [DOI] [PubMed] [Google Scholar]
- 54.Sheppard HM, Feisst V, Chen J, Print C, Dunbar PR. AHNAK is downregulated in melanoma, predicts poor outcome, and may be required for the expression of functional cadherin-1. Melanoma Res. 2016;26:108–16. doi: 10.1097/CMR.0000000000000228. [DOI] [PMC free article] [PubMed] [Google Scholar]
- 55.Michalczyk K, Ziman M. Nestin structure and predicted function in cellular cytoskeletal organisation. Histol Histopathol. 2005;20:665–71. doi: 10.14670/HH-20.665. [DOI] [PubMed] [Google Scholar]
- 56.Neradil J, Veselska R. Nestin as a marker of cancer stem cells. Cancer Sci. 2015;106:803–11. doi: 10.1111/cas.12691. [DOI] [PMC free article] [PubMed] [Google Scholar]
- 57.Matsuda Y, Hagio M, Ishiwata T. Nestin: a novel angiogenesis marker and possible target for tumor angiogenesis. World J Gastroenterol. 2013;19:42–8. doi: 10.3748/wjg.v19.i1.42. [DOI] [PMC free article] [PubMed] [Google Scholar]
- 58.Akiyama M, Matsuda Y, Ishiwata T, Naito Z, Kawana S. Inhibition of the stem cell marker nestin reduces tumor growth and invasion of malignant melanoma. J Invest Dermatol. 2013;133:1384–7. doi: 10.1038/jid.2012.508. [DOI] [PubMed] [Google Scholar]
- 59.Fusi A, Reichelt U, Busse A, Ochsenreither S, Rietz A, Maisel M, Keilholz U. Expression of the stem cell markers nestin and CD133 on circulating melanoma cells. J Invest Dermatol. 2011;131:487–94. doi: 10.1038/jid.2010.285. [DOI] [PubMed] [Google Scholar]
- 60.Ladstein RG, Bachmann IM, Straume O, Akslen LA. Nestin expression is associated with aggressive cutaneous melanoma of the nodular type. Mod Pathol. 2014;27:396–401. doi: 10.1038/modpathol.2013.151. [DOI] [PubMed] [Google Scholar]
- 61.Piras F, Perra MT, Murtas D, Minerba L, Floris C, Maxia C, Demurtas P, Ugalde J, Ribatti D, Sirigu P. The stem cell marker nestin predicts poor prognosis in human melanoma. Oncol Rep. 2010;23:17–24. [PubMed] [Google Scholar]
- 62.Wrighton KH, Lin X, Feng XH. Critical regulation of TGFbeta signaling by Hsp90. Proc Natl Acad Sci U S A. 2008;105:9244–9. doi: 10.1073/pnas.0800163105. [DOI] [PMC free article] [PubMed] [Google Scholar]
- 63.Barrott JJ, Haystead TA. Hsp90, an unlikely ally in the war on cancer. FEBS J. 2013;280:1381–96. doi: 10.1111/febs.12147. [DOI] [PMC free article] [PubMed] [Google Scholar]
- 64.Kim HB, Lee SH, Um JH, Kim MJ, Hyun SK, Gong EJ, Oh WK, Kang CD, Kim SH. Sensitization of chemo-resistant human chronic myeloid leukemia stem-like cells to Hsp90 inhibitor by SIRT1 inhibition. Int J Biol Sci. 2015;11:923–34. doi: 10.7150/ijbs.10896. [DOI] [PMC free article] [PubMed] [Google Scholar]
- 65.Kim HB, Lee SH, Um JH, Oh WK, Kim DW, Kang CD, Kim SH. Sensitization of multidrug-resistant human cancer cells to Hsp90 inhibitors by down-regulation of SIRT1. Oncotarget. 2015;6:36202–18. doi: 10.18632/oncotarget.5343. [DOI] [PMC free article] [PubMed] [Google Scholar]