Abstract
Objective
Hematocrit in narrow vessels is reduced due to concentration of fast flowing red blood cells (RBC) in the center, and of slower flowing plasma along the wall of the vessel, which in combination with plasma skimming at bifurcations leads to the striking heterogeneity of local hematocrit in branching capillary networks known as the network Fåhræus effect. We analyzed the influence of feeding hematocrit and perfusion pressure on the Fåhræus effect in an artificial microvascular network (AMVN).
Methods
RBC suspensions in plasma with hematocrits between 20–70% were perfused at pressures of 5–60 cmH2O through the AMVN. A microscope and high-speed camera were used to measure RBC velocity and hematocrit in microchannels of height of 5 μm and widths of 5–19 μm.
Results
Channel hematocrits were reduced compared with feeding hematocrits in 5 μm and 7 μm, but not in larger microchannels. The magnitude of hematocrit reduction increased with decreasing feeding hematocrit and decreasing perfusion pressure (flow velocity), showing an about 7-fold higher effect for 40% feeding hematocrit and low pressure/flow velocity than for 60% feeding hematocrit and high pressure/flow velocity.
Conclusions
The magnitude of the network Fåhræus effect in an AMVN is inversely related to feeding hematocrit and perfusion pressure.
Keywords: Artificial microvascular network, Hematocrit, Microvascular Perfusion, Red blood cell, Fåhræus effect
Introduction
Hematocrit (Hct) is the volume fraction of red blood cells (RBCs) in blood. Normal values of systemic Hct are between 35–45% in women and 40–50% in men. However, the actual Hct in individual blood vessels throughout the circulation may deviate significantly from these systemic values. Early observations of blood flowing through glass tubes showed that the Hct of blood in narrow tubes was lower than the systemic Hct of blood feeding the tubes 9. The impact of this reduction of Hct occurring in narrow blood vessels (known now as the Fåhræus effect) on vascular physiology has been extensively studied, both experimentally and theoretically, over the years since the initial discovery 13,28,45,47,48. However, the extent to which the Fåhræus effect may occur in complex networks of microvessels and its dependence on systemic parameters (such as feeding Hct and network perfusion pressure) is still poorly understood.
The classical Fåhræus effect is caused by the tendency of RBCs to move towards regions of low shear in the center of vessels, which results in phase separation into a slow flowing, cell-poor plasma layer along the vessel wall and a fast flowing, RBC-rich layer in the vessel center 13. When extending the classical Fåhræus effect to microcirculatory beds comprising complex networks of branching capillary vessels, the skimming of plasma at network bifurcations comes into play 13. Since plasma is creeping along vessel walls, capillary vessel branching leads to plasma skimming and alters the ratio of plasma to RBCs in the daughter vessels (phase separation effect), thus changing local Hct, which is sometimes called network Fåhræus effect.33 The degree of plasma skimming and subsequent Hct alteration depends on the angle of the bifurcation and the difference between the diameters of the daughter vessels 21.
The role of the network Fåhræus effect in vivo has been studied in various animal models including the hamster cremaster muscle and cheek pouch 19,20,43, rat cremaster muscle and mesentery 15,17,32, and cat mesentery 25,26. All of these studies confirmed that the network Fåhræus effect occurs in the microvasculature in vivo. Local Hct in the capillary beds was found to be two- to five-fold lower than systemic Hct 15,19. Large variations of instantaneous capillary Hct have been documented photographically in vivo 17. The in vivo capillary Hct depends on various parameters such as tissue ischemia induced by arteriolar occlusion, muscle contraction and vasodilation 15,19. Additionally, irregularities in microvessel walls, asymmetrical positioning of RBCs in capillaries, passage of leukocytes through narrow vessels, and retardation of plasma flow by macromolecular structures adhering to the vessel wall may contribute to variation in in vivo capillary Hct 35,46,47.
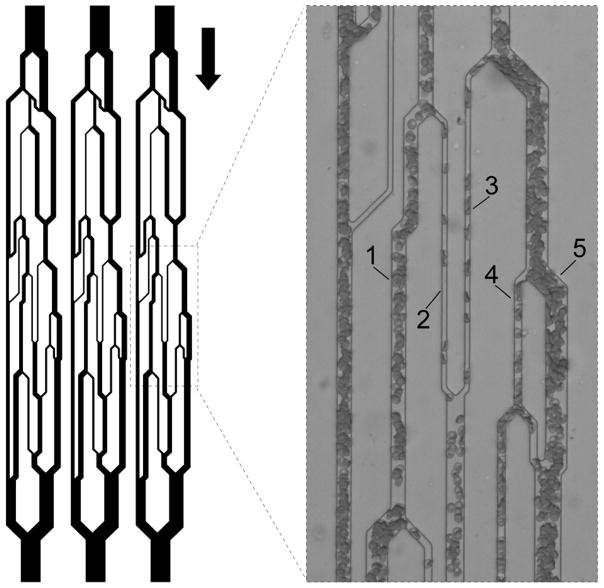
With the development of an artificial microvascular network (AMVN) it has become possible to study the dynamics of blood flow in microvascular networks in vitro under stable, controlled and reproducible conditions 3,11,50,51. The AMVN consists of a complex network of interconnected microchannels (with the layout inspired by the microvasculature of rat mesentery)50,51 of uniform height (5 μm) and widths ranging from 70 μm (‘arteriole’ and ‘venule’) down to 5 μm (‘capillaries’) 3. We have previously used the AMVN microfluidic device to study the effect of RBC shape 29,39, aggregation 40, and deformability 3,4,38,51,52 on the overall perfusion of the microvascular network. Additionally, we have used the AMVN to prove that the dynamic interplay between plasma skimming and the dependence of blood viscosity on vessel Hct (known as the Fåhræus-Lindqvist effect 10) could produce spontaneous, self-sustaining oscillations of capillary blood flow and Hct in microvascular networks 11,18,34. In the present study, we measured the effect of feeding Hct (ranging from 10 to 80%) and perfusion pressure applied to the AMVN (ranging from 5 to 60 cmH2O) on RBC velocity and local Hct in selected capillaries of the network.
Materials and Methods
2.1 AMVN device fabrication
The design and fabrication of the AMVN device have been described previously in detail 3,4,11,29,38–40,51,52. In brief, each AMVN device contained three identical, parallel networks of ‘capillary’ microchannels (widths 5–51 μm) with architecture inspired by rat mesentery microvasculature (Fig. 1). Each network had an independent inlet port (4 mm diameter) connected to the ‘capillary’ network via a 70 μm wide ‘arteriole’ microchannel and all networks converged to a common outlet port (1.5 mm diameter) via a 70 μm wide ‘venule’ microchannel. All microchannels comprising the AMVN had depths of 5 μm. AMVN devices were made from polydimethylsiloxane (PDMS; Sylgard 184, Dow Corning Corp., Midland, MI) casts of a silicon wafer patterned using conventional soft lithography. AMVN casts were then bonded to PDMS coated glass slides via exposure to air plasma. The bonded AMVN devices were treated with a 1% solution of mPEG-silane (Laysan Bio, Inc., Arab, AL) in GASP buffer (1.3 mM NaH2PO4, 9 mM Na2HPO4, 140 mM NaCl, 5.5 mM glucose, 1% bovine serum albumin; osmolality 290 mmol/kg; pH 7.4) for 30 minutes then flushed with GASP buffer prior to use.
Fig. 1.
Schematic illustration of the design of the artificial microvascular network (AMVN). Each AMVN microfluidic device contains three identical network units with independent inlets and a common outlet, allowing simultaneous investigation of three separate samples. The channels have a uniform height of 5 μm and widths ranging from 70 μm (‘arteriolar’ inlet and ‘venular’ outlet) down to 5 μm (‘capillaries’). The arrow indicates the overall direction of flow through the device. Inset shows the five capillary microchannels of interest, in which RBC velocity and hematocrit were measured. The capillaries’ widths are (1) 13 μm, (2) 5 μm, (3) 5 μm, (4) 7 μm, and (5) 19 μm.
2.2 Blood sample preparation
Blood was drawn from consenting healthy volunteers into Vacutainer tubes containing K2EDTA as an anticoagulant (BD, Franklin Lakes, NJ). Blood was centrifuged at 3000 × g for 5 minutes to separate RBCs from plasma (Allegra X-15R, Beckman Coulter, Irwing, TX). The supernatant plasma was aspirated and centrifuged again for 10 minutes at 3000 × g to remove residual leukocytes and platelets. Packed RBCs were diluted with GASP buffer and run through a high-efficiency leukocyte reduction filter (Purecell NEO, Haemonetics Corp., Braintree, MA). The leukocyte-depleted filtrate was centrifuged at 3000 × g for 5 minutes, and the supernatant GASP buffer and the uppermost layer of RBCs were removed by aspiration. Packed RBCs were then suspended in autologous plasma (1:1 by volume), centrifuged again at 3000 × g for 5 minutes and the supernatant was discarded to wash off any residual GASP buffer. Packed RBCs were then suspended in autologous plasma with a target Hct of 80%. Hct of this stock solution was measured in triplicate by microcentrifugation (PowerSpin BX Centrifuge, Unico, Dayton, NJ) and adjusted to exactly 80%, via addition of plasma or RBCs, if needed. Aliquots with Hcts of 20, 30, 40, 50, 60 and 70% were prepared by mixing a calculated volume of autologous plasma with the 80% Hct stock solution. The samples were kept on a tube rotator (Labquake, Barnstead Thermolyne, Dubuque, IA) throughout the experiments, which were completed within 4 hours of blood collection.
2.3 Measurement of RBC velocity in AMVN microchannels
Measurement of RBC velocity in the AMVN microchannels was performed as described previously in detail 3,4,11,29,38–40,51,52. In brief, to perform the RBC velocity measurement, an AMVN device was secured to the stage of an inverted bright-field microscope (IX73, Olympus, Center Valley, PA), connected to a water column (used to modulate the perfusion pressure difference; Series A40 UniSlides, Velmex, Bloomfield, NY) via flexible tubing, and flushed with GASP buffer. A 25 μL RBC sample was then pipetted into each AMVN inlet port, and a 2 mm stir bar (Spinbar, Bel-Art, Wayne, NJ) used to counteract RBC sedimentation within the inlet was placed into each inlet. A magnetic stirrer (Model 1060, Instech Laboratories, Plymouth Meeting, PA) was used to rotate the stir bars continuously throughout the measurement (data from experiments where the stir bars stopped rotating partway through the measurement were discarded). The RBC samples were allowed to perfuse the AMVN until they reached the outlet port (confirmed visually), then the perfusion pressure (ΔP) was set to 0 cmH2O, and imaging of the region of the AMVN containing the five ‘capillary’ microchannels of interest was initiated (Figure 1).
Images of the AMVN were acquired with a high-speed CMOS camera (Flea3, Point Grey Research, Richmond, Canada). A band-pass blue filter (B-390, Hoya, Fremont, CA) was used to improve image contrast, and to enable estimation of local Hct within the microchannels (see below). Image sequences were acquired at 10 × magnification in bursts of 10 frames (at 150 fps) every 10 seconds for the duration of each measurement. For each measurement, three bursts of images were collected at a perfusion pressure of 0 cmH2O, then 18 bursts were collected at perfusion pressures of 60, 40, 20, 10, and 5 cmH2O, respectively. Image sequences were analyzed offline with a custom algorithm implemented in MATLAB (MathWorks, Natick, MA). The algorithm isolated the microchannels of interest within each image and compared subsequent images of each microchannel sub-image to track the average change in position of the RBCs over time, thus enabling the calculation of RBC velocity (VRBC).
Note that all image sequences were scrutinized by eye prior to offline analysis. Only those image sets which had all microchannels perfused throughout the duration of each experiment were included in the final analysis. Cessation of flow in a microchannel occurred mostly by transient plugging of the channel entrance and was seen primarily in the microchannels with the slowest average flow rates and at the lowest driving pressures.
2.4 Measurement of hematocrit in AMVN microchannels
Measurement of Hct in the AMVN microchannels was performed as described previously in detail 40. In brief, the use of the band-pass blue filter for imaging the flow of blood in the AMVN enabled us to apply the basic principles of densitometric spectrophotometry to estimate the Hct in each capillary microchannel. Because molecules of hemoglobin contained within RBCs adsorb blue light, the overall intensity of light transmitted through the channel into the camera is proportional to the concertation of hemoglobin, and therefore Hct, in the channel. The average grayscale color intensities (0 to 255 au) of the five capillary microchannels of interest, the ‘arteriole’ microchannels, and the device backgrounds (i.e. areas outside the microchannels) were measured using a custom image analysis algorithm implemented in MATLAB (The Math Works Inc). The average grayscale color intensity of each device’s background was subtracted from the average grayscale color intensity of each microchannel in order to correct for any minor lighting variations resulting from microscope settings and/or irregularities in the thickness of the PDMS. The corrected average grayscale color intensities for individual microchannels of interest were then compared to the corrected average grayscale color intensity of the ‘arteriole’ microchannel, with known feeding Hct, to determine the ratio of capillary Hct (Hctcapillary) to feeding Hct (Hctfeeding). The Fåhræus effect (i.e. the reduction of capillary Hct relative to feeding Hct) was then calculated as (Hctfeeding − Hctcapillary)/Hctfeeding.
2.5 Statistical analysis
Statistical analysis was performed using built-in functions of MATLAB 2014b statistics toolbox. Paired Student’s t-tests were used for comparisons of datasets. The results are given as mean values ± standard deviations. A p-value of < 0.05 was considered significant.
Results
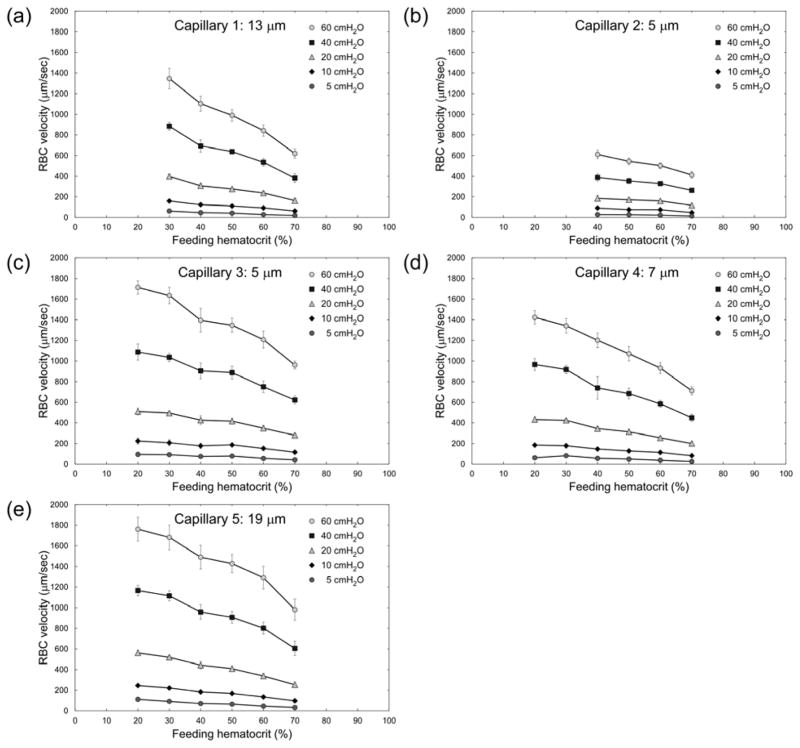
Figure 2 shows RBC velocities in the five 5–19 μm ‘capillary’ microchannels of the AMVN (indicated in Fig. 1) for feeding Hcts ranging from 20 to 70% and perfusion pressures of 5–60 cmH2O. Note that the number of evaluable data sets was insufficient (n < 4) for feeding Hcts <40% in ‘Capillary 2’ and for Hcts <30 in ‘Capillary 1’. Overall, RBC velocity decreased with increasing feeding Hct and with decreasing perfusion pressure for all capillaries. The relationship between RBC velocity and perfusion pressure is approximately linear. Interestingly, RBC velocity in the two 5 μm-wide capillaries (Capillary 2 and 3) differed greatly; it was 2–3 times slower in Capillary 2 than in Capillary 3. The RBC velocity in 5 μm-wide Capillary 3 was in a similar range as RBC velocity in the capillaries with 7–19 μm widths. The differences in RBC velocity between equal-feeding Hct samples at different perfusion pressures were statistically significant (p < 0.0017) across all capillaries and all Hcts evaluated.
Fig. 2.
Dependence of RBC velocity (VRBC) on feeding hematocrit (Hctfeeding) for ‘capillaries’ of the artificial microvascular network, at different perfusion pressures (ΔP). Values shown are mean ± standard deviation, n = 0, 4, 6, 4, 8 and 8; 0, 0, 4, 5, 5 and 6; 5, 4, 7, 7, 4 and 7; 6, 5, 5, 7, 7 and 7; and 4, 5, 6, 7, 8 and 8 for Hctfeeding = 20, 30, 40, 50, 60 and 70% respectively in Capillaries 1, 2, 3, 4 and 5 respectively.
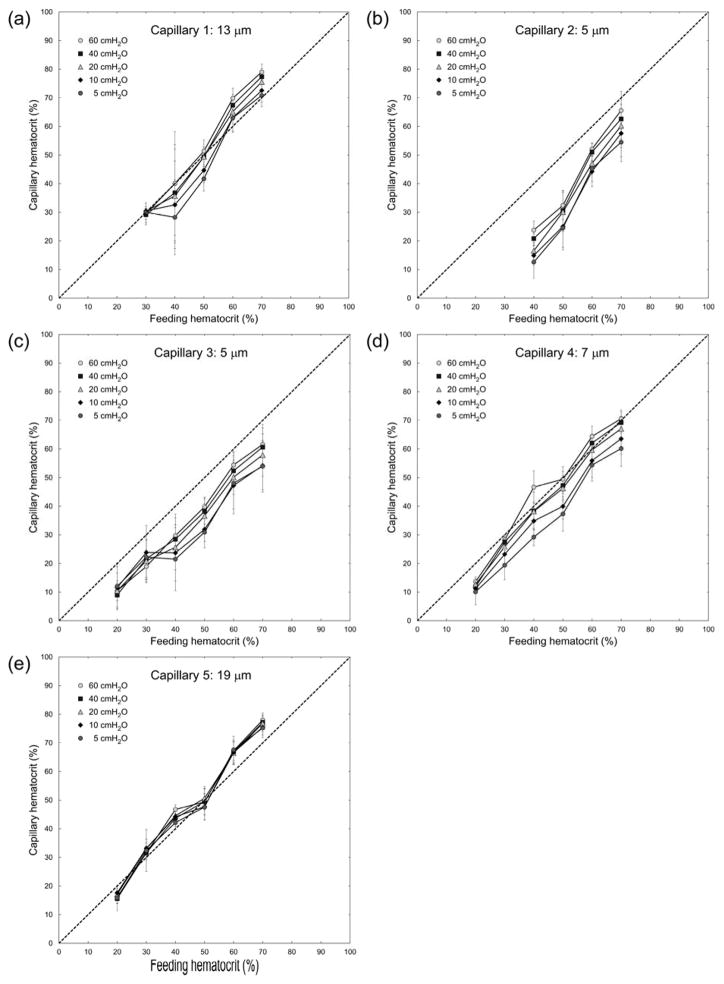
Figure 3 demonstrates the magnitude of the Fåhræus effect (the reduction of vessel Hct in capillary microchannels relative to feeding Hct in the larger ‘arteriole’ microchannels). The Hct in capillary microchannels (estimated densitometrically, see Materials and Methods) was lower than the feeding Hct in the two 5 μm capillaries (Capillary 2 and 3) for all perfusion pressures. The differences between feeding and capillary Hct for the 5 μm capillaries were statistically significant (p < 0.027) across all Hcts and all perfusion pressures evaluated, besides 70% Hct at 60 cmH2O in Capillary 2 (p > 0.106) and 30% Hct at 10 cmH2O in Capillary 3 (p > 0.123). In the 7 μm capillary microchannel (Capillary 4) these values were shifted closer towards the line of identity, i.e. a Fåhræus effect was hardly discernible, except for low perfusion pressures. In capillary microchannels with widths of 13 and 19 μm (Capillary 1 and 5, respectively), vessel Hct values fell mainly on the line of identity, indicating that a Fåhræus effect was not discernible for those larger capillaries. For Capillaries 4 and 5, statistically significant differences (p < 0.0398) between feeding and capillary Hcts existed for feeding Hcts of 20 – 40% across all perfusion pressures evaluated, besides 30% Hct at the lowest and highest pressures evaluated in capillary 5 and 40% Hct at perfusion pressures of 20 – 40 cmH2O in capillary 4. For Capillary 1 the majority of capillary Hcts were not significantly different (p > 0.05) than feeding Hcts. Note that in these larger microchannels, at the lowest feeding Hct evaluated (20%), vessel Hct tended to be lower than the feeding Hct, whereas at high feeding Hcts the vessel Hct tended to be closer to or even above the line of identity (Figs. 3a and 3e).
Fig. 3.
Relationship between feeding hematocrit (Hctfeeding) and capillary hematocrit (Hctcapillary) for ‘capillaries’ of the artificial microvascular network, at different perfusion pressures (ΔP). The dotted line indicates the line of identity. Values shown are mean ± standard deviation, n = 0, 4, 6, 4, 8 and 8; 0, 0, 4, 5, 5 and 6; 5, 4, 7, 7, 4 and 7; 6, 5, 5, 7, 7 and 7; and 4, 5, 6, 7, 8 and 8 for Hctfeeding = 20, 30, 40, 50, 60 and 70% respectively in Capillaries 1, 2, 3, 4 and 5 respectively.
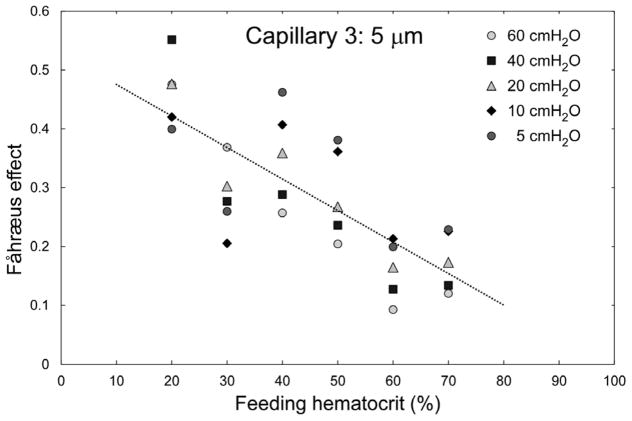
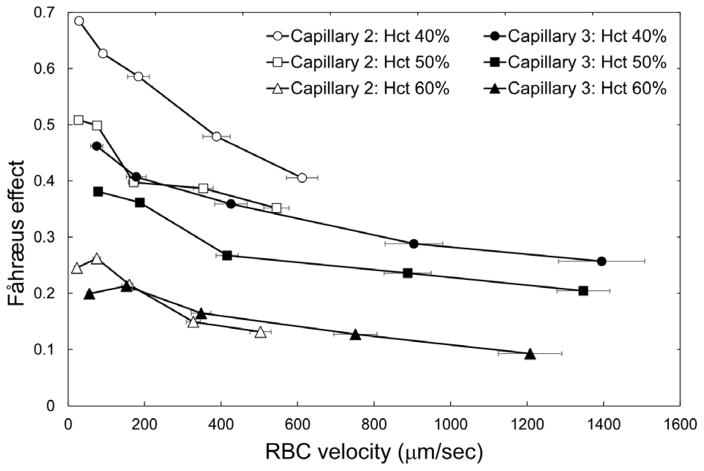
Figure 4 highlights the inverse relationship between the feeding Hct and the magnitude of the Fåhræus effect in Capillary 3 (cross-sectional dimensions 5 × 5 μm). An increase of the feeding Hct by 10% (e.g. from 40 to 50%) resulted in an approximately 5% reduction of the magnitude of the Fåhræus effect. In Figure 5 the magnitude of the Fåhræus effect is plotted against RBC velocity for feeding Hcts of 40, 50, and 60% in Capillary 2 (slow flow) and in Capillary 3 (fast flow). The magnitude of the Fåhræus effect increased with decreasing feeding Hct and with decreasing RBC velocity for both capillaries. An approximately 7-fold higher Fåhræus effect was seen for a feeding Hct of 40% at a low RBC velocity (perfusion pressure = 5 cmH2O) than for a feeding Hct of 60% at a fast RBC velocity (perfusion pressure = 60 cmH2O). There was a statistically significant difference (p < 0.0198) between Capillary 2 and Capillary 3 for 50% hct samples at the highest driving pressure evaluated (60 cmH2O), but otherwise there were no statistically significant differences (p > 0.05) between the two capillaries for all other perfusion pressures and Hcts evaluated.
Fig. 4.
Dependence of the magnitude of the Fåhræus effect, calculated as (Hctfeeding − Hctcapillary)/Hctfeeding, on feeding hematocrit for capillary 3 (5 μm). The regression analysis yielded a relationship of: Fåhræus effect = −0.0054×Hctfeeding + 0.5291; R2 = 0.59; p < 0.01. n = 5, 4, 7, 7, 4 and 7 for Hctfeeding = 20, 30, 40, 50, 60 and 70% respectively.
Fig. 5.
Dependence of the magnitude of the Fåhræus effect, calculated as (Hctfeeding − Hctcapillary)/Hctfeeding, on RBC flow velocity (VRBC) for two 5 μm capillaries (capillary 2 – open symbols; and capillary 3 – filled symbols) and three values of feeding hematocrit (circles: 40%, squares: 50%, triangles: 60%). Values shown are mean ± standard deviation, n = 4, 5 and 5; and 7, 7 and 4 for Hctfeeding = 40, 50 and 60% respectively in Capillaries 2 and 3 respectively.
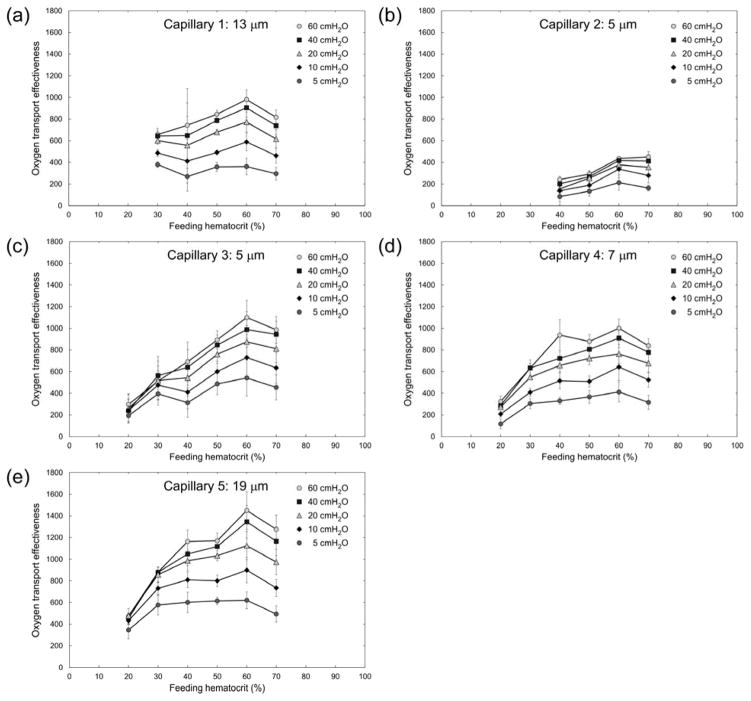
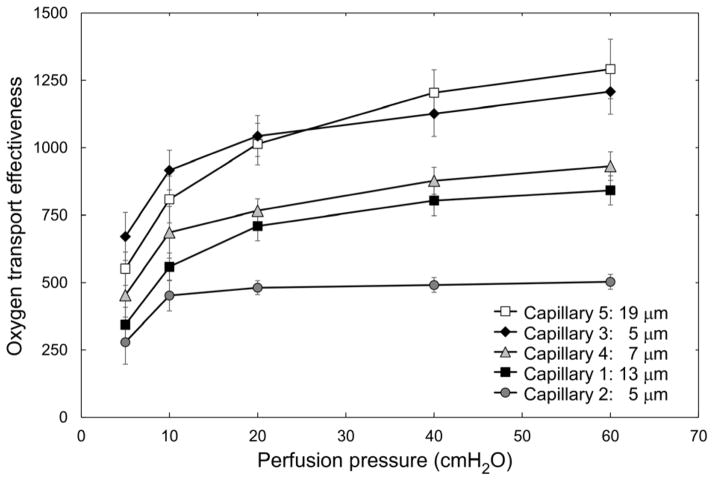
We used the measurements of RBC velocity and vessel Hct (estimated densitometrically) for each of the five capillary microchannels to calculate the theoretical oxygen transport effectiveness within the AMVN. Oxygen transport effectiveness was calculated as VRBC × Hctcapillary/ΔP, where VRBC is the RBC flow velocity, Hctcapillary is the densitometrically measured vessel Hct and ΔP is the perfusion pressure applied to the AMVN 6. Figure 6 shows the calculated oxygen transport effectiveness for each of the capillary microchannels at perfusion pressures ranging 5–60 cmH2O. A feeding Hct of approximately 60% maximized the oxygen transport effectiveness for all capillary microchannels studied. The differences in oxygen transport effectiveness between equal feeding Hct samples at different perfusion pressures were most pronounced at low perfusion pressures and high feeding Hcts. Differences between the two highest perfusion pressures evaluated (40 and 60 cmH2O) were not statistically significant (p > 0.05) across all capillaries and all Hcts evaluated. Figure 7 shows a non-linear dependence of oxygen transport effectiveness on applied perfusion pressure for a feeding Hct of 60% in the five capillary microchannels. Oxygen transport effectiveness decreased by approximately 50% when the perfusion pressure was reduced from 60 to 5 cmH2O for all capillary microchannels. The difference in oxygen transport effectiveness between the lowest (5 cmH2O) and highest (60 cmH2O) perfusion pressures evaluated was statistically significant (p < 0.0242) for Capillaries 1, 2 and 4, but was not statistically significant (p > 0.05) for Capillaries 3 and 5.
Fig. 6.
Dependence of estimated oxygen transport effectiveness, calculated as VRBC × Hctcapillary/ΔP, on feeding hematocrit (Hctfeeding) for ‘capillaries’ of the artificial microvascular network, at different perfusion pressures (ΔP). Values shown are mean ± standard deviation, n = 0, 4, 6, 4, 8 and 8; 0, 0, 4, 5, 5 and 6; 5, 4, 7, 7, 4 and 7; 6, 5, 5, 7, 7 and 7; and 4, 5, 6, 7, 8 and 8 for Hctfeeding = 20, 30, 40, 50, 60 and 70% respectively in Capillaries 1, 2, 3, 4 and 5 respectively.
Fig. 7.
Dependence of estimated oxygen transport effectiveness, calculated as VRBC × Hctcapillary/ΔP, on perfusion pressure (ΔP) for the five ‘capillaries’ of the artificial microvascular network, at a feeding hematocrit of 60%. Values shown are mean ± standard deviation, n = 8; 5; 4; 7; and 8 for every perfusion pressure in Capillaries 1, 2, 3, 4 and 5 respectively.
Discussion
The Fåhræus effect (that is, the degree of Hct reduction) in the 5 μm-wide microchannels of the network (Capillary 2 and 3) was inversely related to the feeding Hct (Fig. 4). In the 7 μm-wide microchannel (Capillary 4), the Fåhræus effect was significantly less pronounced. In the larger microchannels (13 μm-wide Capillary 1 and 19 μm-wide Capillary 5, which likely represented arteriole-venule shunts rather than true capillaries), no reduction of the vessel Hct was observed – on the contrary, the vessel Hct was even higher than the feeding Hct (for 60% and 70%). The differences in vessel Hct between different capillary microchannels comprising the AMVN appear to compensate each other in order to satisfy the overall mass balance 12.
The fact that pronounced Hct reduction was not observed in microchannels with widths greater than 10 μm is intriguing, since it is in contrast to earlier observations.9,13,28,48 Hct reduction (i.e. the Fåhræus effect) has previously been studied in cylindrical tubes with uniform diameters. It is caused by a tendency of RBCs to move towards regions of low shear forces in the center of a vessel. The rectangular, flat geometries of the AMVN microchannels do not allow such a flow profile, which may explain why we did not observe Hct reduction in the larger (>10 μm-wide) microchannels of the AMVN devices.
The magnitude of the Fåhræus effect also increased with decreasing RBC flow velocity, which was induced by lowering the perfusion pressure applied to the AMVN (Fig. 5). Low perfusion pressures are the hallmark of circulatory shock of any origin, including hemorrhagic, hypovolemic, septic, cardiogenic or anaphylactic shock 54. Our data suggest that the Fåhræus effect may increase in shock and thus could contribute to insufficient tissue oxygenation in certain low flow areas.
Another striking observation was the almost two-fold difference in RBC velocity (Fig. 2) and in the magnitude of the Fåhræus effect (Fig. 5) between the two adjacent 5 × 5 μm capillary microchannels (Capillary 2 and 3). The difference in RBC velocity between the two capillary microchannels of equivalent dimensions may be explained, in part, by the difference in branching order (see Fig. 1): Capillary 2 is a 7th order branch after the ‘arteriolar’ inlet (7 divisions), and Capillary 3 is a 4th order branch (2 divisions and 2 confluences). Because of plasma skimming, the branch with the higher flow rate receives a disproportionately larger number of RBCs at every bifurcation in a capillary network 20,21,23,49. The effect of plasma skimming on vessel Hct accumulate with branching order, producing the network Fåhræus effect 13. Our data indicate that plasma skimming in the capillary network may be inversely related to RBC velocity (Fig. 5) and to feeding Hct (Fig. 4), which corroborates a recent study by another group 23.
Oxygen transport effectiveness has been analyzed in recent years theoretically,41 experimentally ex vivo7,8,22 and in vivo.55 We have previously calculated theoretical oxygen transport effectiveness to assess optimal Hct values viscometrically and with the AMVN device.30 In the present study, estimated oxygen transport effectiveness was highest at a feeding Hct of approximately 60% in all capillary microchannels studied (Fig. 6). The oxygen transport effectiveness decreased by approximately 50% in all microchannels when the differential perfusion pressure was reduced from 60 to 5 cmH2O (Fig. 7). These results are in agreement with optimal Hct values for the entire network (for measurements made in the ‘venular’ microchannel of the AMVN), which we had previously found to be higher than the normal physiological range and to be depend on the perfusion pressure applied to the network 36.
The values of RBC flow velocity in our experiments (Fig. 2) covered the general range of velocities observed in vivo, which are characterized by a large heterogeneity and are known to depend on the species and the type of vascular bed. RBC velocity in vivo ranges from 0 to 3.5 mm/s (with a mean of 0.8 ± 0.5 mm/s) in nailfold capillaries of healthy humans 2, and has a similar range during pregnancy and in patients with increased plasma viscosity 24,37. The RBC velocity in capillaries of rat mesentery can be as high as 1.85 mm/s on average 16, but is much lower in the cochlea of a guinea pig, ranging only 0.03–0.18 mm/s 27. The velocity of RBC flow in brain capillaries of rats and mice ranges 0.15–8.6 mm/s (with a mean of 2.0 ±1.4 mm/sec) 53. However, such a dramatic heterogeneity of capillary blood flow has only a minor influence on brain oxygenation 1,14, likely because oxygen offloading from hemoglobin can still occur at RBC velocities up to 5 mm/s 31, and thus cerebral tissue oxygenation in mice may take place in arterioles and first order capillary branches, where RBC velocity can be that high 42.
These specific numeric results obtained in this study (such as the values of optimal Hct) should not be over-interpreted and directly applied to in vivo microvascular networks, as there are several inherent limitations of the AMVN system. The layout of the AMVN (Fig. 1), inspired by observations of rat mesentery microvasculature, approximates the overall layout of in vivo microvasculature well. However, the dimensions and cross-sections of AMVN microchannels and in vivo capillaries are rather dissimilar, which results in several known artefacts 56. The uniform AMVN channel height of 5 μm is not realistic and does not reflect the in vivo situation (e.g. of an arteriole with a circular diameter of 70 μm). The microchannels comprising the AMVN also have rectangular cross-sections, which allow more space for plasma in the corners compared with in vivo capillaries, which have circular cross-sections. Furthermore, AMVN microfluidic devices are fabricated from PDMS, which is rigid and chemically inert, and therefore lacks many relevant features of the microcirculation, such as endothelial cell lining, endothelial glycocalyx with attached plasmatic surface layer, vessel irregularities, arteriolar and capillary vasoconstriction and vasodilatation, and flow pulsatility 33,44. A microfluidic device with a contiguous endothelial monolayer has been previously developed by others – the cross-sectional dimensions of the smallest microchanels in that device (100 × 200 μm), however, are still too large to approximate the capillaries necessary for the current study 5.
The Fåhræus effect (that is, the reduction of Hct in narrow vessels) was first observed in glass tubes with decreasing diameters, and has subsequently been investigated in individual microchannels of various sizes in vitro 10,13,28,47,48. In this present study, the artificial microvascular network (AMVN) microfluidic device enabled us to perform the first in vitro investigation of the Fåhræus effect in a network of capillary microchannels, under precisely controlled and systematically varied conditions encompassing a wide range of feeding Hct and perfusion pressures. Our results confirmed the presence of the Fåhræus effect in the AMVN, a network of artificial capillary-size microchannels with complex architecture. Additionally, we found an inverse relationship between the magnitude of the Fåhræus effect and feeding Hct as well as RBC flow velocity in capillary microchannels of the network (modulated by the overall perfusion pressure). These findings may contribute to a more comprehensive understanding of the Fåhræus effect in capillary networks.
Perspectives
Hematocrit reduction in narrow blood vessels (known as the Fåhræus effect) has been studied for many years in vivo, in vitro and in silico; however, the extent to which the Fåhræus effect may occur in networks with complex geometry and the dependence of the effect on systemic parameters, such as feeding hematocrit and network perfusion pressure, are still poorly understood.
Here we used an artificial microvascular network to experimentally establish that the Fåhræus effect does occur in a microvessel network with complex geometry and that the magnitude of the Fåhræus effect in such a network is inversely related to feeding hematocrit and perfusion pressure. The results of this study provide a valuable bridge between previous models and experiments in vivo, in vitro and in silico, and could have an impact on future studies of the microcirculation in health and disease.
Acknowledgments
Funding information: This work was supported in part by a 2012 NIH Director’s Transformative Research Award (NHLBI R01HL117329, PI: SSS).
References
- 1.Angleys H, Ostergaard L, Jespersen SN. The effects of capillary transit time heterogeneity (CTH) on brain oxygenation. Journal of cerebral blood flow and metabolism : official journal of the International Society of Cerebral Blood Flow and Metabolism. 2015;35:806–817. doi: 10.1038/jcbfm.2014.254. [DOI] [PMC free article] [PubMed] [Google Scholar]
- 2.Bollinger A, Butti P, Barras JP, Trachsler H, Siegenthaler W. Red blood cell velocity in nailfold capillaries of man measured by a television microscopy technique. Microvascular research. 1974;7:61–72. doi: 10.1016/0026-2862(74)90037-5. [DOI] [PubMed] [Google Scholar]
- 3.Burns JM, Yang X, Forouzan O, Sosa JM, Shevkoplyas SS. Artificial microvascular network: a new tool for measuring rheologic properties of stored red blood cells. Transfusion. 2012;52:1010–1023. doi: 10.1111/j.1537-2995.2011.03418.x. [DOI] [PubMed] [Google Scholar]
- 4.Burns JM, Yoshida T, Dumont LJ, Yang X, Piety NZ, Shevkoplyas SS. Deterioration of red blood cell mechanical properties is reduced in anaerobic storage. Blood transfusion = Trasfusione del sangue. 2016;14:80–88. doi: 10.2450/2015.0241-15. [DOI] [PMC free article] [PubMed] [Google Scholar]
- 5.Chau LT, Rolfe BE, Cooper-White JJ. A microdevice for the creation of patent, three-dimensional endothelial cell-based microcirculatory networks. Biomicrofluidics. 2011;5:34115–3411514. doi: 10.1063/1.3609264. [DOI] [PMC free article] [PubMed] [Google Scholar]
- 6.Crowell JW, Smith EE. Determinant of the optimal hematocrit. J Appl Physiol. 1967;22:501–504. doi: 10.1152/jappl.1967.22.3.501. [DOI] [PubMed] [Google Scholar]
- 7.Detterich J, Alexy T, Rabai M, Wenby R, Dongelyan A, Coates T, Wood J, Meiselman H. Low-shear red blood cell oxygen transport effectiveness is adversely affected by transfusion and further worsened by deoxygenation in sickle cell disease patients on chronic transfusion therapy. Transfusion. 2013;53:297–305. doi: 10.1111/j.1537-2995.2012.03822.x. [DOI] [PMC free article] [PubMed] [Google Scholar]
- 8.Diaw M, samb A, Diop S, Sall ND, Ba A, Cisse F, Connes P. Effects of hydration and water deprivation on blood viscosity during a soccer game in sickle cell trait carriers. British journal of sports medicine. 2014;48:326–331. doi: 10.1136/bjsports-2012-091038. [DOI] [PubMed] [Google Scholar]
- 9.Fåhræus R. The Suspension Stability of Blood. Physiological Reviews. 1929;9:241–274. [Google Scholar]
- 10.Fåhræus R, Lindqvist T. The viscosity of blood in narrow capillary tubes. The American journal of physiology. 1931;96:562–568. [Google Scholar]
- 11.Forouzan O, Yang X, Sosa JM, Burns JM, Shevkoplyas SS. Spontaneous oscillations of capillary blood flow in artificial microvascular networks. Microvascular research. 2012;84:123–132. doi: 10.1016/j.mvr.2012.06.006. [DOI] [PubMed] [Google Scholar]
- 12.Gaehtgens P. Distribution of flow and red cell flux in the microcirculation. Scandinavian journal of clinical and laboratory investigation Supplementum. 1981;156:83–87. doi: 10.3109/00365518109097437. [DOI] [PubMed] [Google Scholar]
- 13.Goldsmith HL, Cokelet GR, Gaehtgens P. Robin Fahraeus: evolution of his concepts in cardiovascular physiology. The American journal of physiology. 1989;257:H1005–1015. doi: 10.1152/ajpheart.1989.257.3.H1005. [DOI] [PubMed] [Google Scholar]
- 14.Hall CN, Reynell C, Gesslein B, Hamilton NB, Mishra A, Sutherland BA, O’Farrell FM, Buchan AM, Lauritzen M, Attwell D. Capillary pericytes regulate cerebral blood flow in health and disease. Nature. 2014;508:55–60. doi: 10.1038/nature13165. [DOI] [PMC free article] [PubMed] [Google Scholar]
- 15.House SD, Lipowsky HH. Microvascular hematocrit and red cell flux in rat cremaster muscle. The American journal of physiology. 1987;252:H211–222. doi: 10.1152/ajpheart.1987.252.1.H211. [DOI] [PubMed] [Google Scholar]
- 16.Jeong JH, Sugii Y, Minamiyama M, Okamoto K. Measurement of RBC deformation and velocity in capillaries in vivo. Microvascular research. 2006;71:212–217. doi: 10.1016/j.mvr.2006.02.006. [DOI] [PubMed] [Google Scholar]
- 17.Kanzow G, Pries AR, Gaehtgens P. Analysis of the hematocrit distribution in the mesenteric microcirculation. International journal of microcirculation, clinical and experimental. 1982;1:67–79. [PubMed] [Google Scholar]
- 18.Kiani MF, Pries AR, Hsu LL, Sarelius IH, Cokelet GR. Fluctuations in microvascular blood flow parameters caused by hemodynamic mechanisms. The American journal of physiology. 1994;266:H1822–1828. doi: 10.1152/ajpheart.1994.266.5.H1822. [DOI] [PubMed] [Google Scholar]
- 19.Klitzman B, Duling BR. Microvascular hematocrit and red cell flow in resting and contracting striated muscle. The American journal of physiology. 1979;237:H481–490. doi: 10.1152/ajpheart.1979.237.4.H481. [DOI] [PubMed] [Google Scholar]
- 20.Klitzman B, Johnson PC. Capillary network geometry and red cell distribution in hamster cremaster muscle. The American journal of physiology. 1982;242:H211–219. doi: 10.1152/ajpheart.1982.242.2.H211. [DOI] [PubMed] [Google Scholar]
- 21.Lee TR, Yoo SS, Yang J. Generalized plasma skimming model for cells and drug carriers in the microvasculature. Biomechanics and modeling in mechanobiology. 2016 doi: 10.1007/s10237-016-0832-z. [DOI] [PubMed] [Google Scholar]
- 22.Lemonne N, Billaud M, Waltz X, Romana M, Hierso R, Etienne-Julan M, Connes P. Rheology of red blood cells in patients with HbC disease. Clinical hemorheology and microcirculation. 2016;61:571–577. doi: 10.3233/CH-141906. [DOI] [PubMed] [Google Scholar]
- 23.Li X, Popel AS, Karniadakis GE. Blood-plasma separation in Y-shaped bifurcating microfluidic channels: a dissipative particle dynamics simulation study. Physical biology. 2012;9:026010. doi: 10.1088/1478-3975/9/2/026010. [DOI] [PMC free article] [PubMed] [Google Scholar]
- 24.Linder HR, Reinhart WH, Hanggi W, Katz M, Schneider H. Peripheral capillaroscopic findings and blood rheology during normal pregnancy. European journal of obstetrics, gynecology, and reproductive biology. 1995;58:141–145. doi: 10.1016/0028-2243(94)01993-2. [DOI] [PubMed] [Google Scholar]
- 25.Lipowsky HH, Firrell JC. Microvascular hemodynamics during systemic hemodilution and hemoconcentration. The American journal of physiology. 1986;250:H908–922. doi: 10.1152/ajpheart.1986.250.6.H908. [DOI] [PubMed] [Google Scholar]
- 26.Lipowsky HH, Kovalcheck S, Zweifach BW. The distribution of blood rheological parameters in the microvasculature of cat mesentery. Circulation research. 1978;43:738–749. doi: 10.1161/01.res.43.5.738. [DOI] [PubMed] [Google Scholar]
- 27.Nuttall AL. Velocity of red blood cell flow in capillaries of the guinea pig cochlea. Hearing research. 1987;27:121–128. doi: 10.1016/0378-5955(87)90013-x. [DOI] [PubMed] [Google Scholar]
- 28.Ohshima N, Sato M, Oda N. Microhemodynamics of blood flow in narrow glass capillaries of 9 to 20 micrometers; the Fahraeus effect. Biorheology. 1988;25:339–348. doi: 10.3233/bir-1988-251-243. [DOI] [PubMed] [Google Scholar]
- 29.Piety NZ, Reinhart WH, Pourreau PH, Abidi R, Shevkoplyas SS. Shape matters: the effect of red blood cell shape on perfusion of an artificial microvascular network. Transfusion. 2016;56:844–851. doi: 10.1111/trf.13449. [DOI] [PMC free article] [PubMed] [Google Scholar]
- 30.Piety NZ, Reinhart WH, Stutz J, Shevkoplyas SS. Optimal Hematocrit in an Artificial Microvascular Network. Transfusion. 2017 doi: 10.1111/trf.14213. (in press) [DOI] [PMC free article] [PubMed] [Google Scholar]
- 31.Pittman RN. Regulation of Tissue Oxygenation. San Rafael (CA): 2011. [PubMed] [Google Scholar]
- 32.Pries AR, Ley K, Gaehtgens P. Generalization of the Fahraeus principle for microvessel networks. The American journal of physiology. 1986;251:H1324–1332. doi: 10.1152/ajpheart.1986.251.6.H1324. [DOI] [PubMed] [Google Scholar]
- 33.Pries AR, Secomb TW. Rheology of the microcirculation. Clinical hemorheology and microcirculation. 2003;29:143–148. [PubMed] [Google Scholar]
- 34.Pries AR, Secomb TW, Gaehtgens P, Gross JF. Blood flow in microvascular networks. Experiments and simulation. Circulation research. 1990;67:826–834. doi: 10.1161/01.res.67.4.826. [DOI] [PubMed] [Google Scholar]
- 35.Pries AR, Secomb TW, Gessner T, Sperandio MB, Gross JF, Gaehtgens P. Resistance to blood flow in microvessels in vivo. Circulation research. 1994;75:904–915. doi: 10.1161/01.res.75.5.904. [DOI] [PubMed] [Google Scholar]
- 36.Reinhart WH. The optimum hematocrit. Clinical hemorheology and microcirculation. 2016 doi: 10.3233/CH-168032. [DOI] [PubMed] [Google Scholar]
- 37.Reinhart WH, Lutolf O, Nydegger UR, Mahler F, Straub PW. Plasmapheresis for hyperviscosity syndrome in macroglobulinemia Waldenstrom and multiple myeloma: influence on blood rheology and the microcirculation. The Journal of laboratory and clinical medicine. 1992;119:69–76. [PubMed] [Google Scholar]
- 38.Reinhart WH, Piety NZ, Deuel JW, Makhro A, Schulzki T, Bogdanov N, Goede JS, Bogdanova A, Abidi R, Shevkoplyas SS. Washing stored red blood cells in an albumin solution improves their morphologic and hemorheologic properties. Transfusion. 2015;55:1872–1881. doi: 10.1111/trf.13052. [DOI] [PMC free article] [PubMed] [Google Scholar]
- 39.Reinhart WH, Piety NZ, Goede JS, Shevkoplyas SS. Effect of osmolality on erythrocyte rheology and perfusion of an artificial microvascular network. Microvascular research. 2015;98:102–107. doi: 10.1016/j.mvr.2015.01.010. [DOI] [PMC free article] [PubMed] [Google Scholar]
- 40.Reinhart WH, Piety NZ, Shevkoplyas SS. Influence of red blood cell aggregation on perfusion of an artificial microvascular network. Microcirculation. 2016 doi: 10.1111/micc.12317. [DOI] [PMC free article] [PubMed] [Google Scholar]
- 41.Roy TK, Pries AR, Secomb TW. Theoretical comparison of wall-derived and erythrocyte-derived mechanisms for metabolic flow regulation in heterogeneous microvascular networks. American journal of physiology Heart and circulatory physiology. 2012;302:H1945–1952. doi: 10.1152/ajpheart.01176.2011. [DOI] [PMC free article] [PubMed] [Google Scholar]
- 42.Sakadzic S, Mandeville ET, Gagnon L, Musacchia JJ, Yaseen MA, Yucel MA, Lefebvre J, Lesage F, Dale AM, Eikermann-Haerter K, Ayata C, Srinivasan VJ, Lo EH, Devor A, Boas DA. Large arteriolar component of oxygen delivery implies a safe margin of oxygen supply to cerebral tissue. Nature communications. 2014;5:5734. doi: 10.1038/ncomms6734. [DOI] [PMC free article] [PubMed] [Google Scholar]
- 43.Sarelius IH, Duling BR. Direct measurement of microvessel hematocrit, red cell flux, velocity, and transit time. The American journal of physiology. 1982;243:H1018–1026. doi: 10.1152/ajpheart.1982.243.6.H1018. [DOI] [PubMed] [Google Scholar]
- 44.Schmid F, Reichold J, Weber B, Jenny P. The impact of capillary dilation on the distribution of red blood cells in artificial networks. American journal of physiology Heart and circulatory physiology. 2015;308:H733–742. doi: 10.1152/ajpheart.00335.2014. [DOI] [PubMed] [Google Scholar]
- 45.Secomb TW. Flow-dependent rheological properties of blood in capillaries. Microvascular research. 1987;34:46–58. doi: 10.1016/0026-2862(87)90078-1. [DOI] [PubMed] [Google Scholar]
- 46.Secomb TW, Hsu R. Resistance to blood flow in nonuniform capillaries. Microcirculation. 1997;4:421–427. doi: 10.3109/10739689709146806. [DOI] [PubMed] [Google Scholar]
- 47.Secomb TW, Pries AR. Blood viscosity in microvessels: experiment and theory. Comptes rendus Physique. 2013;14:470–478. doi: 10.1016/j.crhy.2013.04.002. [DOI] [PMC free article] [PubMed] [Google Scholar]
- 48.Secomb TW, Pries AR, Gaehtgens P. Hematocrit fluctuations within capillary tubes and estimation of Fahraeus effect. International journal of microcirculation, clinical and experimental. 1987;5:335–345. [PubMed] [Google Scholar]
- 49.Sherwood JM, Holmes D, Kaliviotis E, Balabani S. Spatial distributions of red blood cells significantly alter local haemodynamics. PloS one. 2014;9:e100473. doi: 10.1371/journal.pone.0100473. [DOI] [PMC free article] [PubMed] [Google Scholar]
- 50.Shevkoplyas SS, Gifford SC, Yoshida T, Bitensky MW. Prototype of an in vitro model of the microcirculation. Microvascular research. 2003;65:132–136. doi: 10.1016/s0026-2862(02)00034-1. [DOI] [PubMed] [Google Scholar]
- 51.Shevkoplyas SS, Yoshida T, Gifford SC, Bitensky MW. Direct measurement of the impact of impaired erythrocyte deformability on microvascular network perfusion in a microfluidic device. Lab on a chip. 2006;6:914–920. doi: 10.1039/b601554a. [DOI] [PubMed] [Google Scholar]
- 52.Sosa JM, Nielsen ND, Vignes SM, Chen TG, Shevkoplyas SS. The relationship between red blood cell deformability metrics and perfusion of an artificial microvascular network. Clinical hemorheology and microcirculation. 2014;57:275–289. doi: 10.3233/CH-131719. [DOI] [PMC free article] [PubMed] [Google Scholar]
- 53.Unekawa M, Tomita M, Tomita Y, Toriumi H, Miyaki K, Suzuki N. RBC velocities in single capillaries of mouse and rat brains are the same, despite 10-fold difference in body size. Brain research. 2010;1320:69–73. doi: 10.1016/j.brainres.2010.01.032. [DOI] [PubMed] [Google Scholar]
- 54.Vincent JL, De Backer D. Circulatory shock. The New England journal of medicine. 2013;369:1726–1734. doi: 10.1056/NEJMra1208943. [DOI] [PubMed] [Google Scholar]
- 55.Waltz X, Hardy-Dessources MD, Lemonne N, Mougenel D, Lalanne-Mistrih ML, Lamarre Y, Tarer V, Tressieres B, Etienne-Julan M, Hue O, Connes P. Is there a relationship between the hematocrit-to-viscosity ratio and microvascular oxygenation in brain and muscle? Clinical hemorheology and microcirculation. 2015;59:37–43. doi: 10.3233/CH-131742. [DOI] [PubMed] [Google Scholar]
- 56.Yang X, Forouzan O, Burns JM, Shevkoplyas SS. Traffic of leukocytes in microfluidic channels with rectangular and rounded cross-sections. Lab on a chip. 2011;11:3231–3240. doi: 10.1039/c1lc20293f. [DOI] [PubMed] [Google Scholar]


