

Abstract
Long non-coding RNAs are acknowledged as regulators of cancer biology and pathology. Our goal was to perform a stringent profiling of breast cancer cell lines that represent disease progression. We used the MCF-10 series, which includes the normal-like MCF-10A, HRAS-transformed MCF-10AT1 (pre-malignant), and MCF-10CA1a (malignant) cells, to perform transcriptome wide sequencing. From these data, we have identified 346 lncRNAs with dysregulated expression across the progression series. By comparing lncRNAs from these datasets to those from an additional set of cell lines that represent different disease stages and subtypes, MCF-7 (early stage, luminal), and MDA-MB-231 (late stage, basal), 61 lncRNAs that are associated with breast cancer progression were identified. Querying breast cancer patient data from The Cancer Genome Atlas, we selected a lncRNA, IGFL2-AS1, of potential clinical relevance for functional characterization. Among the 61 lncRNAs, IGFL2-AS1 was the most significantly decreased. Our results indicate that this lncRNA plays a role in downregulating its nearest neighbor, IGFL1, and affects migration of breast cancer cells. Furthermore, the lncRNAs we identified provide a valuable resource to mechanistically and clinically understand the contribution of lncRNAs in breast cancer progression.
Keywords: long non-coding RNA, breast cancer, expression profiling, IGFL2-AS1
Introduction
Non-coding RNAs have been associated with normal cellular functions and diseases including cancer development and progression for over a decade. While microRNAs are well documented to regulate protein translation, the diverse class of long non-coding RNAs (lncRNAs) are emerging with more complex regulatory roles in both normal tissues and disease states. Although several thousand lncRNAs are transcribed from the human genome (Harrow et al., 2012), relatively few have been functionally well characterized. This lack of mechanistic understanding is a result of the diverse functional activities that have been attributed to lncRNAs. These include recruitment of chromatin modifiers, interactions with transcription factors, acting as a microRNA sponge, and regulating mRNA splicing (Rinn and Chang, 2012). An increasing number of studies in a variety of cancers report dysregulated expression of lncRNAs associated with tumor initiation and progression (Huarte, 2015; Schmitt and Chang, 2016). Further, several studies have suggested that lncRNAs have potential roles as diagnostic and prognostic markers in cancer (Ding et al., 2014; Sorensen et al., 2015; Sun et al., 2015; Xu et al., 2015; Zhao et al., 2014).
Breast cancer remains a common malignancy in women and is increasing in younger women (Johnson et al., 2013). While early detection and standard of care have increased survival, the multiple disease subtypes, the heterogeneity of a single tumor, and the factors contributing to recurrence are being intensely investigated to discover better intervention strategies. lncRNAs represent a frontier for understanding regulation of the cancer genome. Several lncRNAs have established roles in breast cancer. For example, HOTAIR, which reprograms the chromatin state, is highly increased in primary and metastatic breast tumors compared to non-tumor tissue and is associated with poor survival (Gupta et al., 2010). The imprinted gene, H19 is overexpressed in tumor-associated stromal cells of breast tumors compared to normal tissue (Adriaenssens et al., 1998; Zhang et al., 2016) and promotes breast cancer proliferation (Berteaux et al., 2005).
In the present study, we sought to identify subsets of lncRNAs involved in protecting the normal mammary epithelial cell from tumor initiation, as well as those lncRNAs that increase with tumor progression. For these studies, we took advantage of the MCF-10 cell line series, consisting of MCF-10A, MCF-10AT1, and MCF-10CA1a, as a model of breast cancer progression. MCF-10A is a spontaneously immortalized, normal-like mammary epithelial cell line (Soule et al., 1990); MCF-10AT1 was derived from HRAS-transformed MCF-10A cells, and is capable of forming slow-growing tumors in mice (Dawson et al., 1996); MCF-10CA1a was derived from MCF-10AT1 by serial passaging of tumors in mice, and forms quick growing tumors with metastatic potential (Santner et al., 2001). lncRNAs were profiled in an additional set of breast cancer cells representing different disease stages; MCF-10A cells, MCF-7 cells (ER+/PR+, early stage), and MDA-MB-231 cells (ER-/PR-, late stage).
Our analyses identify clusters of lncRNAs that are commonly upregulated or downregulated between normal-like cells and breast cancer cells, as well as clusters of lncRNAs unique to each cell line. Significantly, we show that several of these lncRNAs are associated with breast cancer in patients. A novel lncRNA, IGFL2-AS1 which is expressed in the normal-like MCF-10A cells, is dramatically decreased in the MCF-10 progression series, and is absent from MCF-7 and MDA-MB-231 cells. Through knockdown experiments in MCF-10AT1 cells, we find that IGFL2-AS1 functions in cis to affect expression of several genes involved in biological processes associated with cancer. Finally, our studies show that knockdown of IGFL2-AS1 in MCF-10AT1 cells reduces cell migration.
Methods and Materials
Cell lines and cultures
MCF-10A cells were purchased from ATCC. MCF-10AT1 and MCF-10CA1a cell lines were a kind gift from Jeffery Nickerson. MCF-10A and MCF-10AT1 cells were grown in DMEM:F12 (Hyclone: SH30271, Thermo Fisher Scientific, Waltham, MA, USA) with 5% v/v horse serum (Gibco: 16050, Thermo Fisher Scientific) + 10 μg/ml human insulin (Sigma Aldrich, St. Louis, MO, USA: I-1882) + 20 ng/ml recombinant hEGF (Peprotech, Rocky Hill, NJ, USA: AF-100-15) + 100 ng/ml cholera toxin (Sigma Aldrich: C-8052) + 0.5 μg/ml hydrocortisone (Sigma Aldrich: H-0888) + 50 IU/ml penicillin/ 50 μg/ml streptomycin and 2 mM glutamine (Life Technologies, Carlsbad, CA, USA: 15140-122 and 25030-081, respectively). MCF-10CA1a cells were grown in DMEM:F12 with 5% v/v horse serum, 50 IU/ml penicillin/ 50 μg/ml streptomycin, and 2 mM glutamine.
RNA extraction
Total RNA was isolated from cells using Trizol (Life Technologies) and purified using the Direct-zol RNA kit (Zymo Research, Irvine, CA, USA: R2050) according to the manufacturer's instructions. RNA quality and quantity were assessed using the RNA 6000 Nano Kit with the Agilent 2100 Bioanalyzer (Agilent Technologies, Santa Clara, CA). RNA quantity was further assessed using a Nanodrop2000 (Thermo Scientific, Lafayette, CO) and Qubit HS RNA assay (Thermo Fisher Scientific).
RNA-Sequencing and Bioinformatics Analysis
Total RNA was depleted of ribosomal RNA, reverse transcribed and strand-specific adapters added following manufacturer's protocol (TruSeq Stranded Total RNA Library Prep kit with Ribo-Zero Gold, Illumina, San Diego, CA, USA) with the exception that the final cDNA libraries were amplified using the Real-time Library Amplification Kit (Kapa Biosystems, Wilmington, MA, USA) to reduce over-amplification of libraries. Generated cDNA libraries were assayed for quality using the High Sensitivity DNA Kit on the Agilent 2100 Bioanalyzer (Agilent Technologies) then sequenced as single-end 100 bp reads (IlluminaHiSeq1000, UVM Advanced Genome Technologies Core). Sequence files (fastq) were mapped to the most recent assemblies of the human genome (hg38) using TopHat2 (Kim et al., 2013). Expression counts were determined by HTSeq (Anders et al., 2015) with recent gene annotations (Gencode v23/v24) (Harrow et al., 2012). Differential expression was analyzed by DESeq2 (Love et al., 2014). Correlation between replicates and differential gene expression between samples was assessed by principal component analysis (PCA). Differentially expressed mRNAs after IGFL2-AS1 knockdown in MCF10-AT1 cells were analyzed for gene ontology using the Database for Annotation, Visualization and Integrated Discovery (DAVID) v6.7 using default parameters (Huang da et al., 2009a; Huang da et al., 2009b). RNA-Seq datasets have been deposited in the Gene Expression Omnibus (GEO) under accession code GSE98393.
Gene expression analysis
Complementary DNA (cDNA) was synthesized from isolated RNA using the Superscript III First-Strand Synthesis System (Life Technologies) according to the manufacturer's instructions. Quantitative RT-PCR (qPCR) was performed using gene-specific primers and SYBR Green Master Mix (Bio Rad, Hercules, CA) on a Viia 7 system (Applied Biosystems, Foster City, CA, USA). After normalization to the reference genes glyceraldehyde 3-phosphate dehydrogenase (GAPDH) and actin, relative expression levels of each target gene were calculated using the comparative CT (ΔCT) method. Oligonucleotide primer sequences used for qPCR are as follows: hGAPDH forward primer, 5′-ATGTTCGTCATGGGTGTGAA-3′; reverse primer, 5′-TGTGGTCATGAGTCCTTCCA-3′; hACTB forward primer, 5′-AGCACAGAGCCTCGCCTTT-3′; reverse primer, 5′-CGGCGATATCATCATCCAT-3′; hIGFL2-AS1 forward primer, 5′-AGTTCCTGATTTCAGCCCCA-3′; reverse primer, 5′-TCCTGGGTTGACAGGGTAGAA-3′; hIGFL1 forward primer, 5′-TGTCGCAGTGTCAGCTAATGG-3′; reverse primer, 5′-AAACAGCCACTCAGCATCCC-3′.
Transfections
MCF10-AT1 cells were transfected at 70-80% confluence with 10 nM negative control A GapmeR (neg con A) or GapmeR targeting IGFL2-AS1 (5′-TTGCGTCCCCGATTTA-3′) (Exiqon, Woburn, MA, USA) using Lipofectamine RNAiMAX (Life Technologies) according to the manufacturer's protocol. A mock transfection consisting of transfection reagent and media only was included as a control in each experiment. Cells were harvested for RNA analyses 48 h after transfection.
Wound healing assay
MCF-10AT1 cells were plated in 6-well plates and transfected with GapmeRs as described above. At 24 h after transfection, cells were at 90-100% confluence, and a wound was made with a pipette tip, cells were washed with PBS twice, and low-serum media was added (DMEM:F12 with 0.5% v/v horse serum + 10 μg/ml human insulin + 20 ng/ml recombinant hEGF + 100 ng/ml cholera toxin + 0.5 μg/ml hydrocortisone + 50 IU/ml penicillin/ 50 μg/ml streptomycin and 2 mM glutamine). The wound was monitored by obtaining images every 8 h following wounding. Wound area was measured using the MRI Wound Healing Tool plugin for ImageJ (https://imagej.nih.gov/ij/), and percent of wound closure was determined from these measurements.
Statistical Analyses
Statistical analyses were performed using GraphPad Prism v7.01. Data are represented as the mean ± S.E. The number of biological replicates (n) refers to separate cell cultures transfected at different times.
Results
lncRNA gene expression profiles in a breast cancer cell progression model
Transcriptome wide sequencing (RNA-seq) of the MCF-10 cell model of breast cancer progression (MCF-10A, MCF-10AT1, MCF-10CA1a) was performed to profile lncRNAs associated with increasing breast cancer aggression. Analysis of RNA-seq revealed 346 lncRNAs with differential expression (absolute fold change ≥1.5) across the three cell lines (Fig 1A). Clustering of the differentially expressed lncRNAs showed distinct profiles for each cell line. Clusters 1, 2, and 6 consist of lncRNAs that exhibit decreased expression in the two malignant cell lines compared to the normal-like cells; these may represent lncRNAs with tumor suppressive functions (Supplemental 1). For example, one lncRNA from cluster 1, GAS5-AS1 (Wu et al., 2016), and one lncRNA from cluster 2, TARID (Arab et al., 2014), have been shown to be downregulated in tumor compared to normal tissue in various cancers. In contrast, clusters 3 and 4 consist of lncRNAs that show increased expression in the two cancer cell lines compared to the normal-like MCF-10A; these may represent lncRNAs that are oncogenic. PVT1, a component of cluster 4, has been shown to be increased in breast cancer (Guan et al., 2007). Cluster 5 consists of lncRNAs that are unique to the metastatic MCF-10CA1a cells, indicating that they may be involved in metastasis.
Figure 1.

lncRNA gene expression profiling in breast cancer cells. A, Heatmap of differentially expressed lncRNAs in MCF-10A, MCF-10AT1, and MCF-10CA1a cells. B, Heatmap of differentially expressed lncRNAs in MCF-10A, MCF-7, and MDA-MB-231 cells. C and E, log2 values of DESeq2 normalized counts of LINC00857 (C) and IGFL2-AS1 (E) from RNA-seq in breast cell lines, MCF-10A (normal-like), MCF10AT1 (transformed, benign), MCF-10CA1a (metastatic), MCF-7 (luminal), and MDA-MB-231 (basal). Data are presented as mean ± S.E. Statistical significance was determined using One-way ANOVA with multiple comparisons. *P<0.05, **P<0.01, ****P<0.0001. D and F, log2 expression levels by RNA-seq of LINC00857 (D) and IGFL2-AS1 (F) in breast cancer patient samples from TCGA sorted by PAM50 genotype: normal-like, luminal A (lumA), luminal B (lumB), basal, and HER2-enriched (Her2). Boxplots represent minimum, lower quartile, median, upper quartile, and maximum values for each group.
We recently performed RNA-seq comparing gene expression of two additional breast cancer cell lines, MCF-7 and MDA-MB-231 to the MCF-10A cells (GSE75169) (Messier et al., 2016b). Here, we interrogated these datasets and identified 2413 differentially expressed lncRNAs between MCF-10A, MCF-7, and MDA-MB-231 cells (Fig 1B). Clustering of the differentially expressed lncRNAs among these cell lines revealed several patterns of expression similar to the MCF-10 progression series (Fig 1A and B). Cluster 4 exhibited a distinct expression profile suggesting that these lncRNAs are uniquely expressed in luminal breast cancers (Supplemental 2). For example, DSCAM-AS1, a component of cluster 4, has been shown to be positively associated with the luminal subtype (Miano et al., 2016; Niknafs et al., 2016). When clusters 1, 2, 3, 5, and 6 were compared to the similar clusters from the MCF-10 progression series, there were 61 common lncRNAs. To find clinically relevant lncRNAs with similar expression patterns in breast cancer patient samples, we queried data from The Cancer Genome Atlas (TCGA) Research Network (2012) using The Atlas of ncRNA in Cancer (TANRIC) (Li et al., 2015). Of the 61 lncRNAs common to the MCF-10 progression series and the MCF-10A, MCF-7, MDA-MB-231 cell lines, 20 lncRNAs had similar expression levels in breast cancer patient samples, two examples are shown in Fig 1. LINC00857, localized to cluster5, was more highly expressed in the aggressive MCF-10CA1a and MDA-MB-231 cells (Fig 1C) and had higher expression in aggressive, basal breast cancer tumor samples compared to normal-like patient tissue and the luminal subtypes (Fig 1D). Similarly, IGFL2-AS1 was found in cluster 6 (lower expression in transformed cells) (Fig 1E) and had lower expression in most breast cancer tumor samples compared to normal-like patient tissue (Fig 1F).
Decreased IGFL2-AS1 expression in breast cancer cells alters cell adhesion
We selected IGFL2-AS1 for further investigation based on its high expression in MCF-10A cells compared to the 4 cancer cell lines (Fig 1E). In agreement with the RNA-seq data, IGFL2-AS1 expression by qPCR was highest in MCF-10A, with decreasing expression in MCF-10AT1 and MCF-10CA1a and no detectable expression in MCF-7 or MDA-MB-231 cells (Fig 2A). To confirm regulated expression, we examined specific histone marks that are associated with activation, H3K4 tri-methylation (H3K4me3) and H3K4 acetylation (H3K4ac), and repression, H3K27 tri-methylation (H3K27me3). We previously profiled several histone marks in MCF-10A, MCF-7, and MDA-MB-231 cells (GSE75169, GSE77772) (Messier et al., 2016a; Messier et al., 2016b). In MCF-10A cells, there are H3K4me3 and H3K4ac marks, indicative of a promoter region (Fig 2B) at the transcription start site (TSS) with defined peaks for H3K4me3 while H3K4ac is more broadly distributed both 5′ and 3′ of the TSS. In both MCF-7 and MDA-MB-231 cells, the gene was marked primarily with H3K27me3, consistent with decreased IGFL2-AS1 expression in these two cell lines.
Figure 2.

IGFL2-AS1 expression is decreased in breast cancer cells. A, IGFL2-AS1 expression by qPCR in four breast cancer cell lines compared to MCF-10A cells, n=3, IGFL2-AS1 expression is relative to GAPDH and ACTB. Data are presented as mean ± S.E. Statistical significance was determined using One-way ANOVA with multiple comparisons. **P<0.01. B, UCSC genome browser tracks (genome build hg38) of RNA-seq and H3K4me3, H3K4ac, and H3K27me3 ChlP-seq peaks at IGFL2-AS1 in MCF-10A, MCF-7, and MDA-MB-231 cells. The scale for the RNA-seq tracks is 0-50 reads per million, purple bars indicate peaks that go beyond the scale. The scale for all ChlP-seq tracks is 0-2 log10 enrichment. IGFL2-AS1 is located at Chr19 q13.32 on the negative strand; the depicted tracks have been flipped to read left to right.
The steady decrease of IGFL2-AS1 expression throughout the MCF-10 progression series led us to investigate whether this lncRNA plays a tumor suppressor role in breast cancer. We performed knockdown experiments in the MCF-10AT1 cell line for two reasons: it has intermediate expression levels of IGFL2-AS1 (Fig 1E, 2A), and while it is transformed, it is not as aggressive as the MCF-10CA1a cell line. Depletion of IGFL2-AS1 was accomplished using a custom designed, locked nucleic acid (LNA) modified anti-sense oligonucleotide (GapmeR) targeting IGFL2-AS1. The GapmeR consistently achieved near 60% knockdown of IGFL2-AS1 expression at 48 h after transfection when compared to the negative control (non-silencing GapmeR transfection) (Fig 3A).
Figure 3.

Depletion of IGFL2-AS1 affects gene expression. A, MCF-10AT1 cells transfected with control GapmeR or IGFL2-AS1 GapmeR were analyzed for IGFL2-AS1 expression by qPCR, 48 h after transfection, n=3. IGFL2-AS1 expression is relative to GAPDH and ACTB. Data are presented as mean ± S.E. Statistical significance was determined using unpaired t-test. ****P<0.0001. B, MA plot displaying differentially expressed mRNAs (blue circles) and IncRNAs (red circles) in MCF-10AT1 cells with IGFL2-AS1 knockdown (IGFL2-AS1 GapmeR) compared to control MCF-10AT1 cells (control GapmeR); grey dots represent genes that did not make the fold change (FC) (≥1.5) or p-value (<0.05) cutoffs. Data is from 3 biological replicates. C, Gene ontology analysis using DAVID of genes that were downregulated in IGFL2-AS1 GapmeR compared to control GapmeR.
To investigate the global effect of IGFL2-AS1 depletion on gene expression, we performed RNA-seq analysis after IGFL2-AS1 knockdown in MCF-10AT1 cells. We found 322 genes with a ≥1.5-fold difference in expression in cells treated with IGFL2-AS1 GapmeR versus control (Fig 3B). The majority of the genes, 306, were downregulated; only 16 genes were upregulated. Gene ontology (GO) analysis of the downregulated protein coding genes revealed that several biological processes were affected by IGFL2-AS1 depletion (Fig 3C). The most significantly altered biological process was cell-cell adhesion, indicating that depletion of IGFL2-AS1 reduces intercellular contacts.
IGFL2-AS1 functions in cis and has a role in wound healing
lncRNAs can regulate gene expression through several different mechanisms, functioning either in cis or trans (Wang and Chang, 2011). To determine whether IGFL2-AS1 regulates genes in either cis or trans, we performed positional gene enrichment (PGE) (De Preter et al., 2008) on the genes that were differentially expressed following IGFL2-AS1 knockdown in MCF-10AT1 cells. Of the 322 differentially expressed genes, 292 could be mapped to chromosomes using PGE with genome build hg19. IGFL2-AS1 is located on chr19q13.32, and the most significant enrichment of differentially expressed genes occurred on chr19 (Fig 4A), suggesting that IGFL2-AS1 affects gene expression in cis. Fig 4B shows other chromosomal regions with significant enrichment of differentially expressed genes after IGFL2-AS1 knockdown. We further tested the significance of this cis gene regulation by IGFL2-AS1 by examining the expression of its neighboring genes. IGFL2-AS1 is located in a cluster of genes encoding a family of insulin growth factor like (IGFL) proteins. IGFL1 is the nearest protein coding neighbor to IGFL2-AS1, and its expression in the MCF-10 progression series was reciprocal to IGFL2-AS1 expression (Fig 4C). In addition, GapmeR-mediated knockdown of IGFL2-AS1 led to an increase in IGFL1 expression in MCF-10AT1 cells (Fig 4D). Taken together, these results suggest that IGFL2-AS1 negatively regulates expression of IGFL1, further supporting the cis regulatory function of IGFL2-AS1.
Figure 4.

IGFL2-AS1 regulates genes in cis. A, Positional gene enrichment on Chr19 of regions significantly for enriched differentially expressed genes in IGFL2-AS1 GapmeR-depleted MCF-10AT1 cells compared to control cells. Blue bars represent enriched regions; p-value of enrichment is next to blue bar. Genomic location of IGFL2-AS1 is indicated by a red bar on the chromosome ideogram. B, The next top five chromosome regions significantly enriched in genes differentially expressed after IGFL2-AS1 depletion in MCF-10AT1 cells. C, log2 values of DESeq2 normalized counts of IGFL1 (nearest neighbor of IGFL2-AS1) from RNA-seq in HCF-10A, MCF10AT1, and MCF-10CA1a. Data are presented as mean ± S.E. Statistical significance was determined using One-way ANOVA with multiple comparisons. **P<0.01. D, MCF-10AT1 cells transfected with control GapmeR or IGFL2-AS1 GapmeR were analyzed for IGFL1 expression by qPCR, 48 h after transfection, n=3. IGFL1 expression is relative to GAPDH and ACTB. Data are presented as mean ± S.E. Statistical significance was determined using unpaired t-test. *P<0.05.
Given the relatively high expression of IGFL2-AS1 in MCF-10A cells, its strong downregulation in metastatic MCF-10CA1a cells (Fig 2), and that its knockdown affected multiple parameters of cell structure and function (Fig 3C), we postulated that IGFL2-AS1 may affect migration in breast cancer cells. This hypothesis was tested using a wound healing assay (Fig 5). MCF-10AT1 cells with GapmeR-mediated knockdown of IGFL2-AS1 had significantly decreased wound healing capacity compared to controls as measured by percent of wound closure over time.
Figure 5.
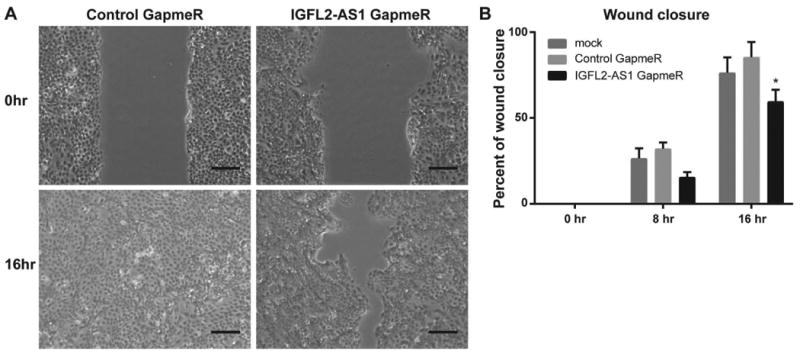
IGFL2-AS1 depletion decreases wound healing, A, MCF-10AT1 cells with mock transfection, transfected with control GapmeR, or with IGFL2-AS1 GapmeR were wounded at 24 h after transfection and imaged every 8 h starting at the time of wounding. Representative phase contrast images of wound healing assays at 0 h (top two panels) and at 16 h (bottom two panels) after wounding in control GapmeR transfected cells (left two panels) and IGFL2-AS1 GapmeR transfected cells (right two panels). Scale bar represents 200μm. B, Wound area was measured using ImageJ software and percentage of wound closure was determined at 0h, 8 h, and 16 h after wounding for mock transfected cells (n=3), control GapmeR transfected cells (n=2), and IGFL2-AS1 GapmeR transfected cells (n=3). Data presented as mean ± S.E. Statistical significance was determined using Two-way ANOVA with multiple comparisons. *P<0.05.
Taken together these findings that include cis gene regulation and effects on cancer cell properties as well as negative correlation with cancer progression indicate that loss of IGFL2-AS1 contributes to cancer progression.
Discussion
Here, we have taken a transcriptome wide sequencing approach to identify novel lncRNAs associated with breast cancer. While lncRNAs have been associated with breast cancer pathology, the functional roles that these lncRNAs play in breast cancer development are minimally understood. We pursued RNA-seq analysis in a series of breast cancer cell lines modeling disease progression. This strategy permitted identification of lncRNAs that could be functionally characterized in cells of different breast cancer stages, and in a clinically relevant context by interrogating their expression in TCGA patient data. We focused on the function of a previously uncharacterized lncRNA, IGFL2-AS1, that is highly expressed in normal breast epithelial cells and downregulated in breast cancer cell lines as well as in luminal breast cancer patient tissue.
With the growing interest in lncRNAs as prognostic and diagnostic tools, there has been an increased effort to thoroughly profile lncRNA expression in breast cancer. While many groups have focused on identifying lncRNAs associated with various breast cancer subtypes (Jiang et al., 2016; Niknafs et al., 2016; Su et al., 2014; Van Grembergen et al., 2016), few studies have sought to profile lncRNA expression changes during disease progression, from normal cells, to indolent disease, to the end-point of metastatic cancer. In this study, we have taken advantage of the MCF-10 cell series model of breast cancer to profile lncRNAs associated with disease progression. The analysis of our RNA-seq data identified several hundred lncRNAs with various patterns of increasing and decreasing expression throughout the MCF-10 series. The identification of known lncRNAs that have functions consistent with their expression patterns in our dataset, validates using the MCF-10 series to profile lncRNAs associated with disease progression.
We examined another set of cell lines that represent different disease stages and subtypes, MCF-10A (normal-like), MCF-7 (early stage, luminal), and MDA-MB-231 (late stage, basal). The lncRNAs that have similar expression patterns in these two datasets likely play important roles in the development of breast cancer. For example, the lncRNAs that are common to clusters 3 (Fig 1) may be important in early tumorigenesis as their expression is increased in both early stage cell lines (MCF-10AT1 and MCF-7) and remains elevated in late stage cells (MCF-10CA1a and MDA-MB-231) compared to the normal-like cells (MCF-10A). Whereas, the lncRNAs common to clusters 5 could be important players in the progression to aggressive disease as their expression remains low in normal-like and early stage cells, then increases substantially in the late stage cells. Finally, lncRNAs common to cluster 6 exhibit a dramatic decrease in each of the cancer cell lines compared to the normal-like cells suggesting involvement in maintaining a normal cell phenotype.
We focused our studies on IGFL2-AS1 which exhibits the greatest fold-change decrease between MCF-10A and MCF-10CA1a cells. IGFL2-AS1 depletion in MCF-10AT1 cells indicates a role for this lncRNA in maintaining cell structure (Fig 3). The positional gene enrichment analysis showed that 15% of differentially expressed genes are on the same chromosome as IGFL2-AS1, suggesting that it is involved in regulating genes in cis (Fig 4). However, the exact mechanism by which IGFL2-AS1 regulates its genomic neighborhood remains unknown. Several lncRNAs function in cis to alter gene expression by mediating chromosome looping between enhancer elements and promoters of nearby genes (Lai et al., 2013; Li et al., 2013; Wang et al., 2011), by affecting mRNA stability (Faghihi et al., 2008; Faghihi et al., 2010), and by regulating chromatin structure (Kotake et al., 2011; Morris et al., 2008). The majority of genes affected by IGFL2-AS1 depletion were downregulated, suggesting that it positively regulates these genes, and that it may function to enhance gene expression.
In contrast, our results regarding the reciprocal nature of IGFL2-AS1 expression and its nearest neighbor, IGFL1, suggest that IGFL2-AS1 negatively regulates this gene (Fig 4). A reciprocal expression pattern of these two genes is also seen in psoriasis skin lesions compared to normal skin (GSE54456) (Li et al., 2014). This further supports a negative regulatory role for IGFL2-AS1 in IGFL1 expression. lncRNAs have been shown to repress gene expression through a variety of mechanisms (Wang and Chang, 2011). The seemingly disparate roles of IGFL2-AS1 as either enhancing or repressing gene expression are not mutually exclusive. For example, if IGFL2-AS1 regulates gene expression through transcription factor binding, then whether the target gene is activated or repressed will depend on the surrounding genomic context.
Our gene ontology analysis suggested a role for IGFL2-AS1 in cell structure. Together with the decreased expression of IGFL2-AS1 in our breast cancer progression model, we anticipated an effect on wound healing upon knockdown in MCF-10AT1, which we observed. The mechanism for this result is unknown; however, our data indicates that IGFL2-AS1 negatively regulates IGFL1, a secreted protein that has been implicated in inflammation (Lobito et al., 2011). As inflammation plays a well-known role in cancer from tumor initiation through progression to malignant disease (Coussens and Werb, 2002), loss of IGFL2-AS1 may contribute to breast cancer progression by increasing expression of IGFL1 and thus inflammation.
In conclusion, our experimental data show that the previously uncharacterized lncRNA, IGFL2-AS1, which is decreased during breast cancer progression, alters cell structure as reflected by effects on gene expression and decreased cell migration. Overall, our study provides a unique profiling of lncRNA expression in breast cancer and identifies many new lncRNAs associated with disease progression. These findings provide a valuable resource to better understand the contribution of lncRNAs in breast cancer progression. This rich collection of lncRNAs dysregulated in four breast cancer cell lines can be used for future studies that address the functional mechanisms of lncRNAs, as well as their prognostic and diagnostic potential.
Supplementary Material
Acknowledgments
Studies reported here were supported by NIH/NCI P01 CA082834 (GSS), NIH/NIAMS R01 AR0039588 (GSS/JBL), NIH/NCI U01 CA196383 (JLS), NIH/NIDCR R37 DE012528 (JBL) and Lake Champlain Cancer Research Organization/University of Vermont Cancer Center Program Juckett Postdoctoral Fellowship (KMT). The authors thank Joseph Boyd for help with bioinformatics analyses. The next-generation sequencing was performed in the University of Vermont Cancer Center Advanced Genome Technologies Core and was supported by the University of Vermont Cancer Center, Lake Champlain Cancer Research Organization, and the University of Vermont College of Medicine.
Literature Cited
- 1.Comprehensive molecular portraits of human breast tumours. Nature. 2012;490(7418):61–70. doi: 10.1038/nature11412. [DOI] [PMC free article] [PubMed] [Google Scholar]
- 2.Adriaenssens E, Dumont L, Lottin S, Bolle D, Lepretre A, Delobelle A, Bouali F, Dugimont T, Coll J, Curgy JJ. H19 overexpression in breast adenocarcinoma stromal cells is associated with tumor values and steroid receptor status but independent of p53 and Ki-67 expression. The American journal of pathology. 1998;153(5):1597–1607. doi: 10.1016/S0002-9440(10)65748-3. [DOI] [PMC free article] [PubMed] [Google Scholar]
- 3.Anders S, Pyl PT, Huber W. HTSeq-a Python framework to work with high-throughput sequencing data. Bioinformatics. 2015;31(2):166–169. doi: 10.1093/bioinformatics/btu638. [DOI] [PMC free article] [PubMed] [Google Scholar]
- 4.Arab K, Park YJ, Lindroth AM, Schafer A, Oakes C, Weichenhan D, Lukanova A, Lundin E, Risch A, Meister M, Dienemann H, Dyckhoff G, Herold-Mende C, Grummt I, Niehrs C, Plass C. Long noncoding RNA TARID directs demethylation and activation of the tumor suppressor TCF21 via GADD45A. Molecular cell. 2014;55(4):604–614. doi: 10.1016/j.molcel.2014.06.031. [DOI] [PubMed] [Google Scholar]
- 5.Berteaux N, Lottin S, Monte D, Pinte S, Quatannens B, Coll J, Hondermarck H, Curgy JJ, Dugimont T, Adriaenssens E. H19 mRNA-like noncoding RNA promotes breast cancer cell proliferation through positive control by E2F1. The Journal of biological chemistry. 2005;280(33):29625–29636. doi: 10.1074/jbc.M504033200. [DOI] [PubMed] [Google Scholar]
- 6.Coussens LM, Werb Z. Inflammation and cancer. Nature. 2002;420(6917):860–867. doi: 10.1038/nature01322. [DOI] [PMC free article] [PubMed] [Google Scholar]
- 7.Dawson PJ, Wolman SR, Tait L, Heppner GH, Miller FR. MCF10AT: a model for the evolution of cancer from proliferative breast disease. The American journal of pathology. 1996;148(1):313–319. [PMC free article] [PubMed] [Google Scholar]
- 8.De Preter K, Barriot R, Speleman F, Vandesompele J, Moreau Y. Positional gene enrichment analysis of gene sets for high-resolution identification of overrepresented chromosomal regions. Nucleic acids research. 2008;36(7):e43. doi: 10.1093/nar/gkn114. [DOI] [PMC free article] [PubMed] [Google Scholar]
- 9.Ding X, Zhu L, Ji T, Zhang X, Wang F, Gan S, Zhao M, Yang H. Long intergenic non-coding RNAs (LincRNAs) identified by RNA-seq in breast cancer. PloS one. 2014;9(8):e103270. doi: 10.1371/journal.pone.0103270. [DOI] [PMC free article] [PubMed] [Google Scholar]
- 10.Faghihi MA, Modarresi F, Khalil AM, Wood DE, Sahagan BG, Morgan TE, Finch CE, St Laurent G, 3rd, Kenny PJ, Wahlestedt C. Expression of a noncoding RNA is elevated in Alzheimer's disease and drives rapid feed-forward regulation of beta-secretase. Nature medicine. 2008;14(7):723–730. doi: 10.1038/nm1784. [DOI] [PMC free article] [PubMed] [Google Scholar]
- 11.Faghihi MA, Zhang M, Huang J, Modarresi F, Van der Brug MP, Nalls MA, Cookson MR, St-Laurent G, 3rd, Wahlestedt C. Evidence for natural antisense transcript-mediated inhibition of microRNA function. Genome biology. 2010;11(5):R56. doi: 10.1186/gb-2010-11-5-r56. [DOI] [PMC free article] [PubMed] [Google Scholar]
- 12.Guan Y, Kuo WL, Stilwell JL, Takano H, Lapuk AV, Fridlyand J, Mao JH, Yu M, Miller MA, Santos JL, Kalloger SE, Carlson JW, Ginzinger DG, Celniker SE, Mills GB, Huntsman DG, Gray JW. Amplification of PVT1 contributes to the pathophysiology of ovarian and breast cancer. Clinical cancer research : an official journal of the American Association for Cancer Research. 2007;13(19):5745–5755. doi: 10.1158/1078-0432.CCR-06-2882. [DOI] [PubMed] [Google Scholar]
- 13.Gupta RA, Shah N, Wang KC, Kim J, Horlings HM, Wong DJ, Tsai MC, Hung T, Argani P, Rinn JL, Wang Y, Brzoska P, Kong B, Li R, West RB, van de Vijver MJ, Sukumar S, Chang HY. Long non-coding RNA HOTAIR reprograms chromatin state to promote cancer metastasis. Nature. 2010;464(7291):1071–1076. doi: 10.1038/nature08975. [DOI] [PMC free article] [PubMed] [Google Scholar]
- 14.Harrow J, Frankish A, Gonzalez JM, Tapanari E, Diekhans M, Kokocinski F, Aken BL, Barrell D, Zadissa A, Searle S, Barnes I, Bignell A, Boychenko V, Hunt T, Kay M, Mukherjee G, Rajan J, Despacio-Reyes G, Saunders G, Steward C, Harte R, Lin M, Howald C, Tanzer A, Derrien T, Chrast J, Walters N, Balasubramanian S, Pei B, Tress M, Rodriguez JM, Ezkurdia I, van Baren J, Brent M, Haussler D, Kellis M, Valencia A, Reymond A, Gerstein M, Guigo R, Hubbard TJ. GENCODE: the reference human genome annotation for The ENCODE Project. Genome research. 2012;22(9):1760–1774. doi: 10.1101/gr.135350.111. [DOI] [PMC free article] [PubMed] [Google Scholar]
- 15.Huang da W, Sherman BT, Lempicki RA. Bioinformatics enrichment tools: paths toward the comprehensive functional analysis of large gene lists. Nucleic acids research. 2009a;37(1):1–13. doi: 10.1093/nar/gkn923. [DOI] [PMC free article] [PubMed] [Google Scholar]
- 16.Huang da W, Sherman BT, Lempicki RA. Systematic and integrative analysis of large gene lists using DAVID bioinformatics resources. Nature protocols. 2009b;4(1):44–57. doi: 10.1038/nprot.2008.211. [DOI] [PubMed] [Google Scholar]
- 17.Huarte M. The emerging role of lncRNAs in cancer. Nature medicine. 2015;21(11):1253–1261. doi: 10.1038/nm.3981. [DOI] [PubMed] [Google Scholar]
- 18.Jiang YZ, Liu YR, Xu XE, Jin X, Hu X, Yu KD, Shao ZM. Transcriptome Analysis of Triple-Negative Breast Cancer Reveals an Integrated mRNA-lncRNA Signature with Predictive and Prognostic Value. Cancer research. 2016;76(8):2105–2114. doi: 10.1158/0008-5472.CAN-15-3284. [DOI] [PubMed] [Google Scholar]
- 19.Johnson RH, Chien FL, Bleyer A. Incidence of breast cancer with distant involvement among women in the United States, 1976 to 2009. Jama. 2013;309(8):800–805. doi: 10.1001/jama.2013.776. [DOI] [PubMed] [Google Scholar]
- 20.Kim D, Pertea G, Trapnell C, Pimentel H, Kelley R, Salzberg SL. TopHat2: accurate alignment of transcriptomes in the presence of insertions, deletions and gene fusions. Genome biology. 2013;14(4):R36. doi: 10.1186/gb-2013-14-4-r36. [DOI] [PMC free article] [PubMed] [Google Scholar]
- 21.Kotake Y, Nakagawa T, Kitagawa K, Suzuki S, Liu N, Kitagawa M, Xiong Y. Long non-coding RNA ANRIL is required for the PRC2 recruitment to and silencing of p15(INK4B) tumor suppressor gene. Oncogene. 2011;30(16):1956–1962. doi: 10.1038/onc.2010.568. [DOI] [PMC free article] [PubMed] [Google Scholar]
- 22.Lai F, Orom UA, Cesaroni M, Beringer M, Taatjes DJ, Blobel GA, Shiekhattar R. Activating RNAs associate with Mediator to enhance chromatin architecture and transcription. Nature. 2013;494(7438):497–501. doi: 10.1038/nature11884. [DOI] [PMC free article] [PubMed] [Google Scholar]
- 23.Li B, Tsoi LC, Swindell WR, Gudjonsson JE, Tejasvi T, Johnston A, Ding J, Stuart PE, Xing X, Kochkodan JJ, Voorhees JJ, Kang HM, Nair RP, Abecasis GR, Elder JT. Transcriptome analysis of psoriasis in a large case-control sample: RNA-seq provides insights into disease mechanisms. The Journal of investigative dermatology. 2014;134(7):1828–1838. doi: 10.1038/jid.2014.28. [DOI] [PMC free article] [PubMed] [Google Scholar]
- 24.Li J, Han L, Roebuck P, Diao L, Liu L, Yuan Y, Weinstein JN, Liang H. TANRIC: An Interactive Open Platform to Explore the Function of lncRNAs in Cancer. Cancer research. 2015;75(18):3728–3737. doi: 10.1158/0008-5472.CAN-15-0273. [DOI] [PMC free article] [PubMed] [Google Scholar]
- 25.Li W, Notani D, Ma Q, Tanasa B, Nunez E, Chen AY, Merkurjev D, Zhang J, Ohgi K, Song X, Oh S, Kim HS, Glass CK, Rosenfeld MG. Functional roles of enhancer RNAs for oestrogen-dependent transcriptional activation. Nature. 2013;498(7455):516–520. doi: 10.1038/nature12210. [DOI] [PMC free article] [PubMed] [Google Scholar]
- 26.Lobito AA, Ramani SR, Tom I, Bazan JF, Luis E, Fairbrother WJ, Ouyang W, Gonzalez LC. Murine insulin growth factor-like (IGFL) and human IGFL1 proteins are induced in inflammatory skin conditions and bind to a novel tumor necrosis factor receptor family member, IGFLR1. The Journal of biological chemistry. 2011;286(21):18969–18981. doi: 10.1074/jbc.M111.224626. [DOI] [PMC free article] [PubMed] [Google Scholar]
- 27.Love MI, Huber W, Anders S. Moderated estimation of fold change and dispersion for RNA-seq data with DESeq2. Genome biology. 2014;15(12):550. doi: 10.1186/s13059-014-0550-8. [DOI] [PMC free article] [PubMed] [Google Scholar]
- 28.Messier TL, Boyd JR, Gordon JA, Stein JL, Lian JB, Stein GS. Oncofetal Epigenetic Bivalency in Breast Cancer Cells: H3K4 and H3K27 Tri-Methylation as a Biomarker for Phenotypic Plasticity. Journal of cellular physiology. 2016a;231(11):2474–2481. doi: 10.1002/jcp.25359. [DOI] [PMC free article] [PubMed] [Google Scholar]
- 29.Messier TL, Gordon JA, Boyd JR, Tye CE, Browne G, Stein JL, Lian JB, Stein GS. Histone H3 lysine 4 acetylation and methylation dynamics define breast cancer subtypes. Oncotarget. 2016b;7(5):5094–5109. doi: 10.18632/oncotarget.6922. [DOI] [PMC free article] [PubMed] [Google Scholar]
- 30.Miano V, Ferrero G, Reineri S, Caizzi L, Annaratone L, Ricci L, Cutrupi S, Castellano I, Cordero F, De Bortoli M. Luminal long non-coding RNAs regulated by estrogen receptor alpha in a ligand-independent manner show functional roles in breast cancer. Oncotarget. 2016;7(3):3201–3216. doi: 10.18632/oncotarget.6420. [DOI] [PMC free article] [PubMed] [Google Scholar]
- 31.Morris KV, Santoso S, Turner AM, Pastori C, Hawkins PG. Bidirectional transcription directs both transcriptional gene activation and suppression in human cells. PLoS genetics. 2008;4(11):e1000258. doi: 10.1371/journal.pgen.1000258. [DOI] [PMC free article] [PubMed] [Google Scholar]
- 32.Niknafs YS, Han S, Ma T, Speers C, Zhang C, Wilder-Romans K, Iyer MK, Pitchiaya S, Malik R, Hosono Y, Prensner JR, Poliakov A, Singhal U, Xiao L, Kregel S, Siebenaler RF, Zhao SG, Uhl M, Gawronski A, Hayes DF, Pierce LJ, Cao X, Collins C, Backofen R, Sahinalp CS, Rae JM, Chinnaiyan AM, Feng FY. The lncRNA landscape of breast cancer reveals a role for DSCAM-AS1 in breast cancer progression. Nature communications. 2016;7:12791. doi: 10.1038/ncomms12791. [DOI] [PMC free article] [PubMed] [Google Scholar]
- 33.Rinn JL, Chang HY. Genome regulation by long noncoding RNAs. Annual review of biochemistry. 2012;81:145–166. doi: 10.1146/annurev-biochem-051410-092902. [DOI] [PMC free article] [PubMed] [Google Scholar]
- 34.Santner SJ, Dawson PJ, Tait L, Soule HD, Eliason J, Mohamed AN, Wolman SR, Heppner GH, Miller FR. Malignant MCF10CA1 cell lines derived from premalignant human breast epithelial MCF10AT cells. Breast cancer research and treatment. 2001;65(2):101–110. doi: 10.1023/a:1006461422273. [DOI] [PubMed] [Google Scholar]
- 35.Schmitt AM, Chang HY. Long Noncoding RNAs in Cancer Pathways. Cancer cell. 2016;29(4):452–463. doi: 10.1016/j.ccell.2016.03.010. [DOI] [PMC free article] [PubMed] [Google Scholar]
- 36.Sorensen KP, Thomassen M, Tan Q, Bak M, Cold S, Burton M, Larsen MJ, Kruse TA. Long non-coding RNA expression profiles predict metastasis in lymph node-negative breast cancer independently of traditional prognostic markers. Breast cancer research. 2015;17:55. doi: 10.1186/s13058-015-0557-4. [DOI] [PMC free article] [PubMed] [Google Scholar]
- 37.Soule HD, Maloney TM, Wolman SR, Peterson WD, Jr, Brenz R, McGrath CM, Russo J, Pauley RJ, Jones RF, Brooks SC. Isolation and characterization of a spontaneously immortalized human breast epithelial cell line, MCF-10. Cancer research. 1990;50(18):6075–6086. [PubMed] [Google Scholar]
- 38.Su X, Malouf GG, Chen Y, Zhang J, Yao H, Valero V, Weinstein JN, Spano JP, Meric-Bernstam F, Khayat D, Esteva FJ. Comprehensive analysis of long non-coding RNAs in human breast cancer clinical subtypes. Oncotarget. 2014;5(20):9864–9876. doi: 10.18632/oncotarget.2454. [DOI] [PMC free article] [PubMed] [Google Scholar]
- 39.Sun J, Chen X, Wang Z, Guo M, Shi H, Wang X, Cheng L, Zhou M. A potential prognostic long non-coding RNA signature to predict metastasis-free survival of breast cancer patients. Scientific reports. 2015;5:16553. doi: 10.1038/srep16553. [DOI] [PMC free article] [PubMed] [Google Scholar]
- 40.Van Grembergen O, Bizet M, de Bony EJ, Calonne E, Putmans P, Brohee S, Olsen C, Guo M, Bontempi G, Sotiriou C, Defrance M, Fuks F. Portraying breast cancers with long noncoding RNAs. Science advances. 2016;2(9):e1600220. doi: 10.1126/sciadv.1600220. [DOI] [PMC free article] [PubMed] [Google Scholar]
- 41.Wang KC, Chang HY. Molecular mechanisms of long noncoding RNAs. Molecular cell. 2011;43(6):904–914. doi: 10.1016/j.molcel.2011.08.018. [DOI] [PMC free article] [PubMed] [Google Scholar]
- 42.Wang KC, Yang YW, Liu B, Sanyal A, Corces-Zimmerman R, Chen Y, Lajoie BR, Protacio A, Flynn RA, Gupta RA, Wysocka J, Lei M, Dekker J, Helms JA, Chang HY. A long noncoding RNA maintains active chromatin to coordinate homeotic gene expression. Nature. 2011;472(7341):120–124. doi: 10.1038/nature09819. [DOI] [PMC free article] [PubMed] [Google Scholar]
- 43.Wu Y, Lyu H, Liu H, Shi X, Song Y, Liu B. Downregulation of the long noncoding RNA GAS5-AS1 contributes to tumor metastasis in non-small cell lung cancer. Scientific reports. 2016;6:31093. doi: 10.1038/srep31093. [DOI] [PMC free article] [PubMed] [Google Scholar]
- 44.Xu N, Chen F, Wang F, Lu X, Wang X, Lv M, Lu C. Clinical significance of high expression of circulating serum lncRNA RP11-445H22.4 in breast cancer patients: a Chinese population-based study. Tumour biology : the journal of the International Society for Oncodevelopmental Biology and Medicine. 2015;36(10):7659–7665. doi: 10.1007/s13277-015-3469-0. [DOI] [PubMed] [Google Scholar]
- 45.Zhang Z, Weaver DL, Olsen D, deKay J, Peng Z, Ashikaga T, Evans MF. Long non-coding RNA chromogenic in situ hybridisation signal pattern correlation with breast tumour pathology. Journal of clinical pathology. 2016;69(1):76–81. doi: 10.1136/jclinpath-2015-203275. [DOI] [PubMed] [Google Scholar]
- 46.Zhao W, Luo J, Jiao S. Comprehensive characterization of cancer subtype associated long non-coding RNAs and their clinical implications. Scientific reports. 2014;4:6591. doi: 10.1038/srep06591. [DOI] [PMC free article] [PubMed] [Google Scholar]
Associated Data
This section collects any data citations, data availability statements, or supplementary materials included in this article.