Abstract
Diatomite consists of fossilized remains of ancient diatoms and is a type of naturally abundant photonic crystal biosilica with multiple unique physical and chemical functionalities. In this paper, we explored the fluidic properties of diatomite as the matrix for on-chip chromatography and, simultaneously, the photonic crystal effects to enhance the plasmonic resonances of metallic nanoparticles for surface-enhanced Raman scattering (SERS) biosensing. The plasmonic nanoparticle-decorated diatomite biosilica provides a lab-on-a-chip capability to separate and detect small molecules from mixture samples with ultra-high detection sensitivity down to 1 ppm. We demonstrate the significant potential for biomedical applications by screening toxins in real biofluid, achieving simultaneous label-free biosensing of phenethylamine and miR21cDNA in human plasma with unprecedented sensitivity and specificity. To the best of our knowledge, this is the first time demonstration to detect target molecules from real biofluids by on-chip chromatography-SERS techniques.
Keywords: Diatomite Biosilica, Lab-on-a-Chip, On-chip Chromatography, Surface-Enhanced Raman Scattering, Photonic Crystals, Plasmonics
Graphical Abstract
1. Introduction
Diatoms are unicellular, photosynthetic biomineralization marine organisms that possess a biosilica shell, which is called the frustule, with two dimensional (2-D) periodic pores[1, 2]. The unique optical, physical, and chemical properties of diatom frustules have attracted long-lasting interests for more than two centuries[3–5]. For instance, the hierarchical nanoscale photonic crystal features can reflect vivid colors and enhance the local optical fields at the surface of diatom frustules[6, 7]. The abundant hydroxyl groups at the frustule surface make diatom biosilica very hydrophilic[8]. The nano-corrugated surface, which possess a large surface-to-volume ratio of 200m2/g, induces micro- and nano-fluidic properties that can achieve unique fluidic control[9, 10].
In recent years, there has been an escalating trend to detect biological targets with ultra-high sensitivity using diatom biosilica[11]. Zhen et. al. developed PL-based diatom biosensors that have been successfully applied for TNT sensing[12]. De Stefano et al. modified the diatom frustules (Coscinodiscus concinnus) chemically and then attached antibodies as a highly-selective bioprobe for immunocomplex biosensing[13]. Our previous studies have proved that metallic nanoparticles (NPs) located near or inside the periodic nanopores of diatoms can form hybrid photonic-plasmonic modes via theoretical analysis and experimental results[14–16]. These photonic-plasmonic modes further increase the local optical field near the plasmonic NPs and additional SERS enhancement was achieved. Furthermore, our group has utilized diatom biosilica as a platform for a sandwich-type immunoassay[17], which can detect large biomolecules such as antigens from complex biological samples. In the developed immunoassay, the diatom-Ag substrate was first functionalized with an antibody. With the presence of target antigens, the Au NPs labeled with Raman probe molecules and the antibody could crosslink onto the diatom-Ag substrate through specific recognition between the antibody and the antigen. That study showed that diatom frustules improved the detection limit of the antigen to 10 pg/mL, which is nearly 100 times better than conventional colloidal SERS immunoassay on a flat glass substrate.
However, immunoassay is not very effective at detecting small molecules due to the weak change of the signals and the time-consuming labeling processes. In principle, surface enhanced Raman spectroscopy (SERS)[18] can provide unique identification to a target analyte, especially small molecules such as illicit drugs[19, 20]. In practice, however, this is not always true for real-world samples due to various forms of interference[21]. For instance, it is extremely difficult to directly detect small molecules using SERS from biofluid or physiological environments containing high concentration of salts, because the saline has a strong influence on the stability of both the metallic colloids and the biomolecules. Furthermore, the macromolecules such as proteins and DNAs in biofluid would block the interaction between the plasmonic substrate and small molecules. Therefore, it is highly desirable to develop a lab-on-chip device that can simultaneously perform on-chip chromatography to separate the small molecules and detect them in a label-free manner such as SERS.
In this study, we explore plasmonic NPs-decorated diatomite biosilica film as a lab-on-a-chip device for on-chip chromatography and label-free biosensing of small molecules from complex biological samples. Diatomite consists of fossilized remains of ancient diatoms and is a type of naturally abundant photonic crystal biosilica which has been widely used in industry as water filters, adsorbents, and medicine[22–24]. As geological deposits with billions of tons of reserve on earth, diatomite has similar properties to diatoms such as highly porous structure, excellent adsorption capacity, and photonic crystal effects [25, 26]. Most importantly, diatomite can be easily spin-coated on a substrate to form a dense film with extremely low cost. Different than our previous research focusing on the photonic crystal effect and microfluidic properties of individual diatom frustule, this paper utilizes the fluidic property of diatomite film decorated with gold nanoparticles (Au NPs), which can perform on-chip chromatography and simultaneously, serve as an ultra-sensitive SERS substrate to detect the target molecules. In this research, Phenethylamine (PEA) is chosen as the target analyte in our study. PEA and substituted PEAs are a broad class of compounds that affect the central nervous system. The phenethylamine derivatives are infrequently encountered by forensic toxicology laboratories. There have been increasing reports of the availability, distribution, and use of these compounds, which have caused attention by the U.S. Department of Justice[27, 28]. Herein, we used the hybrid plasmonic-diatomite biosilica as the matrix for on-chip chromatography and SERS substrate to separate and detect PEA from real biofluid. The diatomite on the chromatography plate not only functions as the stationary phase, but also provides additional Raman enhancement to improve the SERS sensitivity, resulting in more than 10× better LOD than commercial chromatography plates.
2. EXPERIMENTAL SECTION
2.1 Materials and reagents
Tetrachloroauric acid (HAuCl4) was purchased from Alfa Aesar. Trisodium citrate (Na3C6H5O7), anhydrous ethanol, ammonium hydroxide (NH4OH, 28%), ethyl hexane and acetate were purchased from Macron. Diatomite (Celite209), pyrene, 4-mercaptobenzoic acid (MBA), nile blue (NB), plasma and phenethylamine (PEA) were obtained from Sigma-Aldrich. Rhodamine6G (R6G) was purchased from TCI. The chemical reagents used were of analytical grade. Water used in all experiments was deionized and further purified by a Millipore Synergy UV Unit to a resistivity of ~ 18.2 MΩ cm.
2.2 Preparation and Characterization of Au NPs
The glassware used in the nanoparticle synthesis process was cleaned with aqua regia (HNO3/HCl, 1:3, v/v) followed by rinsing thoroughly with Milli-Q water. Au NPs with an average diameter of 60 nm were prepared using sodium citrate as the reducing and stabilizing agent according to the literature with little modification[29]. Briefly, a total of 100 mL of 1 mM chloroauric acid aqueous solution was heated to boil under vigorous stirring. After adding 4.2 mL of 1% trisodium citrate, the pale yellow solution turned fuchsia within several minutes. The colloids were kept under refluxing for another 20 min to ensure complete reduction of Au ions followed by cooling to room temperature.
2.3 Fabrication of diatomite biosilica chip
The diatomite chip for chromatography sensing were fabricated by spin coating diatomite on glass slides. The diatomite was dried at 1 °C for 6 h in an oven before spreading on the glass slides. After cooling to room temperature, 6 g of diatomite was first dispersed in 10 mL of 0.5% aqueous solution of carboxymethyl cellulose and then transferred onto the glass slide for spin coating at 1200 rpm for 20 seconds. The chips were placed in the shade to dry and then activated at 110 °C for 3 h to improve the adhesion of diatomite on glass slides.
2.4 On-chip chromatography method
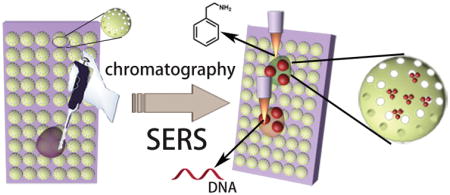
The on-chip chromatography SERS method was designed for detection of analytes from mixtures or biofluid as shown in Scheme 1. First, 1 μL liquid sample was spotted at 12 mm from the edge of the chromatography plate. After drying in air, the chromatography plate was kept in the glass chromatography development chamber with different types of mobile phase eluent. After separation of the analytes, the chromatography plates were then dried in the oven under 60 °C for 1 min. The separated analyte spots were marked under ultraviolet illumination at 380 nm wavelength and visualized by iodine colorimetry. The retention factor (Rf: equal to the ratio of the distance migrated by the target analyte and the solvent on the chromatography plate) of the analytes on chromatography plates were calculated and marked on the chromatography plates so that the analytes spots could be traced even when they are invisible at low concentrations. Then 2 μL concentrated Au NPs were added directly three times. A Horiba Jobin Yvon Lab Ram HR800 Raman microscope equipped with a CCD detector was used to acquire the SERS spectra, and a 50× objective lens was used to focus the laser onto the SERS substrates. The excitation wavelength was 785 nm, and the laser spot size was 2 μm in diameter. The confocal pinhole was set to a diameter of 200 μm. SERS mapping images were recorded with a 10 × 10-point mapping array. They were collected using the DuoScan module with a 2.0 μm step size, 0.5 s accumulation time, and collected in the Raman spectral range from 800 cm−1 to 1800 cm−1. The acquired data were processed with Horiba LabSpec 5 software.
Scheme 1.
Schematic representation of the on-chip chromatography-SERS detection of target molecules from mixtures based on plasmonic NPs-decorated diatomite biosilica
2.5 Other Instruments
UV-vis absorption spectra were recorded on NanoDrop 2000 UV-Vis spectrophotometer (Thermo Scientific) using a quartz cell of 1 cm optical path. Attenuated total reflectance (ATR) infrared spectra were recorded on a Nicolet 6700 Fourier transform infrared (FT-IR) spectrometer (Thermo Scientific) and Smart iTR diamond ATR accessory with liquid nitrogen-cooled MCT detector. Scanning electron microscopy (SEM) images were acquired on FEI Quanta 600 FEG SEM with 15–30 kV accelerating voltage. The microscopy images were acquired on the Horiba Jobin Yvon Lab Ram HR800 Raman microscope with 50× objective lens for thin layer on chromatography plate and 100× objective lens for near field image of single diatomite, halogen lamps were used as light source.
3. RESULTS AND DISCUSSION
3.1 Characterization and evaluation of SERS-active gold colloidal substrates
Scanning electron microscopy (SEM) and UV-vis absorption spectroscopy were employed to characterize the morphology and properties of the prepared gold colloidal nanoparticles. The SEM images (Figure S1) indicate that the Au NPs have a spherical shape with uniform size distribution and their diameters are estimated to be 60 nm. The SERS performance of prepared gold colloids was verified through the contrast of SERS spectrum of MBA solution, a typical Raman probe molecule (Figure S2). From the UV-vis spectrum (Figure S3), the LSPR band of the prepared Au colloids located at 545 nm with a narrow bandwidth. These values correspond to relatively uniform, mono-dispersed Au colloids with diameters of approximately 50–60 nm. The concentration of Au nanoparticles was calculated to be approximately 1 ×10⁻¹⁰ M, which is estimated using the basis of the Lambert’s law based on UV-vis spectroscopy (Figure S3) with a molar extinction coefficient of 3.4×10¹⁰ M−1 cm−1 [30].
3.2 Microstructures of the diatomite chromatography chip
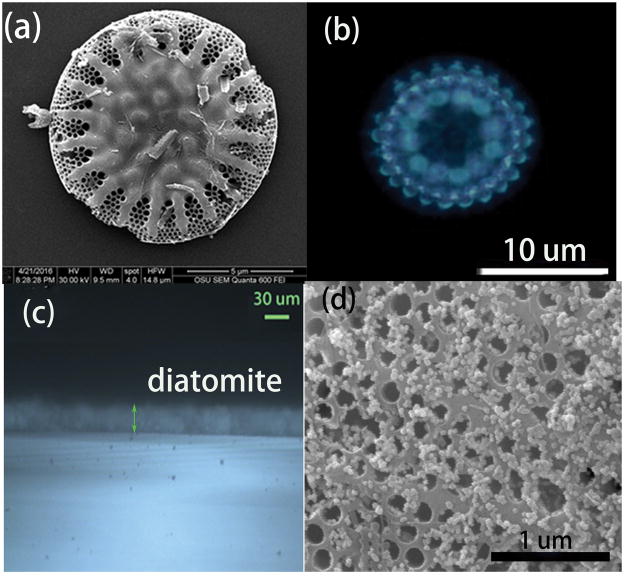
SEM was employed to characterize the morphology of the diatomite used in our experiment as shown in Figure 1. The main component of the commercial diatomite is disk-shaped with periodic pore structures (Figure 1. a). The size distribution of diatomite ranges from 10–30 μm. The diatomite is spin coated and works as the stationary phase on the chromatography plate. The SEM image of the diatomite layer on the glass substrate is shown in Figure S4. In order to verify the photonic crystal effect of diatomite, we took the optical image of a single diatom frustule from the diatomite, which is shown in Figure 1(b). The regular light pattern comes from the high order diffraction of the photonic crystal, which agrees with the results from another group [31]. Therefore we can conclude that diatomite does have photonic crystal effects, although not perfect. The thickness of the diatomite on glass is monitored by optical microscopy as shown in Figure 1c. The thickness of the diatomite is very uniform and measured to be 20 μm, which is much thinner than the commercial silica gel chromatography plate of 60–100 μm (Figure S5). After deposition of Au NPs onto chromatography plate, the NPs were distributed on the surface of diatomite as shown in Figure 1d.
Figure 1.
SEM image of the diatomite with honeycomb structure (a), optical image of a single diatom under the optical microscope, showing the diffraction pattern from the photonic crystal structure (b), the microscopy image of the cross section of the diatomite biosilica film (c) consisting of diatomite by spin coating, and the SEM image of the diatomite after Au NPs deposition (d).
3.3 SERS analysis of the chromatography plate
When collecting the SERS spectra of the analyte on chromatography plates, the background SERS signals originating from the blank stationary phase should be determined first. Therefore, it is necessary to investigate the SERS signals from different chromatography plate matrices. The measured results (Figure S6) indicate that both the diatomite and the silica gel chromatography plates exhibit a weak, broad spectral background, with no obvious Raman peaks. Thus it is conceivable to use these chromatography plates for SERS detection.
3.4 Effect of the colloidal gold concentration
The concentration of metallic colloids is of pivotal significance to the enhancement of Raman signals. SERS spectra of 100 ppm MBA on diatomite chromatography plates from 2 μL casted gold colloids with six different concentrations were collected. As shown in Figure S7 of the supporting information, the SERS spectrum intensity of MBA clearly increases as the colloidal gold concentration increases from 1 to 100 times. If the concentration increases more than 200 times, the measured SERS intensity will decrease. The explanation is that higher concentration of metallic nanoparticle colloids results in accretion of denser monolayer coverage, which increases the SERS signals. However, if the concentration exceeds the requirement of monolayer formation, multilayer nanoparticle accumulation leads to the reduction of SERS signals[21]. Therefore, 100 fold concentrated (1×10⁻⁸ M) gold colloids were chosen for subsequent measurements.
3.5 SERS of PAHs from mixtures
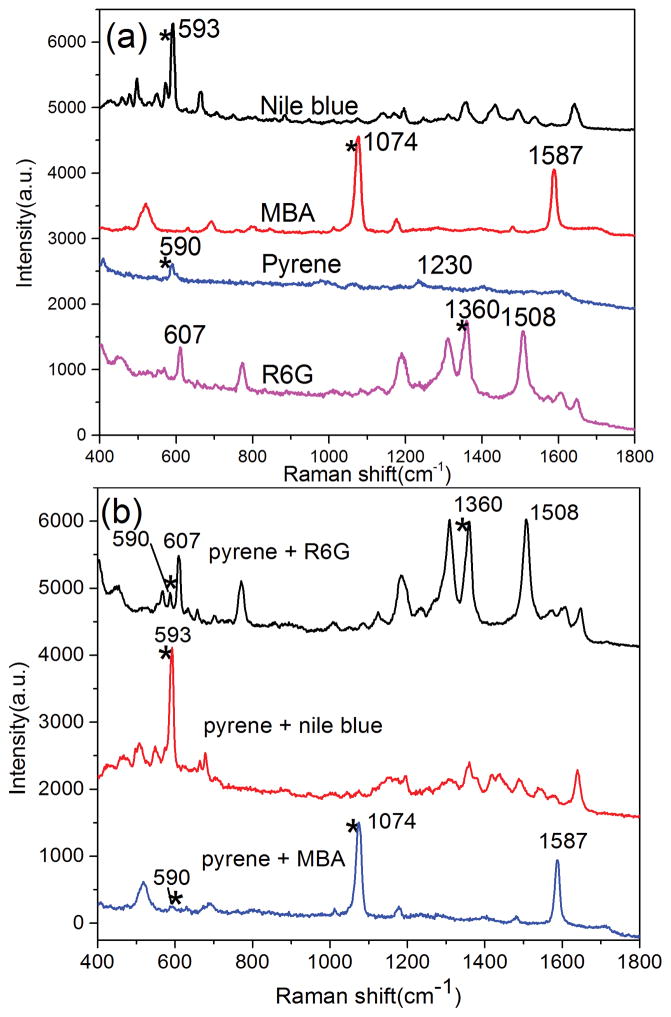
PAHs are a class of organic compounds consisting of two or more aromatic or heterocyclic rings. The detection of various PAHs has significant engineering potential as PAHs could pose a potential hazard to health in the environment. Unfortunately, the low binding affinity between PAHs and surfaces of metallic substrates prevents efficient SERS detection of PAHs from mixtures as the spectra from co-existing components interfere with the spectrum from the PAHs. In this work, pyrene was mixed with three Raman probe molecules (MBA, R6G and NB) respectively to form different mixtures. Figure 2a shows the SERS spectra of the pure substances. Specifically: pyrene, the peak at 590 cm−1 is assigned to the skeletal stretching vibration and 1230 cm−1 is associated with the C-C stretching/C-H in-plane bending of pyrene[32]; MBA, the peaks located at 1074 and 1587 cm−1 are associated with C-C ring-breathing modes of MBA[33]; R6G, the peak at 607 cm−1 is associated with C-C-C ring in plane vibrations, while the peaks at 1360 and 1508 cm−1 are associated with aromatic C-C stretching vibrations of R6G[34]; NB, the peak at 594 cm−1 is assigned to the in-plane deformation vibration of the NB. The peaks labeled with asterisks are used to represent the substances respectively. The SERS spectra of these three mixtures are shown in Figure 2b. For Mixture 1 (Pyrene and MBA 1/1), the metallic surface coverage was dominated by MBA because the covalent bonds can be formed easily between the Au NPs and mercapto group of MBA. Thus only a very weak Raman peak from pyrene was observed from the SERS spectra of mixture 1. For Mixture 2 (Pyrene and R6G 1/1), R6G is a typical Raman probe molecule because of its affinity with metallic surfaces and intense Raman signals. The in plane vibrations of R6G are located at 607 cm−1 are near main characteristic peak of pyrene and it is hard to distinguish the Raman peak of pyrene from the mixture due to the SERS signals from R6G. For Mixture 3 (Pyrene and R6G 1/1), NB is another kind of Raman probe molecule that is often used for evaluating the SERS performance of the substrates. The intense band located at 594 cm−1 is usually used as the characteristic peak of NB in detection, which overlaps with the main characteristic peak of pyrene. Therefore, only molecule information of NB can be observed from the SERS spectra of mixture 3.
Figure 2.
SERS spectra of pure substance of Nile blue, MBA, pyrene and R6G (a) and the corresponding mixture (b)
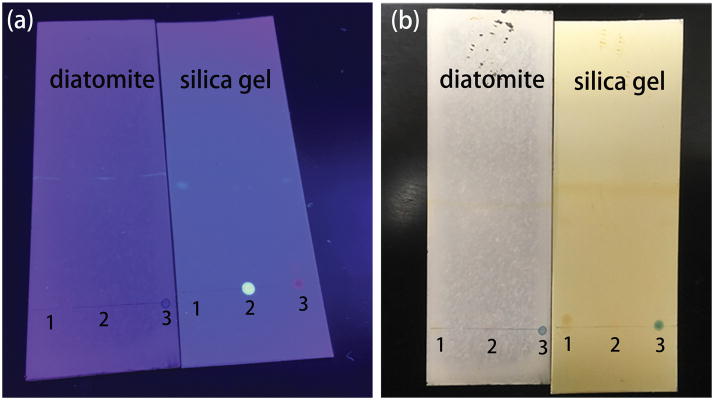
The chromatography performance of the diatomite and commercial silica gel chromatography plates was evaluated using the aforementioned three mixtures. Hexane and ethyl acetate (v/v = 3:1) were used as the eluent for the separation of pyrene from the mixtures. After separation, a UV lamp and iodine colorimetry was used to detect different analyte spots corresponding to various substances as illustrated in Figure 3. Pyrene traveled at faster speeds and located further from the original dropping points because of the low molecular polarity. Three different types of mixtures have been successfully separated as shown in Figure 3. The Rf values of the mixing points were obtained by the UV light scanner and iodine colorimetric, which are 0/0.8 on silica gel plate and 0/0.9 on diatomite plate. The separation efficiency of silica gel and diatomite chromatography is similar to each other in our experiment from the measured Rf. The diatomite plates show a slightly better separation effect than commercial chromatography plates. The SERS spectra at different spots were measured on the diatomite plate after the chromatography separation as shown in Figure 4. The characteristic peaks of pyrene at 590 cm−1 and 1230 cm−1 are clearly observed, which means that the diatomite plate can successfully be used as the matrix for on-chip Chromatography-SERS method. In this study, the repeatability of the device was also studied by measuring 5 random spots on 8 different chips using 200 ppm of pyrene solution as shown in Figure S8. The relative standard deviation (RSD) of the intensity of the Raman peak at 590 cm−1 is calculated to be 5% from spot-to-spot on each chip. The RSD from chip-to-chip is only 3.5%. Therefore we conclude that the repeatibility of the on-chip chromatography-SERS sensors is comparable with other SERS techniques [35].
Figure 3.
Photographic images of the mixtures (1: pyrene and MBA, 2: pyrene and R6G, 3: pyrene and Nile blue) separated by diatomite biosilica and silica chromatography plates. The spots after separation are visualized with UV light (a) and iodine colorimetry (b).
Fig. 4.
SERS spectra of the substances in the mixtures after separation through diatomite biosilica film.
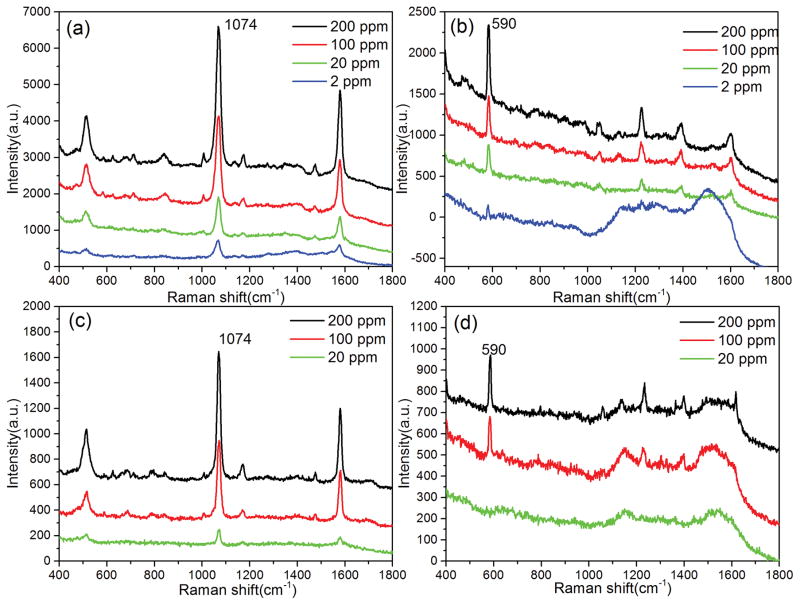
We compared the SERS spectra obtained from the diatomite plate (Figure 5a, b) with commercial silica-gel chromatography plate (Figure 5c, d). In Figure 5, all the characteristic bands of MBA and pyrene exhibited monotonous decreasement in intensity as the mixture concentration decreases. The lowest detection limit from pyrene/MBA mixture is between 20 and 100 ppm on the commercial chromatography plate, and below 2 ppm on the diatomite chromatography plate. The experimental results demonstrate more than 10 times improvement of sensitivity using the diatomite-based chromatography plate compared to commercial silica-gel chromatography plates. We attribute this improvement to two contributions from the diatomite plate. First, in our on-chip chromatography-SERS method, the metallic nanoparticles are casted onto the analyte spots after chromatography separation. The SERS spectra collected from each spot will only come from the target molecules at the surface of the chromatography plate. This means that the overall sensitivity will be compromised because a significant portion of the analyte inside the chromatography plates cannot be detected. The thickness of the diatomite chromatography plates fabricated by spin coating is around 20 μm, which is only one third of the thickness of the commercial silica-gel chromatography plate. The thinner diatomite layer will achieve higher analyte concentration at the surface of the chromatography plate. Second, diatomite consists of fossilized remains of diatoms. The two dimensional (2-D) periodic pores on diatomite disk possess hierarchical nanoscale photonic crystal features[7, 36]. The hybrid photonic-plasmonic modes are formed when Au NPs are deposited onto the surface of diatomite, which will further increase the local optical field of Au NPs. Additional SERS enhancement can be obtained, similar to our previous work on diatoms biosilica through theoretical calculation and experimental characterization [14, 15]. The ppm level sensitivity that we achieved is comparable with other very advanced platforms developed by Lu and Zhao’s groups [37, 38], which require complicate and expesnive fabrication processes such as oblique angle deposition and molecularly imprinted technology.
Figure 5.
SERS spectra of mixture 1 at different concentrations separated by diatomite (a, b) and silica gel (c, d) chromatography plates.
3.6 Optical simulation of plasmonic NPs on diatomite
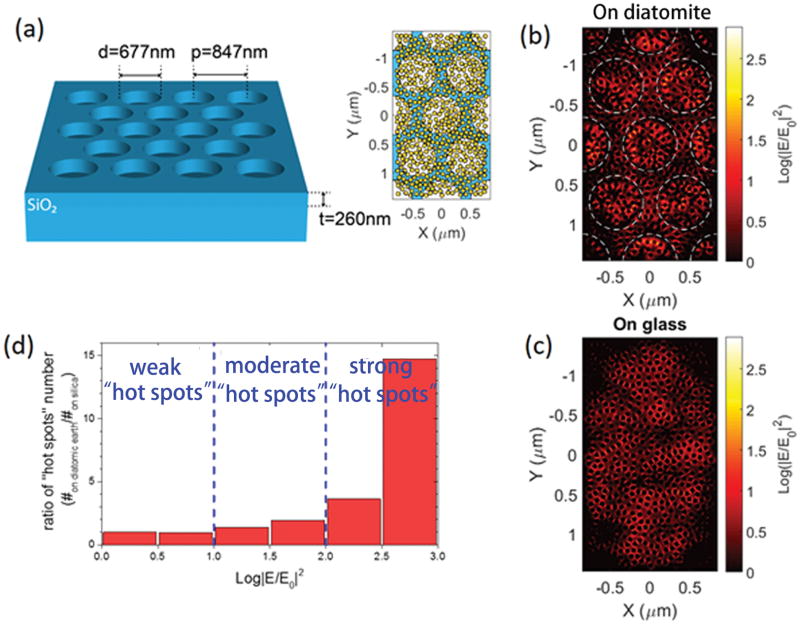
To investigate the photonic property of diatomite and its contribution to the SERS signals, we used FullWAVE module from Rsoft photonic component design suite, which is based on three-dimensional (3D) finite-difference time-domain (FDTD) algorithm. According to the SEM image, we modeled the diatomite substrate as a 2-D photonic crystal silica slab with a hexagonal lattice of air holes. As nature created diatomite consists of mixed diatom species with various photonic crystal periods, we only consider the periodic photonic structure that can provide the largest SERS signal enhancement in our simulation, which means that the guided mode resonance (GMR) peak wavelength of the photonic crystal structure matches the wavelength of the excitation light[14]. Figure 6(a) plots the schematic of the diatomite substrate with labeled structure parameters. The hybrid plasmonic-photonic crystal nanostructure was achieved by integrating randomly distributed Au nanoparticles (NPs) on the diatomite substrate as shown in the inset of Figure 6(a). The diameter of the Au NPs is 70 nm and the minimum gap width between the Au NPs is 5 nm, which match the experiment condition. The inset of Figure 6(a) also indicates the simulation domain of our FDTD calculation. We use periodic boundary condition in the horizontal direction (X-Y plane) in order to excite the GMRs. A mesh size of 2.5 nm is used, which is small enough to qualitatively characterize the electrical field “hot spots” generated by localized surface plasmonic resonances (LSPR) between the Au NPs’ gap. To compare the contribution of diatomite, the same distribution of Au NPs is placed on a flat silica substrate as reference. The excitation was a 785 nm plane wave. Both TE and TM polarized incident light was simulated, and the simulation results were based on equal average of both polarizations. We know that the SERS enhancement factor (EF) is proportional to the four power of the local electrical field[39]. However, in reality, the measured SERS EF varies from the analyte concentration and even the analyte molecule distribution in the case of low concentration. To simplify the analysis, we only focus on the optical properties of the diatiomic earth chromatography plate. So we use the normalized electric field intensity as the main parameter in the following discussion, which is defined as |ETE/E0|2/2+|ETM/E0|2/2, where ETE and ETM corresponds to the amplitude of the local electrical field under TE and TM polarized incident light and E0 is the amplitude of the incident light. Figure 6(b) and (c) the electric field intensity distribution of the Au NPs layer. The value was averaged over the vertical direction. Since photonic crystal structure supports GMRs, which increases the local electrical field intensity, the electrical field “hot spots” generated LSPR from Au NPs are coupled with the GMRs when Au NPs are placed inside the air holes. As a result, we can see that the E4-EF of many “hot spots” inside the air holes are enhanced. To quantitatively describe the enhancement effect, we count the “hot spots” statistical distribution over the electric field intensity of both the diatomite substrate and the reference substrate. Figure 6(d) plots the enhancement ratio between the two distributions on different substrates, which is defined as (#on diatiomite/# on silica), where #on diatomite/silica means the number of “hot spots” at each intensity level on the diatomite/silica substrate. We can group the “hot spots” into different levels according to their electric field intensity, as is shown in Figure 6(d). Clearly, both the intensity and the density of “hot spots” are enhanced by the coupling between LSPRs and GMRs. The enhancement ratio increases as the “hot spots” intensity increases. For example, enhancement raito of strong “hot spots” of which the electric field intensity is larger 102.5 more than 14 times. And these strong “hot spots” are crucial to detect low analyte molecules. To conclude, diatomite substrate with Au NPs can increase the SERS sensitivity and detection limit due to the coupling between LSPRs of Au NPs and GMR effect of the periodic diatomite structure.
Figure 6.
(a) Schematic of the simulation model for diatomite substrate. Inset: randomly distributed Au NPs on diatomite. The white background represents the place where the Au NPs are placed in the air holes on the bottom silica substrate, and the blue background means where the Au NPs are placed on the top surface of the silica photonic crystal slab. For the reference silica substrate, all the Au NPs are on the substrate surface. Electric field intensity distribution of the Au NPs layer on a diatomite substrate (b) and on a silica substrate (c). (d) enhancement ratio of the “hot spots” distribution over electric field intensity, which is defined as the ratio of numbers of “hot spots” at each intensity level.
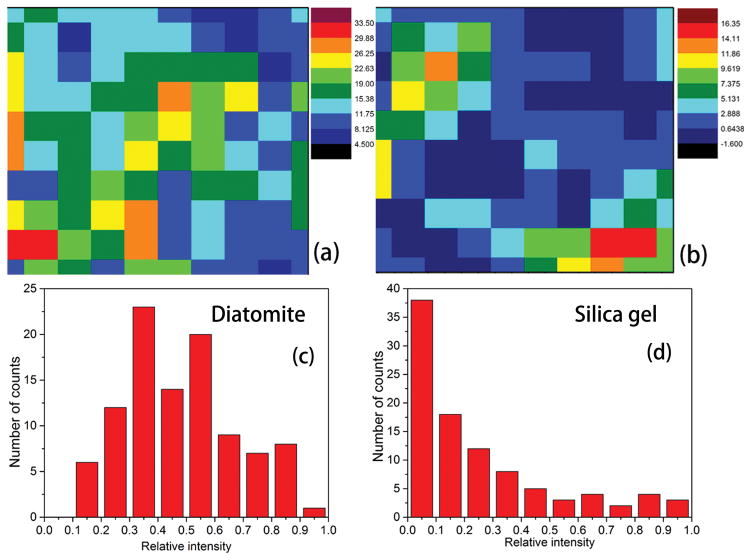
Mapping images of the Raman signals visualized the distribution of analytes on the chromatography plate. The SERS mapping image of 10 ppm pure MBA on the diatomite chromatography plate as well as the silica gel chromatography plate are shown in Figure 7a and b. MBA provides an intense Raman peak at 1074 cm−1, which is assigned to the ring-breathing modes. The SERS mapping image was recorded using the integrated peak intensity at 1060–1090 cm−1. Diatomite chromatography plate showed a much stronger and more uniform SERS signals of MBA than the silica gel chromatography plate. The intensity distribution in the mapping area is shown in Figure 7(c) and (d). Low variability is observed on diatomite plate, in which the coefficient of variation (CV) is 0.39, and is almost 1.0 on silica gel plate. The highly porous structure and more uniform pore size of the diatomite has lower flow resistance[40], which enables more homogenous liquid flows into the pore on diatomite. Therefore, the eluent migrates smoothly and uniformly on the surface of the stationary phase during the chromatography development. For the commercial silica gel chromatography plate we used, the liquid flow mainly passes through the big particle gaps of the silica gel, and the analyte molecules located mainly in the inter-particle regions. Thus the distribution of the analytes on the diatomite plate is more uniform compared with that on the silica gel plate.
Figure 7.
Raman mapping images of MBA(10ppm) on (a) diatomite (CV ~ 0.39) and (b) silica gel (CV ~ 1) chromatography plates and the relative intensity distributions of representative chromatography plates (c) and (d).
3.7 SERS of PEA from biofluid
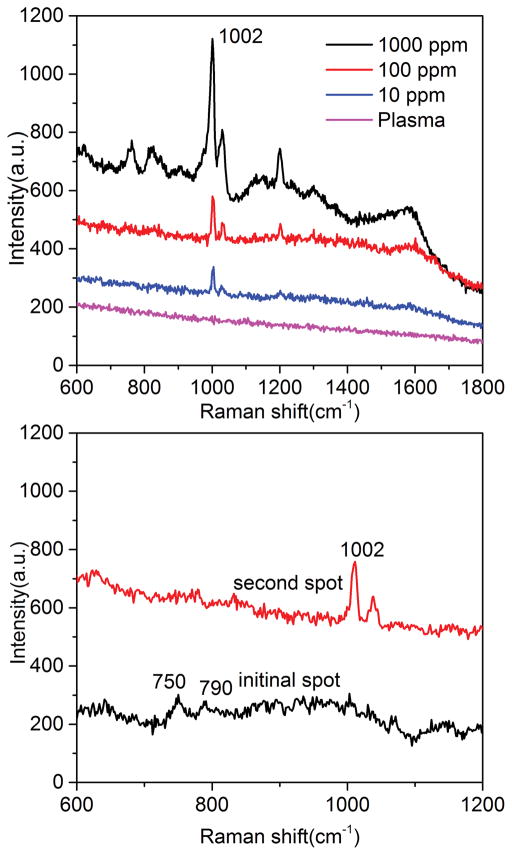
There have been very few reports to detect analytes in biofluid using SERS because biofluid is complex and the high saline concentration makes metallic colloids unstable. Here we used this on-chip Chromatography-SERS method for on-site detection of biogenic amines from plasma. Ammonium hydroxide and ethanol (v/v = 1:1) were used as the eluent for the separation of PEA from plasma. The biomolecules such as albumin in plasma cannot diffuse on the chromatography plate due to the high molecular weight. We compared the SERS spectra obtained from diatomite plate Figure 8 and commercial silica-gel chromatography plate (Figure S9). The Raman peak at 1002 cm−1 was assigned to the phenyl ring breathing vibration of PEA. The lowest detection limit for PEA/plasma was 10 ppm on the diatomite chromatography plate. As a comparison, there were no detectable SERS signals of PEA on the silica gel chromatography plate even when the concentration of PEA is 100 ppm. The experimental results demonstrate more than 10 times improvement of LOD using the diatomite-based chromatography plate over the commercial silica-gel chromatography plate. It is difficult to obtain SERS signals of proteins that have no conjugated chromophore[41]. FT-IR was used to verify the protein in plasma during the chromatography process (Figure S10). The peaks at 1645 cm−1 and 1540 cm−1 are assigned to amide I and amide II bands of protein in plasma, and the peak at 1585 was assigned to C=C stretching vibration of PEA. To further demonstrate the multiplex sensing capabilities of on-chip Chromatography-SERS, miR21cDNA was added into the plasma (5×10⁻⁶ M). SERS spectra of DNA was observed at the initial spot after the chromatography separation as shown in Figure 8b, and the peak at 750 and 790 cm−1 were assigned to the ring breathing modes of thymine[42] and cytosine[43], respectively. This also verifies that DNA has a very small retention factor and almost does not migrate on the chromatography plate.
Figure 8.
SERS spectra of human plasma with different concentrations of PEA separated by diatomite chromatography plates (a) and with DNA added (b)
4. CONCLUSIONS
In this study, we demonstrated plasmonic NPs-decorated diatomite biosilica as a lab-on-a-chip device for on-chip chromatography and label-free SERS sensing to detect small molecules from complex biological samples. The experimental results achieved a detection sensitivity down to 1 ppm, an improvement of more than 10 times when compared to the commercial silica-gel chromatography plate. To the best of our knowledge, this is the first time demonstrating separation and detection of target molecules from biofluids by on-chip chromatography-SERS techniques. To demonstrate the significant engineering potentials for biomedical sensing, we have achieved multiplex sensing of PEA and DNA in human plasma with LOD of 10 ppm and 5 μM respectively simultaneously. This facile lab-on-chip device using hybrid plasmonic-diatomite biosilica proves itself to be cost-effective and ultra-sensitive with multiplex sensing capabilities, which will play pivotal roles for the monitoring of pollutants and toxins in complex environments and screening illicit drugs in biofluid.
Supplementary Material
Figure S1: SEM image of the prepared Au colloids
Figure S2 Raman spectra of 4-mercaptobenzoic acid (MBA, 10 ppm) with and without Au colloids
Figure S3. The UV-Vis absorption spectrum of the prepared Au colloids
Figure S4. SEM image of the surface of the diatomite biosilica film
Figure S5. Microscopic image of the cross section of commercial silica gel chromatography plate
Figure S6. Raman spectrum of the diatomite based chromatography plate
Figure S7. SERS spectrums of MBA (100 ppm) on diatomite-based chromatography plate with different concentrations of Au colloids (a) and the dependence of the intensity of the Raman peak at 1074 cm−1 acquired from the SERS spectra (b)
Figure S8. The peak intensity at 590 cm−1 of 200 ppm pyrene versus the different analyzed spots from different diatomite chips
Figure S9. SERS spectra of plasma with 100 ppm PEA separated by commercial silica-gel chromatography plate
Figure S10. FTIR spectra from different spots on diatomite chromatography plate after the separation of human plasma sample
Acknowledgments
The authors would like to acknowledge the support from the National Institutes of Health under Grant No. 1R03EB018893 and the Oregon State University Venture Development Fund.
Footnotes
Additional supporting information may be found in the online version of this article at the publisher’s website.
References
- 1.Yang W, Lopez PJ, Rosengarten G. Analyst. 2011;136:42. doi: 10.1039/c0an00602e. [DOI] [PubMed] [Google Scholar]
- 2.Losic D, Rosengarten G, Mitchell JG, Voelcker NH. Journal of nanoscience and nanotechnology. 2006;6:982. doi: 10.1166/jnn.2006.174. [DOI] [PubMed] [Google Scholar]
- 3.Brunner E, Gröger C, Lutz K, Richthammer P, Spinde K, Sumper M. Applied microbiology and biotechnology. 2009;84:607. doi: 10.1007/s00253-009-2140-3. [DOI] [PubMed] [Google Scholar]
- 4.Round FE, Crawford RM, Mann DG. Cambridge University Press; 1990. [Google Scholar]
- 5.Gordon R, Losic D, Tiffany MA, Nagy SS, Sterrenburg FA. Trends in biotechnology. 2009;27:116. doi: 10.1016/j.tibtech.2008.11.003. [DOI] [PubMed] [Google Scholar]
- 6.Chen X, Ostadi H, Jiang K. Analytical biochemistry. 2010;403:63. doi: 10.1016/j.ab.2010.04.003. [DOI] [PubMed] [Google Scholar]
- 7.De Stefano L, Maddalena P, Moretti L, Rea I, Rendina I, De Tommasi E, Mocella V, De Stefano M. Superlattices and Microstructures. 2009;46:84. [Google Scholar]
- 8.Kong X, Xi Y, LeDuff P, Li E, Liu Y, Cheng LJ, Rorrer GL, Tan H, Wang AX. Nanoscale. 2016;8:17285. doi: 10.1039/c6nr05809d. [DOI] [PMC free article] [PubMed] [Google Scholar]
- 9.Losic D, Mitchell JG, Voelcker NH. Advanced Materials. 2009;21:2947. [Google Scholar]
- 10.Wang Y, Cai J, Jiang Y, Jiang X, Zhang D. Applied microbiology and biotechnology. 2013;97:453. doi: 10.1007/s00253-012-4568-0. [DOI] [PubMed] [Google Scholar]
- 11.Leonardo S, Prieto-Simón B, Campàs M. TrAC Trends in Analytical Chemistry. 2016;79:276. [Google Scholar]
- 12.Zhen L, Ford N, Gale DK, Roesijadi G, Rorrer GL. Biosensors and Bioelectronics. 2016;79:742. doi: 10.1016/j.bios.2016.01.002. [DOI] [PubMed] [Google Scholar]
- 13.De Stefano L, Rotiroti L, De Stefano M, Lamberti A, Lettieri S, Setaro A, Maddalena P. Biosensors and Bioelectronics. 2009;24:1580. doi: 10.1016/j.bios.2008.08.016. [DOI] [PubMed] [Google Scholar]
- 14.Ren F, Campbell J, Wang X, Rorrer GL, Wang AX. Optics express. 2013;21:15308. doi: 10.1364/OE.21.015308. [DOI] [PubMed] [Google Scholar]
- 15.Ren F, Campbell J, Rorrer GL, Wang AX. Selected Topics in Quantum Electronics. IEEE Journal of. 2014;20:127. doi: 10.1109/JSTQE.2014.2301016. [DOI] [PMC free article] [PubMed] [Google Scholar]
- 16.Kong X, Xi Y, Le Duff P, Chong X, Li E, Ren F, Rorrer GL, Wang AX. Biosensors and Bioelectronics. 2017;88:63. doi: 10.1016/j.bios.2016.07.062. [DOI] [PMC free article] [PubMed] [Google Scholar]
- 17.Yang J, Zhen L, Ren F, Campbell J, Rorrer GL, Wang AX. Journal of biophotonics. 2015;8:659. doi: 10.1002/jbio.201400070. [DOI] [PMC free article] [PubMed] [Google Scholar]
- 18.Fleischmann M, Hendra PJ, McQuillan AJ. Chemical Physics Letters. 1974;26:163. [Google Scholar]
- 19.Jahn M, Patze S, Bocklitz T, Weber K, Cialla-May D, Popp J. Analytica chimica acta. 2015;860:43. doi: 10.1016/j.aca.2015.01.005. [DOI] [PubMed] [Google Scholar]
- 20.Hargreaves MD, Page K, Munshi T, Tomsett R, Lynch G, Edwards HG. Journal of Raman Spectroscopy. 2008;39:873. [Google Scholar]
- 21.Li D, Qu L, Zhai W, Xue J, Fossey JS, Long Y. Environmental science & technology. 2011;45:4046. doi: 10.1021/es104155r. [DOI] [PubMed] [Google Scholar]
- 22.Chu H, Cao D, Dong B, Qiang Z. Water research. 2010;44:1573. doi: 10.1016/j.watres.2009.11.006. [DOI] [PubMed] [Google Scholar]
- 23.Al-Ghouti M, Khraisheh M, Allen S, Ahmad M. Journal of Environmental Management. 2003;69:229. doi: 10.1016/j.jenvman.2003.09.005. [DOI] [PubMed] [Google Scholar]
- 24.Aw MS, Simovic S, Yu Y, Addai-Mensah J, Losic D. Powder technology. 2012;223:52. [Google Scholar]
- 25.Shawabkeh RA, Tutunji MF. Applied Clay Science. 2003;24:111. [Google Scholar]
- 26.Hadjar H, Hamdi B, Jaber M, Brendlé J, Kessaissia Z, Balard H, Donnet JB. Microporous and Mesoporous Materials. 2008;107:219. [Google Scholar]
- 27.Vorce SP, Sklerov JH. Journal of analytical toxicology. 2004;28:407. doi: 10.1093/jat/28.6.407. [DOI] [PubMed] [Google Scholar]
- 28.Taplin F, O’Donnell D, Kubic T, Leona M, Lombardi J. Applied spectroscopy. 2013;67:1150. doi: 10.1366/13-06990. [DOI] [PubMed] [Google Scholar]
- 29.Grabar KC, Freeman RG, Hommer MB, Natan MJ. Analytical chemistry. 1995;67:735. [Google Scholar]
- 30.Navarro JR, Werts MH. Analyst. 2013;138:583. doi: 10.1039/c2an36135c. [DOI] [PubMed] [Google Scholar]
- 31.De Tommasi E, Rea I, Mocella V, Moretti L, De Stefano M, Rendina I, De Stefano L. Optics express. 2010;18:12203. doi: 10.1364/OE.18.012203. [DOI] [PubMed] [Google Scholar]
- 32.Xie Y, Wang X, Han X, Xue X, Ji W, Qi Z, Liu J, Zhao B, Ozaki Y. Analyst. 2010;135:1389. doi: 10.1039/c0an00076k. [DOI] [PubMed] [Google Scholar]
- 33.Orendorff CJ, Gole A, Sau TK, Murphy CJ. Analytical chemistry. 2005;77:3261. doi: 10.1021/ac048176x. [DOI] [PubMed] [Google Scholar]
- 34.Kong XM, Reza M, Ma YB, Hinestroza JP, Ahvenniemi E, Vuorinen T. Cellulose. 2015;22:3645. [Google Scholar]
- 35.Gong Z, Du H, Cheng F, Wang C, Wang C, Fan M. ACS applied materials & interfaces. 2014;6:21931. doi: 10.1021/am507424v. [DOI] [PubMed] [Google Scholar]
- 36.Fuhrmann T, Landwehr S, El Rharbi-Kucki M, Sumper M. Applied Physics B. 2004;78:257. [Google Scholar]
- 37.Gao F, Hu Y, Chen D, Li-Chan EC, Grant E, Lu X. Talanta. 2015;143:344. doi: 10.1016/j.talanta.2015.05.003. [DOI] [PubMed] [Google Scholar]
- 38.Chen J, Huang Y-w, Zhao Y. Journal of Materials Chemistry B. 2015;3:1898. doi: 10.1039/c4tb01632g. [DOI] [PubMed] [Google Scholar]
- 39.Stiles PL, Dieringer JA, Shah NC, Van Duyne RP. Annu Rev Anal Chem. 2008;1:601. doi: 10.1146/annurev.anchem.1.031207.112814. [DOI] [PubMed] [Google Scholar]
- 40.Tennikov MB, Gazdina NV, Tennikova TB, Svec F. Journal of Chromatography A. 1998;798:55. doi: 10.1016/s0021-9673(97)00873-x. [DOI] [PubMed] [Google Scholar]
- 41.Han XX, Huang GG, Zhao B, Ozaki Y. Analytical chemistry. 2009;81:3329. doi: 10.1021/ac900395x. [DOI] [PubMed] [Google Scholar]
- 42.Xu LJ, Lei ZC, Li J, Zong C, Yang CJ, Ren B. Journal of the American Chemical Society. 2015;137:5149. doi: 10.1021/jacs.5b01426. [DOI] [PubMed] [Google Scholar]
- 43.Kong X, Yu Q, Lv Z, Du X, Vuorinen T. Chemical Communications. 2013;49:8680. doi: 10.1039/c3cc43902j. [DOI] [PubMed] [Google Scholar]
Associated Data
This section collects any data citations, data availability statements, or supplementary materials included in this article.
Supplementary Materials
Figure S1: SEM image of the prepared Au colloids
Figure S2 Raman spectra of 4-mercaptobenzoic acid (MBA, 10 ppm) with and without Au colloids
Figure S3. The UV-Vis absorption spectrum of the prepared Au colloids
Figure S4. SEM image of the surface of the diatomite biosilica film
Figure S5. Microscopic image of the cross section of commercial silica gel chromatography plate
Figure S6. Raman spectrum of the diatomite based chromatography plate
Figure S7. SERS spectrums of MBA (100 ppm) on diatomite-based chromatography plate with different concentrations of Au colloids (a) and the dependence of the intensity of the Raman peak at 1074 cm−1 acquired from the SERS spectra (b)
Figure S8. The peak intensity at 590 cm−1 of 200 ppm pyrene versus the different analyzed spots from different diatomite chips
Figure S9. SERS spectra of plasma with 100 ppm PEA separated by commercial silica-gel chromatography plate
Figure S10. FTIR spectra from different spots on diatomite chromatography plate after the separation of human plasma sample


