

Abstract
Short tandem repeats (STRs) are hyper-mutable sequences in the human genome. They are often used in forensics and population genetics and are also the underlying cause of many genetic diseases. There are challenges associated with accurately determining the length polymorphism of STR loci in the genome by next-generation sequencing (NGS). In particular, accurate detection of pathological STR expansion is limited by the sequence read length during whole-genome analysis. We developed TREDPARSE, a software package that incorporates various cues from read alignment and paired-end distance distribution, as well as a sequence stutter model, in a probabilistic framework to infer repeat sizes for genetic loci, and we used this software to infer repeat sizes for 30 known disease loci. Using simulated data, we show that TREDPARSE outperforms other available software. We sampled the full genome sequences of 12,632 individuals to an average read depth of approximately 30× to 40× with Illumina HiSeq X. We identified 138 individuals with risk alleles at 15 STR disease loci. We validated a representative subset of the samples (n = 19) by Sanger and by Oxford Nanopore sequencing. Additionally, we validated the STR calls against known allele sizes in a set of GeT-RM reference cell-line materials (n = 6). Several STR loci that are entirely guanine or cytosines (G or C) have insufficient read evidence for inference and therefore could not be assayed precisely by TREDPARSE. TREDPARSE extends the limit of STR size detection beyond the physical sequence read length. This extension is critical because many of the disease risk cutoffs are close to or beyond the short sequence read length of 100 to 150 bases.
Keywords: microsatellites, short tandem repeats, genotyping, genome sequencing, trinucleotide repeat expansion, genetic disorder, population genetics
Introduction
Microsatellites, or short tandem repeats (STRs), are stretches of simple nucleotide repetitions in the genome; typical repeat units are 1–6 bp in length. Short tandem repeats are often polymorphic as a result of strand slippage during DNA replication and are a common source of rare genetic diseases.1 The mutation rates of STRs are typically on the order of ∼10−4 mutations per generation per site,2 as compared to point mutation rates, which are on the order of ∼10−8 mutations per generation per site for single-nucleotide variants (SNVs).3 Because of the higher mutation rate, STRs offer a different level of resolution at which to study kinship and trait variations among individuals.
STRs are currently used in forensics to identify suspects from DNA traces left at a crime scene. The amplification targets the 13 CODIS (Combined DNA Index System)4 STR loci, and the sizes of the amplicons are analyzed by electroporesis. The repeat number at each loci is inferred from the size of the amplicon, and a DNA profile is generated. STRs also have a role in revealing genealogy. For example, STR loci on the Y chromosomes (Y-STRs) are used for defining haplotypes that predated the use of Y-SNPs. The STR data, coupled with public genealogy databases such as Y-search, can be used for “surname inference.”5
STRs have been shown to be involved in several human genetic diseases.6 Several neural-degenerative disorders, known as the “polyglutamine” (PolyQ) diseases, are caused by variable stretches of the repeated trinucleotide CAG within protein-coding exons. Examples of PolyQ diseases are Huntington disease (HD [MIM: 143100]) and several forms of spinocerebellar ataxia (SCA). Huntington disease is caused by an expansion of the CAG repeats in the first exon of the Huntingtin gene (HTT [MIM: 613004]). Individuals carrying an expanded allele have motor, cognitive, and psychological symptoms that typically appear at the age of 40 years old or older, depending on the number of repeats.
STRs also occur in non-coding regions and can regulate gene expression and histone modifications, affecting the expression of nearby genes in cis to the STR sites.7 Examples of these repeat disorders include Myotonic dystrophy (DM1 [MIM: 160900]), caused by CTG repeats; Friedreich Ataxia (FRDA [MIM: 229300]), caused by GAA repeats; and Fragile X syndrome (FXS [MIM: 300624]), caused by CGG repeats. STRs that regulate gene expression (e-STRs) are mostly enriched in genes responsible for cognitive functions and autoimmune responses.8
Whole-genome-scale analysis of human STR variation in the presumably healthy 1000 Genomes Project individuals suggests potential contributions of STRs to more complex traits.8 Because most of these diseases are in the form of tri-nucleotide repeats, they are termed tri-nucleotide-repeat diseases (TREDs). Additionally, STR mutations are known to be associated with susceptibility to cancer.9 Microsatellite instability is also a well-known hypermutability event that results from impaired DNA mismatch repair, as often occurs in colorectal and gastric cancer.10
Most STR loci are not usually included in routine analyses of the genetics of traits and diseases. Consequently, STRs might contribute to the “missing heritability” of complex diseases and traits.11 One critical bottleneck in assaying STR loci by conventional experimental approaches is a dependency on targeting predefined sites for amplification and subsequently directly sequencing or measuring the size of the amplicons. Large-scale experimental assays are limited because it is difficult to measure multiplex loci within the same assay. Loci might also fail to amplify if they are highly expanded or if there are additional variants on the flanking regions. With whole-genome shotgun sequencing (WGS), it is now possible to type many STR loci on the basis of a single comprehensive sequencing run without the need to design separate genetic assays.
Using WGS, one can use the sequencing reads that map to STR loci to predict allele lengths. Variant calling software (for example,12, 13) can identify some short indels in reads that span STRs. Other tools seek to identify STR variants by specifically examining the sequencing reads that are piled around a target STR region.14, 15 A popular caller, lobSTR, uses three separate steps: sensing, alignment, and allelotyping, which explicitly model two possible alleles (diploid) as well as sequencing errors typically associated with STRs (because of stutter noise).15 However, lobSTR only considers reads that fully span an STR locus. Owing to the short length of Illumina reads (100–150 bases), this imposes a major limitation on the length of STR alleles that can be identified. A more recently developed STR caller, ExpansionHunter, incorporates additional evidence beyond spanning reads.16
It is also possible to estimate length variation at an STR by combining information from a prior estimate and the observed sizes of paired-end sequence fragments spanning the STR, as in STRViper.14 However, STRViper assumes a single allele at each site, and this approach is inadequate for diploid human calls. Using long sequence reads such as PacBio17 or Oxford Nanopore (ONP)18, 19 could potentially help to increase both the precision and the range of detectable variants.20, 21 However, the per-base cost of the long-read technologies is greater than for short-read technologies for whole-genome sequencing, limiting its widespread use for typing STRs. Indeed, few human genomes have been sequenced with PacBio or ONP because of the prohibitive costs associated with long-read sequencing platforms.
Despite recent progress,14, 15, 20 high-throughput genotyping of STRs remains limited as a result of low effective coverage, sequencing stutters, and a lack of robust models with which to perform both haploid and diploid calls while distinguishing true variation from technical artifacts.11 We built TREDPARSE to assess multiple sequence signatures suggested or implemented by previous methods.14, 15, 20 Our testing on both simulated datasets, and more than 10,000 sequenced full human genomes,22 demonstrates that TREDPARSE yields highly accurate typing of many disease-related STRs.
Material and Methods
TREDPARSE Overview
The goal of TREDPARSE is to identify each allele length at pre-defined STR loci by using Illumina WGS sequence data that are sampled at sufficient depth (discussion on the sequencing depth is provided in later sections). Given a set of observed reads that are mapped around a particular STR locus, our goal is to estimate up to two haplotypes and , where , that represent the number of an individual’s repeat units that maximize the likelihood in our model.
The TREDPARSE workflow involves a number of key steps—ploidy inference for a given locus, realignment of reads near the STR region, classification of the reads into four key types of evidence, and the deployment of a full probabilistic framework (Figure 1). The input for the workflow is typically a BAM file that contains mapped WGS reads, and the output is the maximum-likelihood size estimates, distributrions over the number of repeats, and the associated probability of having each of the 30 STR-related diseases. The full probabilistic model is partitioned into four major sources of evidence, which are considered together. Consequently, we seek to find the maximum-likelihood estimate for likelihood function .
Figure 1.
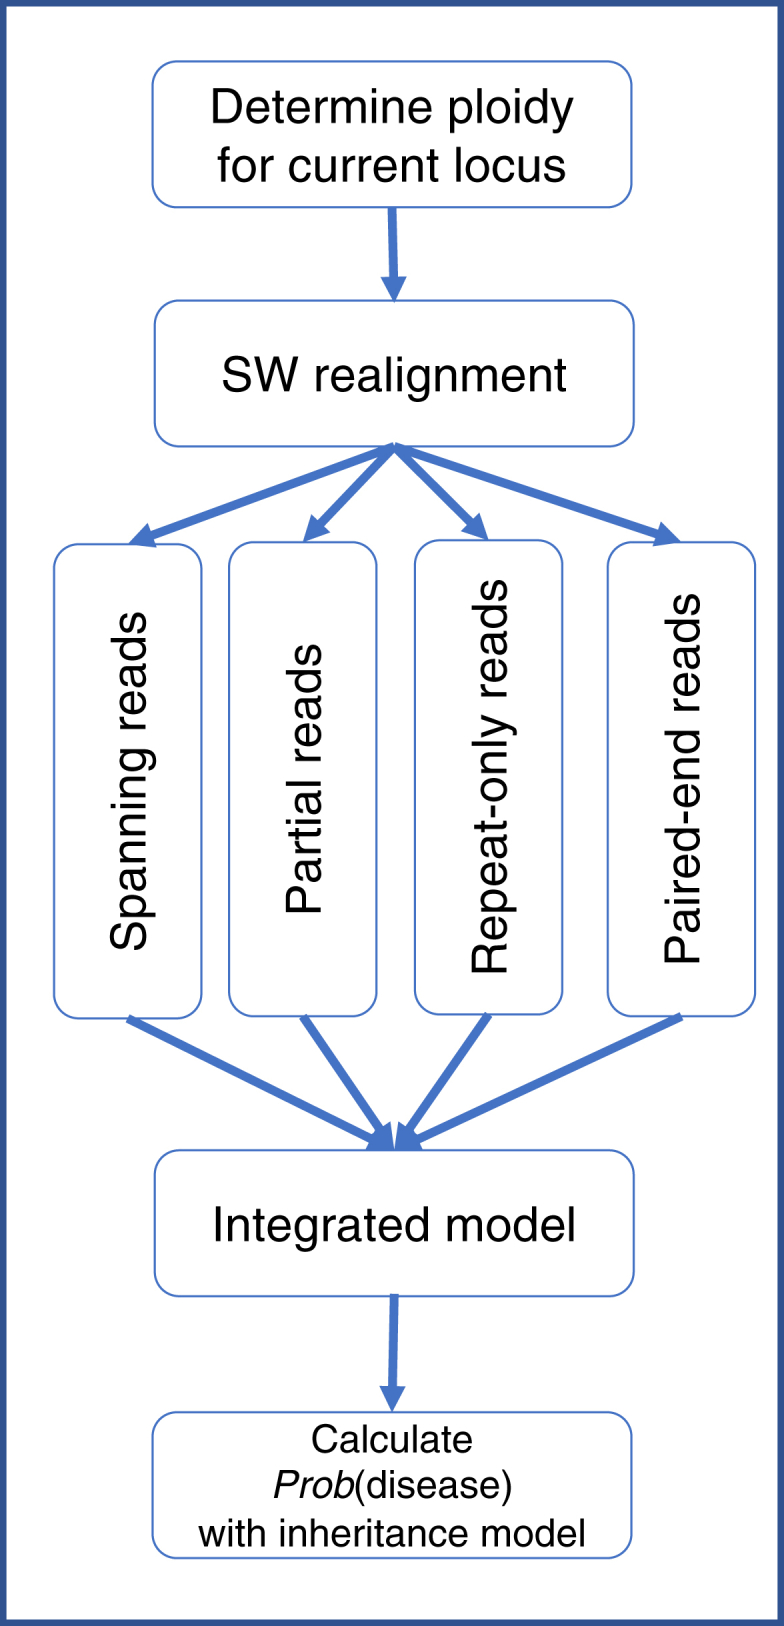
TREDPARSE Workflow for Calling STR-Related Genetic Disease
The workflow includes ploidy inference, read realignment, and integration of various types of evidence in a probabilistic model.
Determine Ploidy for a Locus
A list of the 30 TREDs processed by TREDPARSE is provided in Table 1 (OMIM information for all listed diseases and genes is included). Fragile-X-associated tremor/ataxia syndrome (FXTAS) and Fragile X syndrome (FXS) are both associated with the same gene locus, FMR1; FXTAS occurs in individuals with 55–200 CGG repeats, and FXS occurs in individuals with 200+ repeats. All STR loci that we type are either autosomal or X-linked. We model the autosomal STRs as diploid loci, allowing two alleles to be inferred per locus. For STRs on the X chromosome (X-linked), we use a simple method to infer the gender for the given sample by computing the median read depth on selected unique regions on the Y chromosome. If the median depth on the Y chromosome is less than 1, we consider the gender to be female and enforce ; otherwise, we enforce , which is consistent with the expected ploidy number of sex chromosomes of a male individual.
Table 1.
A List of Trinucleotide Repeat Diseases (TREDs) That We Compiled for This Study
| Abbreviation | Title | Gene | Motif | Repeat location (hg38) | Inheritance | Risk Cutoff | Number of At-Risk Individuals (Families)a |
|---|---|---|---|---|---|---|---|
| DM1 | Myotonic dystrophy 1 (MIM: 160900) | DMPK (MIM: 605377) | CTG | chr19: 45770205–45770264 | AD | 50 | 15 (9) |
| DM2 | Myotonic dystrophy 2 (MIM: 602668) | ZNF9 (MIM: 116955) | CCTG | chr3: 129172577–129172656 | AD | 75 | 0 |
| DRPLA | Dentatorubro-pallidoluysian atrophy (MIM: 125370) | ATN1 (MIM: 607462) | CAG | chr12: 6936729–6936773 | AD | 48 | 0 |
| FXTAS | Fragile X-associated tremor/ataxia syndrome (MIM: 300623) | FMR1b (MIM: 309550) | CGG | chrX: 147912051–147912110 | XLD | 55 | 2 (1) |
| FXS | Fragile X syndrome (MIM: 300624) | FMR1b (MIM: 309550) | CGG | chrX: 147912051–147912110 | XLD | 200 | 0 |
| FRAXE | Mental retardation, FRAXE type (MIM: 309548) | FMR2 (MIM: 300806) | GCC | chrX: 148500638–148500682 | XLR | 200 | 0 |
| FRDA | Friedreich ataxia (MIM: 229300) | FXN (MIM: 606829) | GAA | chr9: 69037287–69037304 | AR | 66 | 0 |
| HD | Huntington disease (MIM: 143100) | HTT (MIM: 613004) | CAG | chr4: 3074877–3074933 | AD | 40 | 5 (4) |
| HDL | Huntington disease-like 2 (MIM: 606438) | JPH3 (MIM: 605268) | CTG | chr16: 87604288–87604329 | AD | 40 | 0 |
| ULD | Unverricht-Lundborg Disease (MIM: 254800) | CSTB (MIM: 601145) | CCCCGCCCCGCG | chr21: 43776444–43776479 | AR | 30 | 0 |
| OPMD | Oculopharyngeal muscular dystrophy (MIM: 164300) | PABPN1 (MIM: 602279) | GCN | chr14: 23321473–23321502 | AD | 12 | 8 (7) |
| SBMA | Spinal and bulbar muscular atrophy (MIM: 313200) | AR (MIM: 313700) | CAG | chrX: 67545318–67545383 | XLR | 36 | 1 (1) |
| SCA1 | Spinocerebellar ataxia 1 (MIM: 164400) | ATXN1 (MIM: 601556) | CAG | chr6: 16327636–16327722 | AD | 39 | 26 (23) |
| SCA2 | Spinocerebellar ataxia 2 (MIM: 183090) | ATXN2 (MIM: 601517) | CAG | chr12: 111598951–111599019 | AD | 33 | 4 (4) |
| SCA3 | Spinocerebellar ataxia 3 (MIM: 109150) | ATXN3 (MIM: 607047) | CAG | chr14: 92071011–92071034 | AD | 60 | 0 |
| SCA6 | Spinocerebellar ataxia 6 (MIM: 183086) | CACNA1A (MIM: 601011) | CAG | chr19: 13207859–13207897 | AD | 20 | 2 (2) |
| SCA7 | Spinocerebellar ataxia 7 (MIM: 164500) | ATXN7 (MIM: 607640) | CAG | chr3: 63912686–63912715 | AD | 34 | 0 |
| SCA8 | Spinocerebellar ataxia 8 (MIM: 603680) | ATXN8OS (MIM: 603680) | CTG/CAG | chr13: 70139384–70139428 | AD | 80 | 3 (3) |
| SCA10 | Spinocerebellar ataxia 10 (MIM: 603516) | ATXN10 (MIM: 611150) | ATTCT | chr22: 45795355–45795424 | AD | 800 | 0 |
| SCA12 | Spinocerebellar ataxia 12 (MIM: 604326) | PPP2R2B (MIM: 604325) | CAG | chr5: 146878729–146878758 | AD | 51 | 0 |
| SCA17 | Spinocerebellar ataxia 17 (MIM: 607136) | TBP (MIM: 600075) | CAG | chr6: 170561908–170562021 | AD | 43 | 52 (48) |
| SCA36 | Spinocerebellar ataxia 36 (MIM: 614153) | NOP56 (MIM: 614154) | GGCCTG | chr20: 2652734–2652757 | AD | 650 | 0 |
| EIEE1 | Epileptic encephalopathy, early infantile, 1 (MIM: 308350) | ARX (MIM: 300382) | GCG | chrX: 25013662–25013691 | XLR | 20 | 0 |
| BPES | Blepharophimosis, epicanthus inversus, and ptosis (MIM: 110100) | FOXL2 (MIM: 605597) | GCN | chr3: 138946021–138946062 | AD | 19 | 1 (1) |
| CCD | Cleidocranial dysplasia (MIM: 119600) | RUNX2 (MIM: 600211) | GCN | chr6: 45422751–45422801 | AD | 27 | 5 (5) |
| CCHS | Central hypoventilation syndrome (MIM: 209880) | PHOX2B (MIM: 603851) | GCN | chr4: 41745972–41746031 | AD | 24 | 11 (11) |
| HFG | Hand-foot-uterus syndrome (MIM: 140000) | HOXA13 (MIM: 142959) | GCN | chr7: 27199925–27199966 | AD | 22 | 2 (2) |
| HPE5 | Holoprosencephaly-5 (MIM: 609637) | ZIC2 (MIM: 603073) | GCN | chr13: 99985449–99985493 | AD | 25 | 0 |
| SD5 | Syndactyly (MIM: 186300) | HOXD13 (MIM: 142989) | GCN | chr2: 176093059–176093103 | AD | 22 | 1 (1) |
| XLMR | Mental retardation, X-linked (MIM: 300123) | SOX3 (MIM: 313430) | GCN | chrX: 140504317–140504361 | XLR | 22 | 0 |
| ALS | Amyotrophic lateral sclerosis (MIM: 105550) | C9orf72 (MIM: 614260) | GGGGCC | chr9: 27573529–27573546 | AD | 31 | 0 |
Inheritance modes are AD (autosomal dominant), AR (autosomal recessive), XLD (X-linked dominant), and XLR (X-linked recessive). Individuals were inferred to be “at risk” by TREDPARSE if , where is the probability that a sample is pathological given the risk cutoff.
Total number of individuals assessed in this study: 12,632. Total number of independent families plus unrelated individuals: 8,784.
Same genetic locus for FXTAS and FXS but with different risk cutoffs in repeat counts.
Sequence Realignment for Accurate Repeat Counting in Reads
We realign the reads that were mapped around the STR region extracted from the BAM file. The goal for the realignment is to obtain an accurate count of the occurrences of the repeat motifs. Most read mapping methods, when aligning reads to a reference, have a high penalty for long indels. This often results in alignment misses or misalignments,20 leading to false predictions. The quality of sequence alignment is thereby crucial in accurately counting the repeats in STR regions.23 When performing the alignment across an STR region, one should lower or remove the penalties from indels from the repeat motif itself in order to improve the final motif count estimates.
In TREDPARSE, we use dynamic programming with the Smith-Waterman (SW) algorithm to count the number of repeats. We use a “single-instruction-multiple-data” (SIMD) Smith-Waterman library for fast alignment.24 The scoring scheme we use in TREDPARSE is as follows: with a slightly higher penalty for mismatches than the default alignment settings in the BWA aligner.25 To accommodate potentially longer indels, we built a series of STR-region references that are embedded with a variable number of repeat units (“multiple templates” method) (Figure S1). The SW alignment yields a series of alignments with different scores, which we then compare to determine the repeat size that corresponds to the highest score (Figure S1B). The “multiple templates” method implicitly utilizes the periodicity property of STRs and can be more computationally efficient as a result of the heavily optimized SIMD SSW library.24
TREDPARSE realigns two types of reads extracted from the BAM file: (1) reads that are mapped within a read length from the repeat location and (2) reads that are unmapped but have a mate mapped within a distance of 1 kb from the repeat location. The number of repeats is then determined for each read in the STR region. The number of base pairs required for calling the existence of a flank is 9 bp and plays an important role in the classification of various types of reads. During the alignment, each read is classified as a prefix read (read with flanking sequence to the left of the repeats) or a suffix read (read with flanking sequence to the right of the repeats) depending on the positions where the alignments start or end on the read. On the basis of the alignment information, reads with both prefix and suffix are classified as spanning reads, and reads with either prefix or suffix but not both are classified as partial reads. Reads that only consist of repeats are repeat-only reads. These reads are sorted into a set of observations that are integrated in a probabilistic model for STR size inference (Figure 2).
Figure 2.

Integrated Probabilistic Model for Calling STRs with Four Types of Evidence
(A) Model based on spanning reads.
(B) Model based on partial reads.
(C) Model based on repeat-only reads.
(D) Model based on paired-end reads.
(E) Predictive power for each of the four evidence types on the range of STR repeat lengths. Darker shades of green represent higher confidence of inference.
Probabilistic Model for Calling STRs
Parameters in the Model
To fully model the uncertainties of observing a set of reads that are generated by a certain repeat size, we built a probabilistic model for predicting the size of STRs on the basis of evidence from spanning reads, partial reads, repeat-only reads, and spanning pairs. The spanning pairs are read pairs that cover the STR region, i.e., they have one end on each side of the repeat. Each read type has its own characteristics that reflect the unknown repeat size. We will describe how these components affect STR calling separately, with the following notations:
-
•
L: read length in base pairs (bp), e.g., for 150 bp reads
-
•
D: haplotype depth, average sequencing depth divided by ploidy. For a diploid locus, it is equal to half of the sequencing depth
-
•
F: number of base pairs required for calling a flanking sequence. By default, TREDPARSE requires at least 9 bp when matching flanking sequences, i.e.,
-
•
R: number of repeat units in the reference sequence
-
•
K: repeat unit length, e.g., for triplet CAG repeats
-
•
S: observed number of repeat units in a
-
•
T: observed number of repeat units in a
-
•
U: number of repeat-only reads
-
•
V: observed paired-end distance in bp for a
h1, h2: number of repeat units in two alleles, respectively. Without loss of generality, we assume . For a haploid locus (such as an X-linked locus in a male), we have h1 = h2.
To avoid confusion, we have . For example, the human reference genome (hg38) has for the Huntington locus, which is a repeat of CAG (), so is the total repeat length in base pairs. Formally, our observations consist of a set of spanning reads with repeat units , partial reads with repeat units , repeat-only reads, and spanning pairs with a paired-end distance in base pairs . Our goal is to estimate the and that maximize the likelihood of the set of observations .
Spanning Reads
The spanning reads are the reads that show both left and right flanking sequences. Inferring the number of repeat units given spanning reads is straightforward, and the counted size matches or is close to the true size (Figure 2A). The spanning reads would show exactly the size of the underlying allele if there were no noise due to stuttering. The sharp peak becomes “fuzzier” after the stuttering noise is incorporated. We use the stuttering model trained by lobSTR, which considers the periodicity of the repeat as well as the GC content.15 The stuttering model allows a certain proportion of the spanning reads to show a different size than the true allele size.
To account for the stutter noise, we use the following model, similar to the stutter model used in lobSTR.15 With probability , the read is a product of stutter noise, which is dependent on the repeat unit length and also the GC content of the locus. If a read is a product of stutter, then with probability , the noisy read deviates by units from the original allele, where is a Poisson distribution with mean . Deviation can be either positive or negative with equal probability . Parameters and were previously trained by lobSTR15 for a range of values . Hence, the probability of generating a spanning read with observed repeat units in the STR region from a hemizygous locus with an STR with repeat units is
For a diploid STR locus with and repeat units, we then have a mixed distribution with mixing rate :
where
Note that there may not be any spanning reads expected when if both allele lengths are longer than . In that case, we set . We then have the mixing distribution
Partial Reads
The partial reads do not align all the way across the repeat region and contain only one flanking sequence. The partial reads have a probability mass function of discrete uniform distribution between a single repeat unit and the true repeat length (Figure 2B). Therefore, unlike the full spanning reads, which show exactly or close to (in case of stuttering error) the number of repeat units of the underlying allele, the partial reads only show a lower bound for the number of repeat units of the underlying allele. The inference task is to infer the maximum number of repeats, given observed allele sizes from partial reads. The inference is analogous to the “German tank problem”26 but with replacement, under the condition that the allele cannot exceed the read length minus the length of the flanking sequence.
The probability of generating a partial read with observed repeat units in the STR region from a hemizygous locus with an STR with repeat units is
For a diploid STR locus with and repeat units, we have a mixed distribution with mixing rate :
where
We then have the mixing distribution
Repeat-Only Reads
Reads that consist almost entirely of repeat units are repeat-only reads. Each repeat-only read often has a relatively unique mate that allows it to be mapped (Figure 2C). Repeat-only reads are possible only when repeat length is the same or longer than a read length. Assuming each read is equally likely to start anywhere in the genome, the expected number of repeat-only reads that fall in a certain region follows a Poisson distribution:
where
These repeat-only reads are typically mapped in the STR region because they have a read pair that mapped to a flanking site. The repeat-only reads are critical because they allow the inference of repeats longer than the read length.
Paired-End Reads
Additional information can be gathered from the group of paire- end reads (sometimes called “mates”) that span the STR region. The observed distance between the two mate reads typically follows a distribution for a specific sequencing library. This distribution can be inferred from a compilation of the distances between all (or a representative subset of) the paired-end reads across the genome. For alleles without indels in the STR region, the distribution of the observed distances should be distributed identically to .27 If there is a homozygous insertion or deletion of repeat units in the STR region, the distribution of would shift to , where is the number of repeats in the reference and is the number of repeats in the sampled allele, such that . Expanded repeats (or longer ), when mapped onto the reference, show a compression of paired-end distances; conversely, shortened repeats (or shorter ) show an expansion of paired-end distances. The shift between the two distributions— and —should indicate the difference in repeat length relative to the reference genome (Figure 2D). Then we have
where is a normalizing constant that ensures that all sum to 1. Like repeat-only reads, the paired-end distance is also useful for extending the prediction of allele size beyond the length of a typical sequencing read because the paired-end distance is often longer than the read length. For a diploid STR locus with and repeat units, we have a mixed distribution with mixing rate :
where
We then have the mixing distribution,
The paired-end mode is only enabled when there are at least five spanning pairs across the STR locus. With too few observations, the variance of our maximum-likelihood estimates based on spanning pairs alone can be substantial.
Integrated Model
Each of the four types of read evidence has its own range of predictive power across the range of likely STR repeat length, as limited by either read length or paired-end distance of the sequencing library (Figure 2E). We combine data from spanning reads, partial reads, repeat-only reads, and spanning pairs under the assumption that each type of evidence is independent given the true repeat numbers:
The maximum-likelihood estimates are then obtained from the model through a grid search. Examples of typical likelihood surface can be seen in (Figure 3). In TREDPARSE, we set , which is the detection limit of all of our evidence types, so the full grid search is at most 300 for haploid and 300 × 300 for diploid loci.
Figure 3.

Examples of Posterior Probability Density Function Based on the Integrated Model for Calling STRs
(A) Simulated diploid with ; there are no uncertainties around and some uncertainties around .
(B) Simulated diploid with , showing a slight negative dependence between and .
Confidence of STR Calls and Calculation of Given the Inheritance Model
We combine all the evidence in the integrated model and compute the point estimates on the basis of maximum likelihood. We first compute the marginal distribution of and . From these marginal distributions, we can compute the 95% credible interval (95% CI) for and (Figure 3). The CI of a distribution with parameter is defined as
The 95% CIs are not unique on a posterior distribution. In TREDPARSE, we use the 95% CI where there is equal mass on each tail. Credible intervals for the estimates are typically much wider for larger repeat sizes and are tighter with data with high sequencing depth according to our simulation results.
Additionally, we compute the probability that a sample is pathological (), given dominant and recessive inheritance models under the assumption of complete penetrance and a point cutoff of size . We have
where is a normalizing constant. The inheritance model and risk cutoff size (Table 1) are both important in the calculation of . Indeed, these models are idealized and are subject to validation in future studies for actual diseases. Recessive inheritance requires the shorter allele to be greater than or equal to the risk cutoff size , whereas dominant inheritance requires the longer allele to be greater than or equal to. For X-linked recessive inheritance, only one allele needs to be greater than or equal to in order for pathology to be shown. Both the 95% CI and the pathological probability reflect the confidence of repeat-size inference, with being more pertinent for a clinical statement. In this study, we report all cases as “at risk” if .
Simulation
We simulated read data from individuals with varying lengths of the Huntington disease (HD) locus. We performed the simulation by using EAGLE, which is designed to simulate the behavior of sequencing instruments by introducing various errors that are characteristic of the Illumina sequencing platform. We simulated with 2× 150 bp reads with a paired-end distance of 500 bp (and a standard deviation of 50 bp), at varying levels of sequencing depth (between 5× and 80×). EAGLE also uses empirical data to determine variable sequence depth according to the variation of the GC content along the template sequences.28 We have made these simulated read data publicly available (see Web Resources).
After running EAGLE, we mapped the simulated reads onto the human reference genome hg38 by using the BWA aligner25 and then ran TREDPARSE and popular variant calling softwares (Manta,29 Isaac,12 GATK,13 lobSTR,15 and TREDPARSE) and comparing the inferred lengths with the true ones. For the HD locus, the pathological threshold (full-penetrance allele) is established at 40 CAGs,30 so there was significant interest in identifying STR expansions that are greater than or equal to 40. As a limitation of the current study, we have not simulated the STR stutter noise.
Genomes
The analysis used deep-sequence genome data of 12,623 individuals (8,784 unrelated) as described in, and extended from, Telenti et al.22 Participants were representative of major human populations and ancestries: 7,602 European, 1,428 African, 315 Middle Eastern, 300 central/south Asian, 300 east Asian, 149 admixed American, 2,243 admixed, and 490 other. The relatedness of individuals was established as previously reported.22 The study population was not ascertained for a specific health status, and specifically, there were no known diagnoses of STR diseases. New and existing institutional review board (IRB)-approved consent forms for participation in research and collection of biological specimens and other data used in this publication were reviewed and confirmed to be appropriate for use.
Experimental Validation with Other Sequencing Technologies
The conventional standard for assay-to-size STR loci is PCR amplification. Consequently, we validated our calls independently by using Sanger sequencing at a CLIA-certified lab (Elim Biopharmaceuticals). We observed that some samples failed to efficiently amplify both alleles during Sanger sequencing. For those samples, we used Oxford Nanopore long-read (1D) sequencing technology on the MinION device. To generate sequencing libraries for the MinION, we followed the protocol provided by Oxford Nanopore for generating 1D libraries. In brief, 50 ng of genomic DNA was amplified, barcoded, and ligated to adapters. The library was then loaded onto an Oxford Nanopore R9.4 SpotON Flow Cell and sequenced for 5 hr.
Implementation and Interactive Server
TREDPARSE outputs both VCF and JSON-formatted files that show the final calls as well as the evidence and the confidence for the calls. Two recent versions of the human reference genome are currently supported: hg19 and hg38. Scripts for compiling results from multiple samples and visualizations of posterior probability density (similar to Figure 3) are provided as part of the software. In addition, the posterior probability of the genotype calls is available as part of the output and could be used as confidence assessment of the final calls.
We have also developed an interactive server that allows easier access for non-technical users. A docker image that contains a copy of TREDPARSE is run on the backend to handle all the computations. There are two input fields for the interactive server: the address to the BAM file and the STR locus identifier as one of the loci in our list (Table 1). The BAM file needs to be accessible by FTP, HTTP, or Amazon S3 storage. TREDPARSE requires both the BAM file and the BAM index file to be present for fast access.
The STR server generates a rich set of information, useful for visual proofing and validation of the STR calls. These contain detailed information about the STR; such information includes call results, probability density of the risk allele estimates, and observations affecting the final calls, including various read-based evidence, detailed information about each STR locus, and allele frequency distribution within HLI samples (Figure S2).
Results
Accuracy of TREDPARSE on Simulated Data
Simulation with synthetic data shows that TREDPARSE out-performs many other callers of short tandem repeats. We first compared TREDPARSE with commonly used general-purpose variant callers, including Manta, Isaac, and GATK. Not surprisingly, they perform poorly on the simulated datasets (Figure S3). These variant callers can detect small indels, but in most cases they fail to recover the length of long alleles (i.e., large indels). Additionally, the indels could occur at different locations within the repeat tract; it is not sufficient to construct locus-based callers that inspect indels collectively, making direct calling of the repeat size difficult without further post-processing. On the basis of these comparisons, we found that most tools tested thus far were not effective at quantifying the number of repeats.
As a tool that was specifically designed for STR variant calling, lobSTR performed better than other variant callers at short allele size ranges, up to 40 CAGs, which is close to the risk threshold for HD30 but below the risk threshold of 12 other STR diseases (Table 1). We found that TREDPARSE out-performed lobSTR at longer allele lengths, typically above risk threshold, which were more critical for assessing disease status, in either a haploid setting or a diploid setting. Because the HD risk threshold (40 CAGs = 120 bp) is very close to a read length, lobSTR was unable to correctly predict risk alleles, whereas TREDPARSE calls were close to the truth and identified all long HD alleles as risk alleles.
The TREDPARSE caller extended the calling of the size of the allele beyond a typical read length to the extent of the paired-end distance. Most truth values fell within the 95% credible intervals (Figure 4B). For longer allele sizes, the calls did not precisely match the true values but were nonetheless close. The main source of errors was mostly evidence that was based on repeat-only reads and paired-end distances, which have much more variation than full spanning reads (Figure S4).
Figure 4.

Simulations with Synthetic Datasets of Implanted STR Alleles at the Huntington Locus
(A) Performance comparison of TREDPARSE and lobSTR on a simulated haploid with one single allele with number of CAGs, where varies from 1 to 300.
(B) Performance comparison of TREDPARSE and lobSTR on a simulated diploid with two alleles, one allele fixed with 20 CAGs and another allele with units of CAGs.
(C) Performance of TREDPARSE on a simulated diploid with a low haploid depth of 5×.
(D) Performance of TREDPARSE on a simulated diploid with a high haploid depth of 80×. Shaded regions represent a 95% credible interval for TREDPARSE estimates of . represents the root-mean-square deviation, calculated as , where .
Most importantly, TREDPARSE extends the limit of STR length detection well beyond the physical read length. This extension is critical in many cases because several of the disease risk cutoffs are close to or beyond the read length—150 bp for mainstream Illumina sequencers. In the simulations, we could accurately predict the alleles that contain up to ∼160 triplet repeats (∼500 bp), which is close to the simulated paired-end distance. For repeats that are longer than the paired-end distance, the predicted lengths of the repeats remain close to the paired-end distance (Figure 4). When the repeat length exceeds the paired-end distance, pairs of repeat-only reads become available, but they often fail to get placed inside the repeat locus by the aligner, leading to a signal loss that cannot be recovered. On the basis of this limit, it is possible to detect risk alleles for most loci listed in Table 1, with the exception of FXS, FRAXE, SCA10, and SCA36, which exceed the paired-end distance in Illumina sequencing libraries.
Power of Each Type of Supporting Evidence to Predict STRs of Varying Length
Each of the four types of evidence has its own range of predictive power across the spectrum of likely STR repeat length. Overall, the maximum repeat length that each type of evidence can identify is increasing from spanning reads, partial reads, and paired-end reads to repeat-only reads (Figure 2E). The repeat-only reads often cover the longest range in a typical Illumina sequencing experiment and are bounded by the paired-end distance.
In an effort to understand the contribution of each type of evidence to the final TREDPARSE STR call, we reran the simulation experiments by using just a single type of evidence, for example, using only spanning reads and ignoring all other evidence. This experiment permited us to isolate the contribution of each type of evidence. As expected, the predictive power of spanning reads and partial reads was roughly limited by the read length, whereas evidence such as paired-end reads and repeat-only reads were both limited by roughly the paired distance (Figure 2E, Figure S4). Notably, no evidence covered the complete range of STR repeat sizes, so it was important to make use of all four types of evidence for more accurate estimates.
Sequencing depth strongly influenced the accuracy of the repeat-number inference. In the simulated diploids with 5× haploid depth (or 10× diploid depth), TREDPARSE inferences became highly inaccurate in comparison to inferences in simulated diploids with 20× haploid depth and showed wide credible intervals for most of the repeat sizes above the risk cutoff of 40 CAGs in the case of Huntington disease (Figure 4C). Because most of the public genomes from the 1000 Genomes Project are of low coverage of mostly diploid depth of less than 10× (mean depth = 7.4×),31 we could not reliably call STR allele sizes in the 1000 Genomes Project datasets. At haploid depth of 80×, the credible intervals of the estimates become much smaller (Figure 4D), but high-coverage sequencing data are expensive to generate.
In case of the extremely long repeats, where repeats are longer than the paired-end distance, many of the repeat-only reads were unmapped, so the number of repeat-only reads would be underestimated. It was not reasonable to use those reads from the “unmapped” portion of the genome because they might have been derived from other alternative loci in the genome with similar repeat patterns and might not have been distinct enough to be assigned to the right location. For example, an unmapped read that consists entirely of CAGs might come from an expanded HD locus, SCA1, SCA2, etc., that shares the same repeat pattern (Table 1). Although they might reflect an expansion somewhere in the genome, those reads could not be confidently assigned to the HD locus and counted toward HD repeats, leading to a loss of required signals from which to make accurate calls at extremely long repeat lengths.
Dependencies between and
We simulated various combinations of and and studied the joint posterior probability distributions that our model generated. In most simulated cases, particularly when was relatively short, there was little dependence between and so that the joint distribution could well be represented by two marginal distributions over and (Figure 3). However, because both alleles contributed to the repeat-only reads, which was the only signal left to be identified (Figure 2E), when both and were longer than the read length our model could not accurately distribute the fixed signal among the two alleles, so there appeared to be a strong negative correlation between and (Figure 3B). Of course, cases where both and are expanded pathological alleles are rare.
STRs in 12,632 Genomes
We ran TREDPARSE on sequence data from 12,632 individuals (expanded dataset from Telenti et al.22) and identified a total of 138 individuals with risk alleles at a total of 15 disease loci (Figure 5), as well as 54 individuals inferred to be “carriers” who are capable of passing a recessive risk allele on to their offspring (Table S1). Specifically, we inferred 15 DM1, 2 FXTAS, 5 HD, 8 OPMD, 1 SBMA, 26 SCA1, 4 SCA2, 2 SCA6, 3 SCA8, 52 SCA17, 1 BPES, 5 CCD, 11 CCHS, 2 HFG, and 1 SD5 at-risk individuals (Table 1). Various types of supporting read evidences for the inferred risk individuals are included in Table S2.
Figure 5.

Testing and Validation of TREDPARSE on 12,632 Whole-Genome Sequences
We ran TREDPARSE on sequence data from 12,632 individuals and identified 138 individuals with risk alleles at a total of 15 disease loci. A subset of the inferred at-risk samples were validated by complementary sequencing experiments.
To understand the strength of correlation of each signal to the inferred allele size, we measured the evidence available after analysis of WGS data from these individuals, who were sequenced at ∼30–40× with Illumina instruments. The evidence per sample is correlated to the sequencing coverage of each individual and the length of the inferred longer STR allele. All correlations increased linearly with the sample mean coverage. However, the increase was more pronounced for paired-end reads than for partial reads and spanning reads (Figure S5). As expected, long STR repeat alleles had fewer full spanning reads and more partial reads. The amount of paired-end evidence was largely unaffected by the repeat length (Figure S5). These observations on read depth versus allele size support our probabilistic model.
Validation with GeT-RM Cell-Line Reference Materials
The Genetic Testing Reference Materials Coordination Program (GeT-RM) has characterized reference materials for quality control, test development, and validation. GeT-RM provides cell lines or DNA that can be used as reference materials for genotyping inherited diseases, including myotonic dystrophy, fragile X syndrome, and Huntington disease.32 We sequenced six cell lines obtained from GeT-RM; these included two DM1, two FXTAS/FXS, and two HD cell lines with known true allele sizes confirmed by several different labs (Table S3).
TREDPARSE was able to predict risk alleles for five out of the six cell lines. Sample NA20236, which is known to have allele sizes of 31/53 in the FXTAS locus, was missed by TREDPARSE; sample NA05164, which is known to have allele sizes of 21/340 in the DM1 locus, has the size of the long allele under-predicted by TREDPARSE. The predictions wih regard to the four other cell lines exactly or closely match the truth (Table S3). In contrast, lobSTR failed to predict long allelels in all cases and failed to generate any predictions for the two FXTAS cell lines. ExpansionHunter predictions were close to the truth on the HD cases but failed on both the two DM1 and the FXTAS cell lines, where TREDPARSE yielded predictions much closer to the truth (Table S3).
Validation with Sanger and Oxford Nanopore Sequencing
We selected a subset (n = 19) of 138 individuals who were reported by TREDPARSE to contain a risk allele (Figure 5). The cases for which we have confirmed that there was sufficient DNA available were subjected to CLIA Sanger sequencing (Table S4). Out of 19 cases, 11 had identical lengths for Sanger and TREDPARSE, four did not match exactly but were called “at risk” by both Sanger and TREDPARSE, and four were discordant (an example is given in Figure S6). In all four discordant cases, Sanger sequencing identified only the shorter allele, suggesting that these cases only contain shorter allele(s). We hypothesized that the amplification step makes shorter alleles more likely to be represented than longer alleles, suggesting the possibility of “allelic dropout” in Sanger-sequencing reactions.33
To resolve the discrepancy between TREDPARSE predictions and Sanger validation results, we ran Oxford Nanopore sequencing (ONP)18 on samples that failed Sanger validation (Figure S6C). Oxford Nanopore sequencing yielded an approximation of the repeat size but nonetheless qualitatively validated the existence of long alleles for validation purposes (Table S4). Overall, TREDPARSE was validated in all 19 cases. In contrast, only four of the 19 validated cases were called with lobSTR, and long alleles were missing from all inferences. The recently developed STR caller, ExpansionHunter,16 predicted expanded alleles in 17 of the 19 cases but had a tendency to overestimate the length of the expanded allele in five of the 17 predicted cases (Table S4).
Transmission of STR Alleles in Pedigrees
Even though the inferences of STR alleles were independent across individuals when we used TREDPARSE, we confirmed that the pathological alleles were consistently called within pedigrees. Among the 12,623 individuals, we have a total of 2,257 families with at least two sequenced members, as well as 6,527 single individuals with no related family members in the dataset. In total, there are 8,784 families and single individuals who are unrelated to one another and could be viewed as independent. Some families contain more than one individual inferred by TREDPARSE to be “at risk” at a given locus (Table 1).
We describe three pedigrees here. The first family had a father-to-daughter transmission of a risk allele for the Huntington locus, which has 41 CAG repeats in the father and 40 repeats in the daughter (Figure 6A). These alleles have been experimentally validated through Sanger sequencing (Table S3). The second family showed a putative DM1 risk allele transmitted from mother to both kids, whereas the father was unaffected (Figure 6B). Although the exact size estimates for the putative risk allele were different as a result of uncertainties associated with repeat alleles exceeding the read length, the 95% CIs of these estimates were overlapping. The third family showed the putative SCA17 risk allele transmitted from father to both kids, whereas the mother was unaffected (Figure 6C). None of the “at risk” individuals in these families had reported phenotypes associated with symptoms of HD, DM1, or SCA17, although several individuals could be within the range of age of onset for these disorders.
Figure 6.

Individuals with Risk Alleles at the Huntington Disease Locus in Whole-Genome Samples
(A) A family with the putative HD risk allele transmitted between generations.
(B) A second family with the putative DM1 risk allele transmitted between generations.
(C) A third family with the putative SCA17 allele transmitted between generations.
The expanded risk alleles are highlighted in red. For both alleles, the 95% credible intervals are provided below the estimates. Age refers to the biological age of the individual at the time when the DNA sample was taken.
We carried out an independent accuracy analysis, based on the family information, by assessing the rate of Mendelian errors (MEs). Mendelian errors refer to the cases where the child genotype cannot be explained by Mendelian inheritance patterns given the genotypes of both parents. It is only possible to determine whether an allele was transmitted if the allele size exactly matches that of some allele in the parents.
Within the HLI samples, we have compiled 802 trio families (mom-dad-kid) and compared the STR calls within the family. The full set of data, including all calls and supporting read counts for mom, dad, and kid, are included for each of the 30 loci (Table S5). The median ME rate across the 30 STR loci is 4.25% (Figure S7). A total of 23 STR loci has a ME rate lower than 10%, whereas seven loci, including FXTAS/FXS, FRAXE, ALS, SCA7, CCHS, SCA17, and EIEE1, have a ME rate of more than 10%, and tend to yield inexact estimates (Table 2).
Table 2.
Confidence about STR Calls for Each Disease Locus through Experimental Validations, Simulation Support, and Mendelian Error Analysis
| Experimental Validation | Risk Allele Observed in This Study | Simulation Supports Inference of Risk Alleles? | Loci |
|---|---|---|---|
| YES | YES | YES | HD, SBMA, SCA1, SCA2, SCA8, SCA17, DM1, FXTAS |
| NO | YES | YES | OPMD, SCA6, BPES, CCD, CCHS, HFG, SD5, FRDA (carriers) |
| NO | NO | YES | DM2, DRPLA, HDL, ULD, SCA3, SCA7, SCA12, EIEE1, HPE5, XLMR, ALS |
| NO | NO | NO | FXS, FRAXE, SCA10, SCA36 (risk allele exceeding 500 bp, or typical paired-end distance for Illumina libraries) |
| Imprecise size estimates (Mendelian error rate > 10%) | FXTAS/FXS, FRAXE, ALS, SCA7, CCHS, SCA17, EIEE1 | ||
For FXTAS/FXS and FRAXE, the ME rate is extremely high because of substantial read dropout; often no full spanning reads and only partial reads are available, and these only give lower bounds of the size estimates (Figure S8). The low level of read support could be due to the GC content bias in Illumina sequencing. Indeed, out of the five STR loci that are entirely G or C, four loci showed a ME rate of more than 10%.
These ME estimates are much higher than the ME rate of <1% reported in Gymrek et al.,15 where the rate was based on a single trio but an averaged error rate was computed over all STR sites across the entire genome. In addition to the several high GC loci that had substantial read dropout, the relatively high level of MEs in our study could be due to either genotyping errors in TREDPARSE or de novo mutations. It is likely that the selected STRs related to disorders (Table 1) are biased toward a higher de novo mutation rate than the genome average. Our stringent requirement of identical size matches also causes the ME rate to be higher, especially for the disease STR loci that typically show a higher level of allelic mosaicism or stutters than other STR loci.11
Varying Confidence with Regard to STR Loci
Because some TREDs lacked outlier samples, not all TREDs were considered fully validated. TREDs that are considered reliable and had at least 1 validated sample included HD, DM1, FXTAS, SBMA, SCA1, SCA2, SCA8, and SCA17 (Figure 5; Table 2). We are most confident about these STR loci because we have observed at-risk individuals in our HLI samples, the loci were experimentally validated, and these loci had support from in silico simulation.
Our list contained a total of eight TRED diseases for which we have observed risk alleles but have not obtained experimental validation because of a lack of DNA material. Nonetheless, simulation analysis offers good support and concordant calls within families. These loci included OPMD, SCA6, BPES, CCD, CCHS, HFG, SD5, and FRDA.
Additionally, we did not identify any at-risk individuals for 15 diseases in our list (Table 2). For TRED disease loci FXS, FRAXE, SCA10, and SCA36, the risk allele exceeded the detection limit of the software.
The varying confidence with which we could identify the various TRED disease loci is highly correlated with the amount of evidence available for inference. High-GC-repeat loci show substantially fewer spanning reads, partial reads, and paired-end reads than loci with lower GC content, such as the CAG motif (Figure S8). Whereas the loci identified with low confidence tend to yield imprecise estimates, TREDPARSE could still be useful as a quick screen to indicate potential pathological expansions, although clinical follow-ups in those cases are certainly recommended.
Discussion
Salient Features of TREDPARSE
The distinguishing features of TREDPARSE include (1) automatic determination of the correct ploidy level to account for X-linked and autosomal loci; (2) re-alignment of reads, leading to a more precise counting of repeat elements; (3) use of a full probabilistic model that incorporates four types of evidence—spanning, partial, repeat-only, and paired-end reads—whereas most competing software programs only consider spanning reads, and so calls are limited by read length; and (4) computation of likelihood of disease under the proper inheritance model (dominant or recessive). The combination of all these features enables TREDPARSE to create clinically relevant profiles of STR-related diseases.
Among all existing STR callers, ExpansionHunter, recently reported in pre-print,16 is the most similar to TREDPARSE in that it also collects partial reads that could predict expanded alleles longer than a typical read length, but TREDPARSE also models the paired-end distance, which helped to improve accuracy, as shown in both the cell-line validations and the selected validation set in HLI samples. Additionally, TREDPARSE has an added benefit of being able to compute the joint likelihood of the calls. The shape of the joint probability could be more useful in some cases than marginal confidence intervals (CIs).Achieving good estimates with bootstrapping can be computationally expensive, and bootstrapping offers few hints about the dependencies between the alleles, as compared to the full joint likelihood model used in TREDPARSE.
Most of the STR-related diseases are poly-glutamine diseases,34 whereas others are GCN-related diseases or poly-alanine diseases.35 We carefully curated the list of diseases on the basis of relevant literature. It is straightforward to add additional loci to the list—a minimal set of information required for a new locus includes the genomic coordinates for the repeats and the disease risk cutoff based on clinical studies in order to allow the probability of the disease to be determined, if a full penetrance model is assumed. However, each disease is unique, and there is debate regarding the optimal length cutoff for risk alleles.
Prevalence of Rare STR Diseases in the Human Population
Population-scale analyses enable better estimates of STR mutation rates and allele frequencies.36 We use both alleles in the computation of the allele frequencies for diploid loci. Allele frequencies can display either a single peak or multiple peaks, reflecting population structure within the human population (Figure S9). Although inferred to harbor abnormally long STR alleles that would put individuals “at risk” according to current understanding, most of the individuals that we identified with risk alleles are asymptomatic.
There are two possible explanations for the lack of disease symptoms in the study population. First, if the disease phenotype for the samples that are determined to be “at risk” is to be determined, the disease needs to have a high penetrance. For example, the Huntington disease mutation is genetically dominant and thought to be fully penetrant with one allele with 40 or more CAG repeats.37 Even so, it might be worthwhile to look for cases of reduced penetrance resulting from protective alleles somewhere else in the genome among these asymptomatic individuals,38 in other words, to look for the so-called “resilience.” Second, the lack of symptoms might be due to the late onset of the disease, i.e., these individuals might not have reached the age of onset.
For many STR loci, we have observed an inflation of STR disease prevalence in HLI samples in comparison to the known prevalence estimates based on literature review (Table S1). For example, Huntington disease was previously estimated to have a population frequency of 6.5–15 per 100,000 individuals in the United States.39 The inferred prevalence of Huntington disease of 5/12,623 was higher than previous estimates. After correcting for relatedness among families (i.e., the family in Figure 6A), we observed a frequency of 4/8,784 independent families plus single individuals (Table 1). This implies an inflation of 3× in comparison to the known prevalence. Overall, among the STR diseases that have a reported prevalence based on prior studies, DM1, HD, SBMA, and SCA6 are shown in this study to have prevalence estimates similar to those previously reported. However, our estimated prevalences for SCA1, SCA17, and CCD are orders of magnitudes higher than the known prevalences for these diseases.
For two STR disorders FXTAS and FRDA, we found that our predictions in the study samples were lower than the population estimates. For FXTAS, we expected that about 1 in 150 females would have the FXTAS mutation.40 However, we only identified two risk alleles in our samples. Both individuals carrying the risk alleles are from the same family. One female individual has calls of “10/60” (one allele of size 10 and another of size 60 repeats), with support from five partial reads and three repeat-only reads; the male individual has calls of “59/null” (single allele of 59 repeats because males are hemizygous at FXTAS), with support from two partial reads and three repeat-only reads (Table S2). In both cases, the presence of repeat-only reads was strong evidence in support of an expanded risk allele. The prevalence (2/12,632) is indeed much lower than what the population prevalence would predict, an indication that the prediction for FXTAS/FXS is under-powered because of low amounts of read support in high-GC-content motifs. For FRDA, we expected a approximately 1 in 100 individuals to be carriers,41 but we were able to identify 37 recessive allele carriers (Table S1). Because FRDA is known as an autosomal-recessive disorder, none of the 37 individuals were inferred to be affected by the disorder.
The number of inferred at-risk individuals is most heavily influenced by the exact size cutoff for the full-penetrance allele that was chosen. For some diseases, the literature contains conflicting estimates regarding both the size cutoff for full-penentrance alleles and the prevalence in the human population. The inconsistencies are partially due to the fact that the penetrance and prevalence of many STR diseases are highly variable among different ethnicity and geographic locations as a result of a potential founder effect.39 Because during probabilistic inference TREDPARSE generates a full joint posterior density that is completely independent from the chosen size cutoff, our inference could be revised accordingly if different cutoffs were used.
Allelic mosaicism is an important aspect of the STR disorder,11 but it is not currently modeled in TREDPARSE. In general, prediction of mosaicism can be difficult because the stuttering nature of the STR alleles can lead to variation in allele sizes during sequencing. In the current implementation, TREDPARSE predicts two most likely alleles for autosomal loci and one or two alleles for sex-linked loci on the basis of the inferred gender. When evidence supports extra conflicting allele sizes beyond the inferred ploidy, and when these allele sizes are also not explained by the stuttering model, the genotype call would be assigned a low probability and wider confidence interval because alternative models are suggested. Additionally, TREDPARSE tracks the repeat size of all contributing reads, so when a genotype call quality is lower, it could indicate the existence of extraneous reads resulting from mosaicism.
Because of costly testing procedures and the unstable nature of STR loci, these loci have so far been mostly under-utilized in population-based efforts to assess the prevalence of STR disease risk. TREDPARSE enables simultaneous identification of many STR loci through the use of whole-genome sequencing data. The whole-genome approach offers an advantage over conventional STR testing by limiting the potential bias introduced during the amplification step. With full-genome sequencing becoming more accessible across a large number of individuals, we expect that STR-related diseases might receive more refined estimates of prevalence and disease penetrance in human populations.
Conflict of Interest
All authors are current or former employees of Human Longevity.
Acknowledgments
We thank Drs. John Lamping, James Yu, and Emily Wong for their helpful discussion during development.
Published: November 2, 2017
Footnotes
Supplemental Data include nine figures and four tables.
Contributor Information
J. Craig Venter, Email: jcventer@jcvi.org.
Amalio Telenti, Email: atelenti@humanlongevity.com.
Web Resources
EAGLE read simulator, https://github.com/sequencing/EAGLE
Genetic Testing Reference Materials Coordination Program (GeT-RM), https://wwwn.cdc.gov/clia/Resources/GETRM
Online Mendelian Inheritance in Man (OMIM), http://www.omim.org/
Server version of TREDPARSE, https://search.hli.io/tred (login: str@nada.email, password: Tandem)
Simulated BAMs for series of varying STR repeat sizes and sequencing depth, https://doi.org/10.6084/m9.figshare.5280988
Source code and documentation for TREDPARSE, https://github.com/humanlongevity/tredparse
Supplemental Data
Each worksheet contains a single STR locus. STR calls are in the form of “X | Y” for autosomal loci, and “X | null” for male individuals called at X-linked loci to indicate hemizygosity. Rows are highlighted in green for “correct,” in red for “error,” and in yellow for “missing.”
References
- 1.Fan H., Chu J.-Y. A brief review of short tandem repeat mutation. Genomics Proteomics Bioinformatics. 2007;5:7–14. doi: 10.1016/S1672-0229(07)60009-6. [DOI] [PMC free article] [PubMed] [Google Scholar]
- 2.Zhivotovsky L.A., Underhill P.A., Cinnioğlu C., Kayser M., Morar B., Kivisild T., Scozzari R., Cruciani F., Destro-Bisol G., Spedini G. The effective mutation rate at Y chromosome short tandem repeats, with application to human population-divergence time. Am. J. Hum. Genet. 2004;74:50–61. doi: 10.1086/380911. [DOI] [PMC free article] [PubMed] [Google Scholar]
- 3.Helgason A., Einarsson A.W., Guðmundsdóttir V.B., Sigurðsson Á., Gunnarsdóttir E.D., Jagadeesan A., Ebenesersdóttir S.S., Kong A., Stefánsson K. The Y-chromosome point mutation rate in humans. Nat. Genet. 2015;47:453–457. doi: 10.1038/ng.3171. [DOI] [PubMed] [Google Scholar]
- 4.Hares D.R. Selection and implementation of expanded CODIS core loci in the United States. Forensic Sci. Int. Genet. 2015;17:33–34. doi: 10.1016/j.fsigen.2015.03.006. [DOI] [PubMed] [Google Scholar]
- 5.Gymrek M., McGuire A.L., Golan D., Halperin E., Erlich Y. Identifying personal genomes by surname inference. Science. 2013;339:321–324. doi: 10.1126/science.1229566. [DOI] [PubMed] [Google Scholar]
- 6.Pellegrini M., Renda M.E., Vecchio A. Tandem repeats discovery service (TReaDS) applied to finding novel cis-acting factors in repeat expansion diseases. BMC Bioinformatics. 2012;13(Suppl 4):S3. doi: 10.1186/1471-2105-13-S4-S3. [DOI] [PMC free article] [PubMed] [Google Scholar]
- 7.Bolton K.A., Ross J.P., Grice D.M., Bowden N.A., Holliday E.G., Avery-Kiejda K.A., Scott R.J. STaRRRT: a table of short tandem repeats in regulatory regions of the human genome. BMC Genomics. 2013;14:795. doi: 10.1186/1471-2164-14-795. [DOI] [PMC free article] [PubMed] [Google Scholar]
- 8.Gymrek M., Willems T., Guilmatre A., Zeng H., Markus B., Georgiev S., Daly M.J., Price A.L., Pritchard J.K., Sharp A.J., Erlich Y. Abundant contribution of short tandem repeats to gene expression variation in humans. Nat. Genet. 2016;48:22–29. doi: 10.1038/ng.3461. [DOI] [PMC free article] [PubMed] [Google Scholar]
- 9.Zhang W., Yu Y.Y. Polymorphisms of short tandem repeat of genes and breast cancer susceptibility. Eur. J. Surg. Oncol. 2007;33:529–534. doi: 10.1016/j.ejso.2006.11.027. [DOI] [PubMed] [Google Scholar]
- 10.Huang M.N., McPherson J.R., Cutcutache I., Teh B.T., Tan P., Rozen S.G. MSIseq: Software for assessing microsatellite instability from catalogs of somatic mutations. Sci. Rep. 2015;5:13321. doi: 10.1038/srep13321. [DOI] [PMC free article] [PubMed] [Google Scholar]
- 11.Press M.O., Carlson K.D., Queitsch C. The overdue promise of short tandem repeat variation for heritability. Trends Genet. 2014;30:504–512. doi: 10.1016/j.tig.2014.07.008. [DOI] [PMC free article] [PubMed] [Google Scholar]
- 12.Raczy C., Petrovski R., Saunders C.T., Chorny I., Kruglyak S., Margulies E.H., Chuang H.Y., Källberg M., Kumar S.A., Liao A. Isaac: ultra-fast whole-genome secondary analysis on Illumina sequencing platforms. Bioinformatics. 2013;29:2041–2043. doi: 10.1093/bioinformatics/btt314. [DOI] [PubMed] [Google Scholar]
- 13.DePristo M.A., Banks E., Poplin R., Garimella K.V., Maguire J.R., Hartl C., Philippakis A.A., del Angel G., Rivas M.A., Hanna M. A framework for variation discovery and genotyping using next-generation DNA sequencing data. Nat. Genet. 2011;43:491–498. doi: 10.1038/ng.806. [DOI] [PMC free article] [PubMed] [Google Scholar]
- 14.Cao M.D., Tasker E., Willadsen K., Imelfort M., Vishwanathan S., Sureshkumar S., Balasubramanian S., Bodén M. Inferring short tandem repeat variation from paired-end short reads. Nucleic Acids Res. 2014;42:e16. doi: 10.1093/nar/gkt1313. [DOI] [PMC free article] [PubMed] [Google Scholar]
- 15.Gymrek M., Golan D., Rosset S., Erlich Y. lobSTR: A short tandem repeat profiler for personal genomes. Genome Res. 2012;22:1154–1162. doi: 10.1101/gr.135780.111. [DOI] [PMC free article] [PubMed] [Google Scholar]
- 16.Dolzhenko E., van Vugt J.J.F.A., Shaw R.J., Bekritsky M.A., van Blitterswijk M., Kingsbury Z., Humphray S.J., Schellevis R.D., Brands W.J., Baker M. Detection of long repeat expansions from PCR-free whole-genome sequence data. bioRxiv. 2016 doi: 10.1101/gr.225672.117. https://doi.org/10.1101/093831 [DOI] [PMC free article] [PubMed] [Google Scholar]
- 17.Chaisson M.J., Huddleston J., Dennis M.Y., Sudmant P.H., Malig M., Hormozdiari F., Antonacci F., Surti U., Sandstrom R., Boitano M. Resolving the complexity of the human genome using single-molecule sequencing. Nature. 2015;517:608–611. doi: 10.1038/nature13907. [DOI] [PMC free article] [PubMed] [Google Scholar]
- 18.Ashton P.M., Nair S., Dallman T., Rubino S., Rabsch W., Mwaigwisya S., Wain J., O’Grady J. MinION nanopore sequencing identifies the position and structure of a bacterial antibiotic resistance island. Nat. Biotechnol. 2015;33:296–300. doi: 10.1038/nbt.3103. [DOI] [PubMed] [Google Scholar]
- 19.Baudhuin L.M., Ferber M.J. Miniaturized nanopore DNA sequencing: Accelerating the path to precision medicine. Clin. Chem. 2017;63:632–634. doi: 10.1373/clinchem.2016.261420. [DOI] [PubMed] [Google Scholar]
- 20.Ummat A., Bashir A. Resolving complex tandem repeats with long reads. Bioinformatics. 2014;30:3491–3498. doi: 10.1093/bioinformatics/btu437. [DOI] [PubMed] [Google Scholar]
- 21.Doi K., Monjo T., Hoang P.H., Yoshimura J., Yurino H., Mitsui J., Ishiura H., Takahashi Y., Ichikawa Y., Goto J. Rapid detection of expanded short tandem repeats in personal genomics using hybrid sequencing. Bioinformatics. 2014;30:815–822. doi: 10.1093/bioinformatics/btt647. [DOI] [PMC free article] [PubMed] [Google Scholar]
- 22.Telenti A., Pierce L.C., Biggs W.H., di Iulio J., Wong E.H., Fabani M.M., Kirkness E.F., Moustafa A., Shah N., Xie C. Deep sequencing of 10,000 human genomes. Proc. Natl. Acad. Sci. USA. 2016;113:11901–11906. doi: 10.1073/pnas.1613365113. [DOI] [PMC free article] [PubMed] [Google Scholar]
- 23.Kojima K., Kawai Y., Misawa K., Mimori T., Nagasaki M. STR-realigner: a realignment method for short tandem repeat regions. BMC Genomics. 2016;17:991. doi: 10.1186/s12864-016-3294-x. [DOI] [PMC free article] [PubMed] [Google Scholar]
- 24.Zhao M., Lee W.P., Garrison E.P., Marth G.T. SSW library: an SIMD Smith-Waterman C/C++ library for use in genomic applications. PLoS ONE. 2013;8:e82138. doi: 10.1371/journal.pone.0082138. [DOI] [PMC free article] [PubMed] [Google Scholar]
- 25.Li H., Durbin R. Fast and accurate short read alignment with Burrows-Wheeler transform. Bioinformatics. 2009;25:1754–1760. doi: 10.1093/bioinformatics/btp324. [DOI] [PMC free article] [PubMed] [Google Scholar]
- 26.Goodman L.A. Some practical techniques in serial number analysis. J. Am. Stat. Assoc. 1954;49:97–112. [Google Scholar]
- 27.Lee S., Hormozdiari F., Alkan C., Brudno M. MoDIL: detecting small indels from clone-end sequencing with mixtures of distributions. Nat. Methods. 2009;6:473–474. doi: 10.1038/nmeth.f.256. [DOI] [PubMed] [Google Scholar]
- 28.Escalona M., Rocha S., Posada D. A comparison of tools for the simulation of genomic next-generation sequencing data. Nat. Rev. Genet. 2016;17:459–469. doi: 10.1038/nrg.2016.57. [DOI] [PMC free article] [PubMed] [Google Scholar]
- 29.Chen X., Schulz-Trieglaff O., Shaw R., Barnes B., Schlesinger F., Källberg M., Cox A.J., Kruglyak S., Saunders C.T. Manta: rapid detection of structural variants and indels for germline and cancer sequencing applications. Bioinformatics. 2016;32:1220–1222. doi: 10.1093/bioinformatics/btv710. [DOI] [PubMed] [Google Scholar]
- 30.Rubinsztein D.C., Leggo J., Coles R., Almqvist E., Biancalana V., Cassiman J.J., Chotai K., Connarty M., Crauford D., Curtis A. Phenotypic characterization of individuals with 30-40 CAG repeats in the Huntington disease (HD) gene reveals HD cases with 36 repeats and apparently normal elderly individuals with 36-39 repeats. Am. J. Hum. Genet. 1996;59:16–22. [PMC free article] [PubMed] [Google Scholar]
- 31.Auton A., Brooks L.D., Durbin R.M., Garrison E.P., Kang H.M., Korbel J.O., Marchini J.L., McCarthy S., McVean G.A., Abecasis G.R., 1000 Genomes Project Consortium A global reference for human genetic variation. Nature. 2015;526:68–74. doi: 10.1038/nature15393. [DOI] [PMC free article] [PubMed] [Google Scholar]
- 32.Hardwick S.A., Deveson I.W., Mercer T.R. Reference standards for next-generation sequencing. Nat. Rev. Genet. 2017;18:473–484. doi: 10.1038/nrg.2017.44. [DOI] [PubMed] [Google Scholar]
- 33.Pompanon F., Bonin A., Bellemain E., Taberlet P. Genotyping errors: causes, consequences and solutions. Nat. Rev. Genet. 2005;6:847–859. doi: 10.1038/nrg1707. [DOI] [PubMed] [Google Scholar]
- 34.Shao J., Diamond M.I. Polyglutamine diseases: emerging concepts in pathogenesis and therapy. Hum. Mol. Genet. 2007;16 Spec No. 2:R115–R123. doi: 10.1093/hmg/ddm213. [DOI] [PubMed] [Google Scholar]
- 35.Amiel J., Trochet D., Clément-Ziza M., Munnich A., Lyonnet S. Polyalanine expansions in human. Hum. Mol. Genet. 2004;13:R235–R243. doi: 10.1093/hmg/ddh251. [DOI] [PubMed] [Google Scholar]
- 36.Willems T., Gymrek M., Poznik G.D., Tyler-Smith C., Erlich Y., 1000 Genomes Project Chromosome Y Group Population-scale sequencing data enable precise estimates of Y-STR mutation rates. Am. J. Hum. Genet. 2016;98:919–933. doi: 10.1016/j.ajhg.2016.04.001. [DOI] [PMC free article] [PubMed] [Google Scholar]
- 37.de Die-Smulders C.E., de Wert G.M., Liebaers I., Tibben A., Evers-Kiebooms G. Reproductive options for prospective parents in families with Huntington’s disease: clinical, psychological and ethical reflections. Hum. Reprod. Update. 2013;19:304–315. doi: 10.1093/humupd/dms058. [DOI] [PubMed] [Google Scholar]
- 38.Harper A.R., Nayee S., Topol E.J. Protective alleles and modifier variants in human health and disease. Nat. Rev. Genet. 2015;16:689–701. doi: 10.1038/nrg4017. [DOI] [PubMed] [Google Scholar]
- 39.Maat-Kievit A., Losekoot M., Van Den Boer-Van Den Berg H., Van Ommen G.J., Niermeijer M., Breuning M., Tibben A. New problems in testing for Huntington’s disease: the issue of intermediate and reduced penetrance alleles. J. Med. Genet. 2001;38:E12. doi: 10.1136/jmg.38.4.e12. [DOI] [PMC free article] [PubMed] [Google Scholar]
- 40.Seltzer M.M., Baker M.W., Hong J., Maenner M., Greenberg J., Mandel D. Prevalence of CGG expansions of the FMR1 gene in a US population-based sample. Am. J. Med. Genet. B. Neuropsychiatr. Genet. 2012;159B:589–597. doi: 10.1002/ajmg.b.32065. [DOI] [PMC free article] [PubMed] [Google Scholar]
- 41.Delatycki M.B., Paris D., Gardner R.J., Forshaw K., Nicholson G.A., Nassif N., Williamson R., Forrest S.M. Sperm DNA analysis in a Friedreich ataxia premutation carrier suggests both meiotic and mitotic expansion in the FRDA gene. J. Med. Genet. 1998;35:713–716. doi: 10.1136/jmg.35.9.713. [DOI] [PMC free article] [PubMed] [Google Scholar]
Associated Data
This section collects any data citations, data availability statements, or supplementary materials included in this article.
Supplementary Materials
Each worksheet contains a single STR locus. STR calls are in the form of “X | Y” for autosomal loci, and “X | null” for male individuals called at X-linked loci to indicate hemizygosity. Rows are highlighted in green for “correct,” in red for “error,” and in yellow for “missing.”