Abstract
When global clinical trials are carried out, it is important to consider the influence of racial and ethnic differences on the outcome. From this viewpoint, global clinical trials in East Asia, where racial differences are estimated to be small, are now attracting close attention. Under such circumstances, we conducted a survey using the data registered with ClinicalTrial.gov to investigate the status of participation of East Asian countries in global clinical trials and differences in the regions selected for drug development between Japanese enterprises and non‐Japanese enterprises. This survey revealed that about 90% of all global clinical trials and those involving East Asian countries were sponsored by non‐Japanese enterprises. Global clinical trials involving only East Asia have been accepted as one of the development strategies by Japanese enterprises, but this strategy has not spread widely among non‐Japanese enterprises.
Study Highlights
WHAT IS THE CURRENT KNOWLEDGE ON THE TOPIC?
✓ Global clinical trials (GCTs) have been established as one of the drug development strategies in Japan and other regions. Close attention has been paid to GCTs in East Asian countries, where the racial difference is expected to be small.
WHAT QUESTION DID THIS STUDY ADDRESS?
✓ The contribution of East Asia to GCTs has gradually increased but the strategy for conduct of GCTs in East Asia differs markedly between Japanese enterprises and non‐Japanese enterprises.
WHAT THIS STUDY ADDS TO OUR KNOWLEDGE
✓ Japanese enterprises are less active in conducting GCTs but more focus on East Asia to accumulate data in the regional population.
HOW THIS MIGHT CHANGE CLINICAL PHARMACOLOGY OR TRANSLATIONAL SCIENCE
✓ GCTs will be further promoted by more active participation of East Asia to which the concept of “pooled regions” proposed in the draft ICH E17 guideline may be applied.
The percentage of approved drugs, whose pivotal data were collected from global clinical trials (GCTs), has steadily increased in Japan1 since the Japanese Ministry of Health, Labor and Welfare published the “Basic Principles on Global Clinical Trials” in 2007 to explain the importance of dose–response data in Japanese subjects and to recommend Japan's early participation in global drug development in response to its diversification.2 In 2012, a supplemental document to the 2007 guideline was also published to further clarify appropriate global drug development, specifically focusing on East Asia.3 These guidelines encouraged pharmaceutical enterprises to utilize more GCT data to obtain regulatory approval in Japan by providing more options for drug development strategies.4 Similarly, Khin et al. described regulatory and scientific issues regarding the use of foreign data in support of new drug applications to the US Food and Drug Administration.5 In 2009, a reflection paper was published to help extrapolate the results of clinical studies conducted outside the European Union to the EU population.6 These facts suggest that GCTs have become one of the major development strategies for regulatory review and approval of drugs. However, how East Asia/Japan, the United States, and Europe contribute to GCTs for regulatory submission of drug approval has not been well investigated. Drug development strategies are usually affected by the location of the sponsor's headquarters.7 As the importance of clinical trials transparency increases, the regulations at 42 CFR 11.22(a) require the registration of any applicable clinical trial on ClinicalTrials.gov on 26 December 2007. ClinicalTrials.gov has been well utilized as a tracking database of the basic results of clinical trials since then. Thus, in this study we examined the trend of GCTs in terms of operational regions on industry‐sponsored phase 2 (Ph2) and 3 (Ph3) clinical trials from 2008–2015 and analyzed differences in country selection for GCTs between Japanese and non‐Japanese pharmaceutical enterprises.
METHODS
Definition
In this study, the following definitions were given:
GCT: a clinical trial requiring permission from two or more regulatory authorities for implementation. East Asia: Japan, Korea, China, Hong Kong, and Chinese Taipei. East Asia‐involving GCT: GCT in which at least one country/region of East Asia participated. US‐involving GCT: GCT in which the United States participated. EUR‐involving GCT: GCT in which any of the three European countries having a large number of clinical trials (Germany, France, and the United Kingdom) participated. East Asian GCT: GCT wherein the operational area of the clinical trial is limited to only East Asia.
Data source and analysis
Data between 1 January 2008 and 31 December 2015 were downloaded from “ClinicalTrials.gov” on 30 March 2016. Criteria for data selection were industry‐funded Ph2 and Ph3 studies. GCTs that had missing information on country name and/or start date were excluded from the analysis. Studies involving multiple phases (e.g., Ph1/Ph2 or Ph2/Ph3) were analyzed as a later‐phase study. Annual data were analyzed on the basis of the start date. The population ratio was calculated by dividing the number of GCTs in each country (the United States, Germany, the United Kingdom, France, China, Japan, and Korea) by the national population in 2011, then multiplying by one hundred million. When analyzing types of sponsors, the 10 largest Japanese enterprises (JEs) and non‐Japanese enterprises (nJEs) were selected according to 2015 sales in Japan,8 i.e., JEs: Takeda, Astellas, Daiichi Sankyo, Chugai, Otsuka, Mitsubishi Tanabe, Eisai, Kyowa Hakko Kirin, Sumitomo Dainippon, and Shionogi and nJEs: Pfizer, Merck, Novartis, GSK, Eli Lilly, Bayer, Gilead, Sanofi, BMS, and AstraZeneca. Statistical analysis was performed using the Cochran–Armitage test for trend, the logistic regression analysis, and Fisher's exact test, The Cochran–Armitage trend test was performed based on the assumption of data linearity to reveal the trend in proportion of Ph2 and Ph3 East Asia‐involving GCTs among all GCTs sponsored by nJEs and JEs at both Ph2 and Ph3. The logistic regression analysis was performed to examine the difference in the region selection for Ph2 and Ph3 clinical trials sponsored by nJEs and JEs. Fisher's exact test was performed to examine the association between nJEs and JEs in case of selecting only East Asia as a development region. A P value of less than 0.05 was considered statistically significant. All statistical analyses were conducted using SAS, v. 9.4. (SAS Institute, Cary, NC). These analyses were performed without formal hypotheses set prior to the conduct of the study, but the proposed statistical analyses were conducted as part of the descriptive analyses to understand the trends of GCTs in Japan and East Asia.
RESULTS
Based on the criteria (see “Methods”), 1,310 Ph2 and 1,634 Ph3 trials were selected for our surveys.
Number of clinical trials in each phase conducted in each region
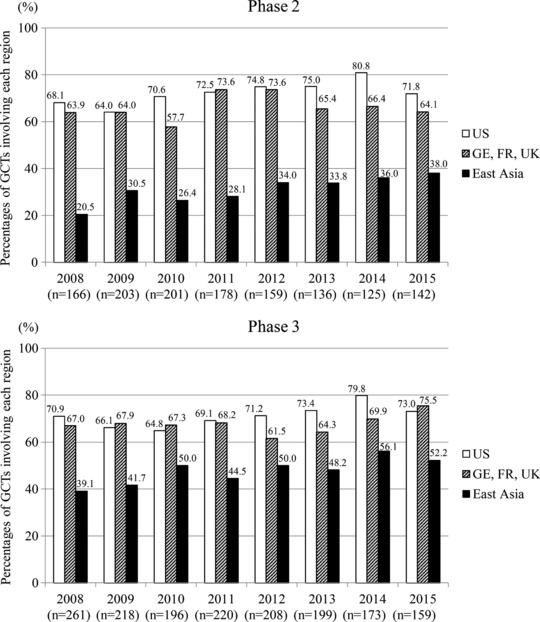
Figure 1 shows changes over time in the percentage of Ph2 and Ph3 GCTs involving 1) the United States, 2) any of the three European countries having a large number of clinical trials (Germany, France, and the United Kingdom), or 3) any of the East Asian countries/regions. More than 60% of GCTs have been steadily conducted in the United States and Europe, whereas in East Asia it was less frequent. However, increases in the percentage point (numerical difference of two percentages, hereafter referred to as “pp”) of Ph2 and Ph3 GCTs between 2008 and 2015 were larger in East Asia (17.5 pp and 13.1 pp for Ph2 and Ph3, respectively) than in the United States (3.7 pp and 2.1 pp for Ph2 and Ph3, respectively) and Europe (0.2 pp and 8.5 pp for Ph2 and Ph3, respectively).
Figure 1.

Time courses of the percentages of phase 2 and phase 3 GCTs sponsored by 20 companies, involving 1) the United States, 2) any of the three European countries having a large number of clinical trials (Germany, France, and the United Kingdom), or 3) any of the East Asian countries/regions.
Changes over time in the population ratio of the number of clinical trials in each phase
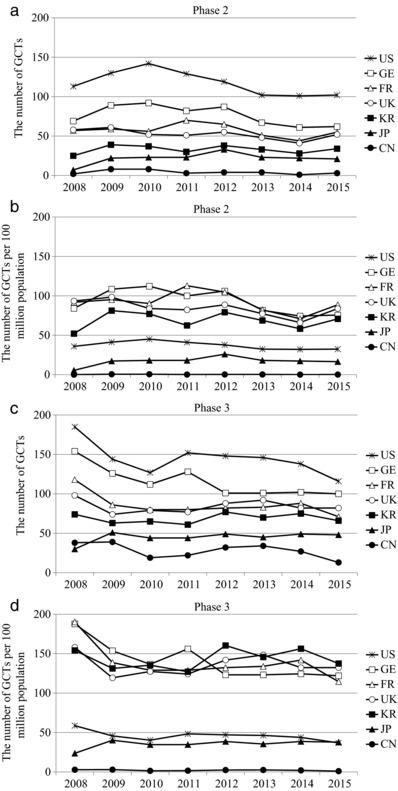
Figure 2 shows the changes over time in the number of Ph2 and Ph3 GCTs and their population ratio (the number of GCTs per one hundred million population of each country) in the United States, Germany, the United Kingdom, France, China, Japan, and Korea. The United States had the most GCTs, but the ratio was positioned roughly at the middle among the other countries. Korea was close to Japan in terms of the number of GCTs. However, the ratio in Korea, which was among the highest for countries in Ph3 trials, was markedly higher than that in Japan and similar to that in Europe in Ph2 trials. Compared with the United States, the ratio in Japan was lower in Ph2 trials but similar in Ph3 trials. The ratio in China remained the lowest among the countries.
Figure 2.

Time courses of the number of GCTs (a,c) and GCTs per 100 million population (b,d) in the United States, Germany, France, the United Kingdom, Korea, Japan, and China. a,b: data for phase 2; and c,d: data for phase 3 GCTs. GCTs: Global clinical trials.
Trend of clinical trials sponsored by Japanese enterprises (JEs) and non‐Japanese enterprises (nJEs)
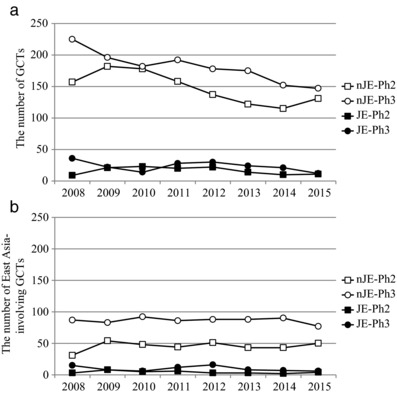
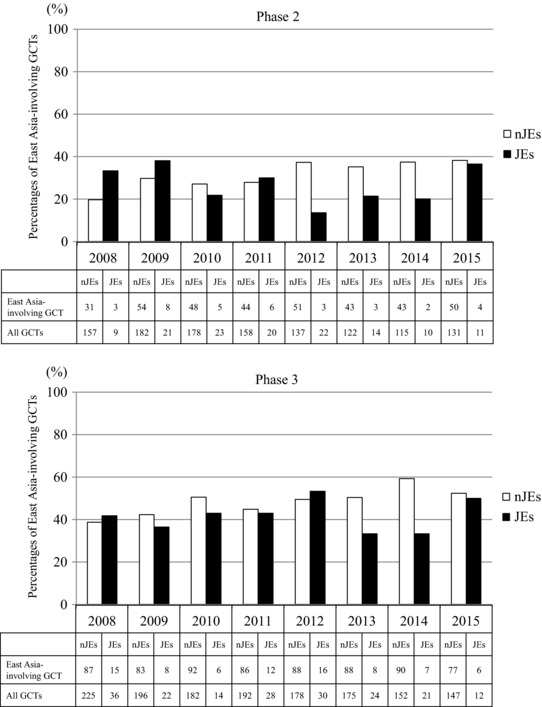
To investigate how JEs and nJEs conduct GCTs in the East Asian region, the number and percentage of Ph2 and Ph3 East Asia‐involving GCTs (see definition in “Methods”) were calculated by the type of sponsor (JEs and nJEs). The 10 largest JEs and nJEs (see definition in “Methods”) were selected for the comparison according to 2015 sales in Japan, the most important brand‐name drug market in Asia because the main purpose of this research was to investigate the drug development status in Asia. As shown in Figure 3 a, the number of GCTs was markedly larger in nJE‐sponsored trials than in JE‐sponsored ones and had gradually decreased in all types of trials. The total number of Ph2 and Ph3 GCTs sponsored by JEs between 2008 and 2015 was 130 and 187, respectively, accounting for only 9.9% and 11.4% of all GCTs sponsored by both JEs and nJEs. Focusing on East Asia, the total number of Ph2 and Ph3 East Asia‐involving GCTs sponsored by nJEs during that period was 364 and 691, respectively, accounting for 30.8% and 47.8% of all GCTs sponsored by nJEs. Similarly, the total number of Ph2 and Ph3 East Asia‐involving GCTs sponsored by JEs during that period was 34 and 78, respectively, accounting for 26.2% and 41.7% of all GCTs sponsored by JEs (Figure 3 b). The data indicate that both JEs and nJEs sponsored more Ph3 than Ph2 East Asia‐involving GCTs. Looking at data from a different perspective, the number of Ph2 and Ph3 East Asia‐involving GCTs sponsored by JEs was 34 and 78, respectively, accounting for only 8.5% and 10.1% of all East Asia‐involving GCTs sponsored by both JEs and nJEs. Furthermore, a significant upward trend was observed in the percentage of Ph2 and Ph3 East Asia‐involving GCTs among all GCTs sponsored by nJEs (P < 0.0001) but not in that of Ph2 and Ph3 East Asia‐involving GCTs sponsored by JEs (Figure 4). It should be noted, however, that a significant trend in JEs to select East Asian GCTs (see definition in “Methods”) rather than the other types of GCTs such as East Asia‐involving GCTs and US‐involving GCTs was observed. Although only about 10% of GCTs were sponsored by nJEs, logistic regression analysis comparing East Asian GCTs with other type of clinical trials revealed significant trend in JEs to select East Asian GCTs at both Ph2 and Ph3 (Table 1). Furthermore, the total number of Ph2 and Ph3 East Asian GCTs sponsored by JEs between 2008 and 2015 was nine and 14, respectively, accounting for 26.5% and 17.9% of all East Asia‐involving GCTs sponsored by JEs. The total number of Ph2 and Ph3 East Asian GCTs sponsored by nJEs during that period was 13 and 26, respectively, accounting for 3.6% and 3.8% of all East Asia‐involving GCTs sponsored by nJEs. The data revealed that the ratio of East Asian GCTs in East Asia‐involving GCTs by JEs were significantly higher than that of nJEs using Fisher's exact test (P < 0.0001).
Figure 3.

Different time courses of the number of GCTs (a) and East Asia‐involving GCTs (b) sponsored by nJEs and JEs. GCTs: Global clinical trials, nJEs: non‐Japanese enterprises, JEs: Japanese enterprises, Ph2: phase 2, Ph 3: phase 3.
Figure 4.

Time courses of the percentages of East Asia‐involving GCTs among all GCTs sponsored by JEs and nJEs. A Cochran–Armitage trend test based on the assumption of data linearity revealed a significant upward trend of the percentage of East Asia‐involving GCTs sponsored by nJEs at both phase 2 and phase 3 (P < 0.0001). GCTs: Global clinical trials, nJEs: non‐Japanese enterprises, JEs: Japanese enterprises.
Table 1.
Difference in the region selection for Ph2 and Ph3 clinical trials sponsored by nJEs and JEs
| Ph2 | Ph3 | |||||||
|---|---|---|---|---|---|---|---|---|
| nJEs | JEs | The ratio of JEs to nJEsa | P valueb | nJEs | JEs | The ratio of JEs to nJEsa | P valueb | |
| All GCTs | 1,180 | 130 | 0.11 | <.0001 | 1447 | 187 | 0.13 | <.0001 |
| US‐involving GCTs | 860 | 78 | 0.09 | <.0001 | 1035 | 121 | 0.12 | <.0001 |
| EUR‐involving GCTs | 795 | 68 | 0.09 | <.0001 | 991 | 111 | 0.11 | <.0001 |
| East Asia‐involving GCTs | 364 | 34 | 0.10 | <.0001 | 691 | 78 | 0.11 | <.0001 |
| US only clinical trials | 474 | 65 | 0.14 | 0.0003 | 222 | 45 | 0.20 | 0.0076 |
| East Asian GCTs | 13 | 9 | 0.69 | ― | 26 | 14 | 0.54 | ― |
GCTs: Global clinical trials, nJEs: non‐Japanese enterprises, JEs: Japanese enterprises, Ph2: phase 2, Ph3: phase 3.
The ratio of JEs to nJEs is calculated by dividing JEs by nJEs.
P values were calculated using logistic regression analysis to compare the ratio of JEs to nJEs of each type of clinical trial with the ratio of East Asian GCTs.
DISCUSSION
This study indicates that the contribution of East Asia to GCTs has gradually increased, resulting in further diversification of clinical trials through the addition of new countries and regions to GCTs. Nevertheless, the United States and Europe remain major regions for implementation of GCTs. Among the East Asian countries, Korea had the most active population ratio for the number of GCTs. This could be due to governmental efforts, such as the Korea National Enterprise for Clinical Trials (KoNECT), to establish infrastructure for clinical trials.9 It was quite surprising that both the number and ratio of GCT activities in China were the lowest, despite its large market for drugs. The China Food and Drug Administration takes ∼1.5 years to review clinical trial applications.10 This would limit the opportunity of China to participate in GCTs. However, in 2015 the Chinese government published a statement that encouraged China's involvement in conducting GCTs.11 Thus, China may more actively implement GCTs in the near future because of its potentially large market. Low ratios in Japan and China also suggest the possibility for further improving GCT implementation. More guidelines, in addition to those currently available,2, 3, 12, 13 may promote East Asia‐involving GCTs, thereby providing more drugs to patients.
Regarding the differences among GCTs, ∼10% of all East Asia‐involving GCTs, as well as all GCTs, have been sponsored by JEs, whereas the other 90% have been sponsored by nJEs. There are a couple of reasons for the high activities of nJE‐sponsored East Asia‐involving GCTs, including an attractive market size, established clinical trial infrastructure that complies with Good Clinical Practice, sufficient patients for effective recruitment, and regulatory acceptance of foreign population data. More contributions to GCTs by East Asia could be expected because a significant upward trend in nJE‐sponsored East Asia‐involving GCTs was observed. Activities of JE‐sponsored East Asia‐involving GCTs were still low, but the proportion of East Asian GCTs was significantly higher in JEs than in nJEs. These results suggest that nJEs seem to include East Asia as one of the many regions wherein they conduct GCTs, whereas JEs focus more on the East Asian region to accumulate data in the regional population. The differences in country selection for GCTs between JEs and nJEs may be attributed to drug class, therapeutic area, and market strategy rather than the difference of nationality of the enterprise. However, it is noteworthy that the trend for East Asian GCTs differed markedly between JEs and nJEs. Recently, the number of our own subjects enrolled in GCTs has decreased not only in Japan but also in the United States and Europe1, 6, 13 Proper planning and design of GCTs would be important for accumulating scientific evidence for the regulation of drug efficacy and safety. In this regard, the ICH E17 guideline14 is currently under development, with the current draft highlighting the importance of considering ethnic factors and consistency of evaluation among different populations. It also proposes pooling different populations with similar ethnic backgrounds. Also, studies on ethnic factors have showed similarities among East Asian populations.15, 16, 17, 18 GCTs will be further promoted by globally implementing the E17 guideline, including the concept of “pooled regions,” which may apply to East Asia. More active participation of East Asia to GCTs from an exploratory stage will provide better scientific data to understand the impact of ethnic factors on drug responses and to more appropriately design a confirmatory GCT.
We presented an analysis of the region selection for GCTs, with a special focus on clinical trial conduct in East Asia. Although the analysis does not consider the outcome of the health authority review or the status of clinical trials (e.g., ongoing, completed, or terminated), given the purpose of the study, further research is necessary to reveal the impact of the clinical trial region on the outcome. Also, further discussions among industries, academia, and government will be needed to determine the ideal form of East Asian GCTs for efficient drug development.
Acknowledgments
The views and opinions expressed here are those of the authors and do not necessarily reflect those of any organization with which the author is employed or affiliated.
Conflict of Interest
The authors declare no conflicts of interest with respect to the research, authorship, and/or publication of this article.
Author Contributions
K.M. and Y.U. wrote the article; K.M. designed the research; K.M., Y.U., and H.H. performed the research; Y.S. analyzed the data.
[Correction added on 21 July 2017, after first online publication: Figure labels ‘a’ and ‘b’ added to Figure 3.]
References
- 1. Asano, K. , Tanaka, A. , Sato, T. & Uyama, Y. Regulatory challenges in the review of data from global clinical trials: The PMDA perspective. Clin. Pharmacol. Ther. 94, 195–198 (2013). [DOI] [PubMed] [Google Scholar]
- 2. Ministry of Health, Labour, and Welfare . Basic principles on global clinical trials. Notification 0928010 (28 September 2007). http://www.pmda.go.jp/files/000153265.pdf Accessed February 12, 2017.
- 3. Ministry of Health, Labour, and Welfare . Basic Principles on Global Clinical Trials (Reference Cases). Administrative Notice (5 September 2012). http://www.nihs.go.jp/mss/Kokusaikyodo-2.pdf. Accessed February 12, 2017.
- 4. Ando, Y. & Uyama, Y. Multiregional clinical trials: Japanese perspective on drug development strategy and sample size for Japanese subjects. J. Biopharm. Stat. 22, 977–987 (2012). [DOI] [PubMed] [Google Scholar]
- 5. Khin, N.A. et al Regulatory and scientific issues regarding use of foreign data in support of new drug applications in the United States: An FDA perspective. Clin. Pharmacol. Ther. 94, 230–242 (2013). [DOI] [PubMed] [Google Scholar]
- 6. Committee for medicinal products for human use (CHMP) . Reflection paper on the extrapolation of results from clinical studies conducted outside the EU to the EU‐population. Doc. Ref. EMEA/CHMP/EWP/692702/2008 (22 October 2009). http://www.ema.europa.eu/docs/en_GB/document_library/Scientific_guideline/2009/11/WC500013468.pdf. Accessed February 12, 2017.
- 7. Poirier, A.F. Closing the drug lag for new drug submission and review in Japan: An industry perspective. Clin. Pharmacol. Ther. 98, 486–8 (2015). [DOI] [PubMed] [Google Scholar]
- 8. IMS Health (in Japanese). Top 20 pharmaceutical companies by sales in Japan. https://www.ims-japan.co.jp/japanese/topline/dl/ToplineData_CY_2015.pdf. Accessed February 12, 2017.
- 9. KoNECT Clinical trial status in Korea (2014) (available only in Japanese and Korean).
- 10. CIRS . Understanding the dynamics of China's medicine regulatory environment (June 2015). http://www.cirsci.org/sites/default/files/CIRS_RD_Briefing_56_15062015.pdf. Accessed February 12, 2017.
- 11. State Council of the People's Republic of China . Opinions of the State Council on Reforming the Evaluation and Approval System for Drugs and Medical Devices. State Council Document 2015. No.44 (18 August 2015).
- 12. Ministry of Health, Labour, and Welfare . Basic Principles for Conducting Phase I Trials in the Japanese Population Prior to Global Clinical Trials. Administrative Notice https://www.pmda.go.jp/files/000157777.pdf (2014). Accessed February 12, 2017.
- 13. China Food and Drug Administration . Guidance for International Multicenter Clinical Trials (IMCT) (Trial Implementation). China Food and Drug Administration Announcement No.2, 2015. (January 30, 2015).
- 14. International Conference on Harmonization . General principles for planning and design of multi‐regional clinical trials E17. http://www.ich.org/fileadmin/Public_Web_Site/ICH_Products/Guidelines/Efficacy/E17/ICH_E17_draft_Step_1.pdf (2016). Accessed February 12, 2017.
- 15. Kurose, K. , Sugiyama, E. & Saito, Y. Population differences in major functional polymorphisms of pharmacokinetics/pharmacodynamics‐related genes in Eastern Asians and Europeans: Implications in the clinical trials for novel drug development. Drug Metab. Pharmacokinet. 27, 9–54 (2012). [DOI] [PubMed] [Google Scholar]
- 16. Hasunuma, T. et al Absence of ethnic differences in the pharmacokinetics of moxifloxacin, simvastatin, and meloxicam among three East Asian populations and Caucasians. Br. J. Clin. Pharmacol. 81, 1078–1090 (2016). [DOI] [PMC free article] [PubMed] [Google Scholar]
- 17. Myrand, S.P. et al Pharmacokinetics/genotype associations for major cytochrome P450 enzymes in native and first‐ and third‐generation Japanese populations: Comparison with Korean, Chinese, and Caucasian populations. Clin. Pharmacol. Ther. 84, 347–361 (2008). [DOI] [PubMed] [Google Scholar]
- 18. Man, M. et al Genetic variation in metabolizing enzyme and transporter genes: Comprehensive assessment in 3 major East Asian subpopulations with comparison to Caucasians and Africans. J. Clin. Pharmacol. 50, 929–940 (2010). [DOI] [PubMed] [Google Scholar]


