

Summary
mTORC1 is a central growth regulator that senses amino acids through a pathway that converges on the Rag GTPases, an obligate heterodimer of two related GTPases. Despite their central role in amino acid sensing, it is unknown why the Rag GTPases are heterodimeric and if their subunits communicate with each other. Here, we find that the binding of GTP to one subunit inhibits the binding and induces the hydrolysis of GTP by the other. This intersubunit communication pushes the Rag GTPases into either of two stable configurations, which represent active “on” or “off” states that interconvert via transient intermediates. Subunit coupling confers on the mTORC1 pathway its capacity to respond rapidly to the amino acid level. Thus, the dynamic response of mTORC1 requires intersubunit communication by the Rag GTPases, providing a rationale for why they exist as a dimer and revealing a distinct mode of control for a GTP-binding protein.
eTOC blurb
The Rag GTPase heterodimer transmits amino acid signals to mTORC1. It is distinct from canonical small signaling GTPases because of its obligate heterodimeric nature. Shen et al. used the kinetic method to analyze communication between Rag GTPase subunits, revealing a unique intersubunit locking mechanism that controls its nucleotide state.

Introduction
mTOR Complex I (mTORC1) is a central regulator of cell growth and proliferation. Diverse inputs, including amino acids, growth factors, and energy levels, converge on mTORC1 to regulate its kinase activity and signal to downstream effectors (Efeyan et al., 2015; González and Hall, 2017; Jewell et al., 2013; Shaw and Cantley, 2006). Upon activation, mTORC1 triggers anabolic processes, such as protein synthesis and ribosomal biogenesis, and inhibits catabolic ones, such as autophagy (Dibble and Manning, 2013). Dysregulation of mTORC1 promotes aberrant growth and contributes to numerous human diseases, including cancer and neurological disorders like epilepsy (Wong, 2013). mTORC1 activation requires two steps controlled by distinct small GTPases: translocation of mTORC1 to the lysosomal surface and stimulation of its kinase activity. In the presence of amino acids, the Rag GTPases recruit mTORC1 to the lysosome (Sancak et al., 2008; Wang et al., 2005), where, if growth factors are present, the Rheb GTPase turns on its kinase activity (Inoki et al., 2003; Li et al., 2004; Menon et al., 2014; Saito et al., 2005; Saucedo et al., 2003; Stocker et al., 2003). Thus, these two GTPases form an AND gate that ensures that mTORC1 is active only under favorable growth conditions.
Within the Ras-like superfamily of GTPases, the Rag GTPases belong to the TRAFAC (translation factor-related) class due to a conserved threonine residue on the lateral side of the nucleotide-binding pocket (Thr35 in Ras; Thr42 and Thr97 in RagA and RagC, respectively) (Leipe et al., 2002; Shan, 2016). However, unlike other characterized members of the superfamily, the Rag GTPases form obligate heterodimers consisting of RagA or RagB bound to RagC or RagD, and so each functional unit can bind two guanine nucleotides (Nakashima et al., 1999; Schürmann et al., 1995). Distinct from the signal recognition particle (SRP) and its receptor (SR), which toggle between monomeric and dimeric forms during the protein targeting cycle, there is no evidence that within cells the Rag GTPase heterodimer ever dissociates into stable monomers. Several multi-protein complexes regulate the Rag GTPases, including Ragulator, which localizes them to the lysosomal surface and modulates their nucleotide loading (Sancak et al., 2010), and the GATOR1 (Bar-Peled et al., 2013; Panchaud et al., 2013) and FLCN-FNIP2 (Petit et al., 2013; Tsun et al., 2013), which are GAPs for RagA/B and RagC/D, respectively.
Previous studies in cells found that the Rag heterodimer is active and capable of interacting with mTORC1 when RagA/B is bound to GTP and RagC/D to GDP (GTPRagA-RagCGDP). In contrast, the opposite nucleotide configuration (GDPRagA-RagCGTP) weakens the interaction with mTORC1 so that it does not localize to lysosomes and the pathway is suppressed (Sancak et al., 2008). It is unclear if, out of the four possible nucleotide states, these are the only two in which the Rag GTPase heterodimer can exist. Moreover, in general, why the Rag GTPases are heterodimeric and if intersubunit communication occurs, and, if so, how it interfaces with the actions of the extrinsic regulators are all open questions.
Here, we used kinetic analyses to quantitatively dissect the functional cycle of the Rag GTPases. We find that the Rag heterodimer uses a previously un-described mode of regulation for GTPases—extensive intersubunit communication—to transmit upstream signals to mTORC1. This mechanism has two key properties: the binding of GTP to one of the Rag subunits inhibits the association of GTP to the other; and, if an unwanted binding event does occur, the pre-bound GTP triggers the hydrolysis of the later-bound GTP, which maintains the original state by destabilizing the GTPRagA-RagCGTP configuration. We find that intersubunit communication is critical for the mTORC1 pathway to rapidly respond to the presence and absence of amino acids, providing a possible explanation for the evolutionary advantage of the heterodimeric architecture of the Rag GTPases.
Results
The binding of GTP to the Rag GTPase heterodimer induces conformational changes that inhibit its dissociation
To examine potential communication between the subunits of the Rag GTPase heterodimer it was necessary to develop an assay in which the nucleotide state of each could be quantitatively assessed in the context of the intact complex. Each Rag subunit has an N-terminal nucleotide binding domain (NBD) with a similar structural fold to Ras, and a C-terminal roadblock domain (CRD) that mediates heterodimerization (Figure 1A) (De Franceschi et al., 2014; Gong et al., 2011; Jeong et al., 2012; Levine et al., 2013). Expression of individual subunits in bacteria did not yield soluble proteins (data not shown), probably due to the exposure of hydrophobic residues on the CRD that mediate heterodimer formation. In contrast, co-expression of codon-optimized, C-terminally His-tagged RagA and tagless RagC in the pETDuet-1 vector (Figure 1B) generated a stable complex that could be isolated at the high purity needed for biochemical studies (Figure 1C and D).
Figure 1. Quantitative measures of the nucleotide binding properties of the Rag GTPases.
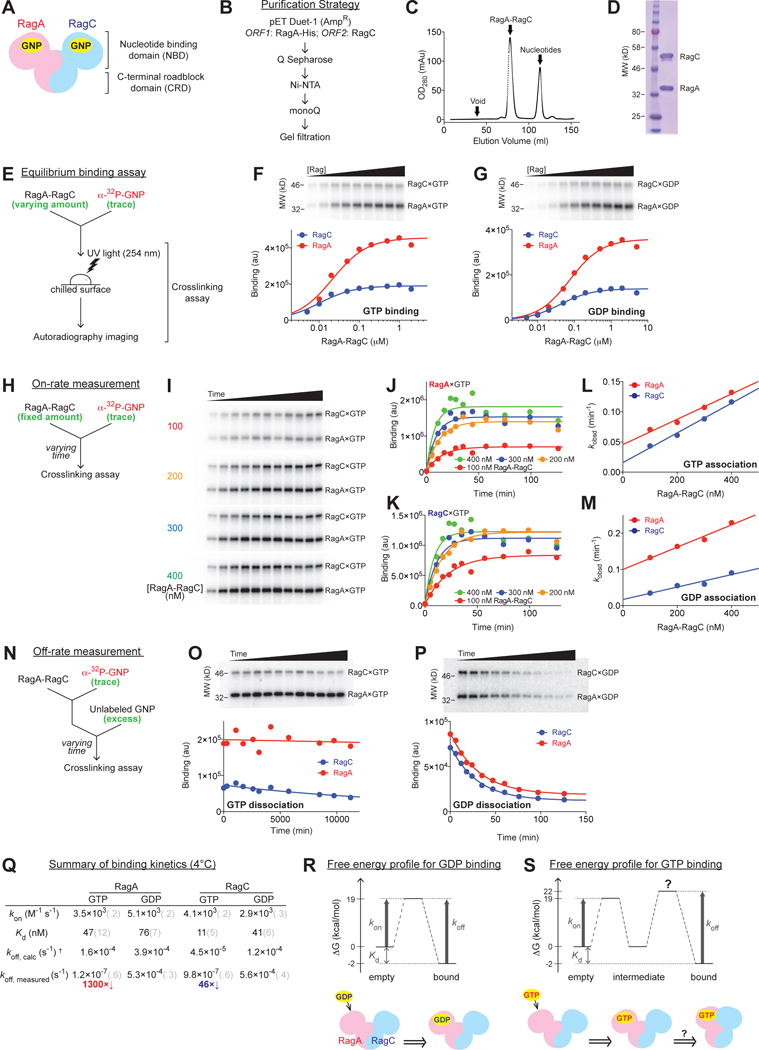
(A) General architecture and domain organization of the Rag GTPase heterodimer. GNP: guanosine di/tri-phosphate.
(B) Generation of recombinant Rag GTPases in bacteria.
(C) Elution profile of the Rag GTPase heterodimer on a HiLoad 16/60 Superdex 200 gel-filtration column. After EDTA stripping, the Rag heterodimer separates from its bound nucleotides and emerges as a single peak as indicated.
(D) SDS-PAGE and Coomassie blue staining analysis of purified Rags.
(E) Experimental setup of the crosslinking assay for measuring the nucleotide binding affinity of each Rag subunit.
(F–G) GTP (F) and GDP (G) binding to the Rag GTPases. Top panels: nucleotide bound to RagA (lower bands, MW = 37 kDa) and RagC (upper bands, MW = 44 kDa) visualized by autoradiography. Bottom panels: quantification of the radioactive signals from the top panels. Data were fit to a single-site binding equation to obtain the dissociation constant Kd.
(H) Experimental setup of the crosslinking assay for measuring the on-rates of nucleotides to the Rag GTPases.
(I) Reaction time-course of GTP bound to Rag subunits during an on-rate measurement. Four Rag concentrations (100, 200, 300, and 400 nM) are shown from top to bottom panels, where time points were taken to monitor the reaction process. At higher Rag concentrations, reactions reach equilibrium faster.
(J–K) Quantification of the observed rate constants for GTP association to RagA (J) and RagC (K) at different Rag concentrations. A single exponential rise function was used to fit the time points shown in 1I. Curve colors match with the corresponding Rag concentrations in 1I.
(L–M) On-rates for GTP (L) and GDP (M) to the Rag GTPase heterodimer. Linear regression of the observed rate constants (values obtained from 1J and 1K for GTP association, from Supplementary Figure 1E and 1F for GDP association) against Rag concentration gives the slope (kon) for RagA (red) and RagC (blue).
(N) Experimental setup of the crosslinking assay for measuring the off-rates of nucleotides from the Rag GTPases.
(O–P) Reaction time-course of radioactively labeled nucleotides remaining bound to Rag subunits during the off-rate measurement of GTP (O) and GDP (P) dissociation. Top panels: SDS-PAGE resolves nucleotide bound to RagA (lower bands) and RagC (upper bands) in the presence of unlabeled nucleotides as a chase. Bottom panels: quantification. Data were fit to a single exponential decay to extract the off-rates (koff).
(Q) Summary of binding kinetics of nucleotides to the Rag GTPases at 4 °C. Grey numbers in parenthesis denote the standard deviations of the reported values calculated from at least three independent experiments.
(R–S) Free energy profiles and models for GDP (R) and GTP (S) binding to the Rag GTPases. In the case of GDP binding (R), the matched predicted and measured koff values suggest a single energy barrier. In the case of GTP binding (S), a second barrier is required to explain the discrepancy between the predicted and measured koff values.
The fact that RagA and RagC have substantially different molecular weights and that UV light can covalently cross-link nucleotides to GTPases (Yue and Schimmel, 1977), enabled us to develop an assay for measuring, within intact complexes, the binding of radiolabeled nucleotides to each subunit at the same time (Fig 1E, see methods). At the end of the binding reaction we expose samples to UV light and use SDS-PAGE followed by autoradiography to quantitate the amounts of radiolabeled nucleotides bound to each Rag subunit (Figure 1F). As expected, unlabeled GTP competed with the binding of radiolabeled guanine nucleotides to RagA and RagC (Supplementary Figure 1A), and in heterodimers in which RagA or RagC had a mutation that mimics the Ras(S17N) mutant that does not bind GTP (RagA T21N; RagC S75N) (Feig and Cooper, 1988; Sancak et al., 2008), GTP bound only to the wildtype subunit (Supplementary Figures 1B and 1C).
Within the heterodimer, RagC binds GTP with a Kd of 11 nM, about fourfold tighter than RagA, and both bind GDP slightly less well than GTP (Figure 1F and 1G, summarized in Figure 1Q). These Kd values are orders of magnitudes lower than the cellular concentration of GTP (~ 0.7 mM), suggesting that mechanisms must exist to prevent both subunits from being loaded with GTP as the active heterodimer is in the GTPRagA-RagCGDP state.
To understand nucleotide binding in more detail, we examined pre-steady state kinetics by measuring the nucleotide association and dissociation rates of the Rag GTPases (Fersht, 1999; Feuerstein et al., 1987; Nowak and Goody, 1988; Simon et al., 1996). For the on-rate measurement (Figure 1H) we monitored nucleotide association to Rag subunits over time (Figure 1I and Supplementary Figure 1D). Linear regression of the observed reaction rates (kobsd, Figure 1J, 1K for GTP and Supplementary Figure 1E, 1F for GDP) against Rag concentrations generated the secondary reaction rate constants kon, which reveal that RagA and RagC associate with guanine nucleotides at very similar rates (Figure 1L for GTP, 1M for GDP, summarized in Figure 1Q). We measured the off-rate in a pulse-chase setup (Figure 1N), in which pre-loaded labeled GTP on the Rags was chased by an excess of unlabeled GTP (koff, Figure 1O for GTP, 1P for GDP). Despite the similar binding affinities and on-rates, GTP dissociates from the Rags much more slowly than GDP, with a 600–4000 fold difference (Figure 1Q).
Careful examination of the kinetics data revealed a surprising discrepancy (Figure 1Q). If the binding of nucleotides to the Rag GTPases involves a single transition state, the dissociation constant, and the on- and off-rates should conform to the equation Kd = koff / kon. This prediction holds true for GDP, where the calculated koff matches well with the measured koff (Figure 1Q), suggesting that GDP binding does indeed overcome one transition state (Figure 1R). However, the measured koff for GTP is 1300- and 46-fold slower than the calculated one for RagA and RagC, respectively (Figure 1Q, GTP koff, calc vs. koff, measured). This discrepancy suggests that the binding of GTP, but not GDP, induces conformational changes in the heterodimer beyond the local ones on Switch I/II that are common to small GTP binding proteins (Hall et al., 2002; Vetter et al., 1999), and that these prevent GTP dissociation (Figure 1S). To our knowledge this second transition state has not been observed in monomeric GTPases, suggesting that it is a result of the heterodimeric architecture of the Rag GTPases.
The binding of a single GTP to the Rag GTPase heterodimer inhibits the binding of a second GTP
To understand the consequences of GTP binding to the Rag heterodimer it was necessary to characterize its singly GTP-loaded state in vitro by combining the crosslinking assay with Rag mutants that preferentially bind xanthine instead of guanine nucleotides (RagA D130N; RagC D181N) (Figure 2A) (Hwang and Miller, 1987; Sweet and Gerace, 1996). Surprisingly, when RagA(D130N) in the RagA(D130N)-RagC heterodimer was bound to XTP instead of XDP, the wildtype RagC partner bound less GTP (Figure 2B). In the reverse direction this observation also holds for the RagA-RagC(D181N) heterodimer (Supplementary Figure 2A), suggesting that nucleoside triphosphate binding to one subunit (RagA or RagC) inhibits nucleoside triphosphate binding to the other (RagC or RagA). As a control experiment, we switched the sequence of binding (Figure 2C): once RagC was already loaded with GTP, the subsequent binding of XTP or XDP to RagA(D130N) had no observable effect on the amount of pre-loaded GTP (Figure 2D), indicating that the binding of the first nucleoside triphosphate has dominant consequences.
Figure 2. Intersubunit crosstalk maintains singly GTP-loaded state of the Rag GTPase heterodimer.

(A) Experimental setup for a sequential binding assay to probe the effect of xanthine nucleotide-loaded RagA on guanine nucleotide binding to RagC. Rag mutants with modified hydrogen-bonding pattern decouple nucleotide binding to the subunits.
(B) XTP loading on RagA(D130N) inhibits GTP binding to RagC. Top panel: GTP binding to RagC when RagA(D130N) is pre-bound to XTP or XDP. Bottom panel: quantification. When RagA(D130N) binds XTP, RagC loads a significantly smaller amount of GTP than when it binds XDP.
(C) Experimental setup of a sequential chase assay to probe the effect of later-bound nucleotides on the first-bound nucleotide.
(D) Later-bound XTP to RagA(D130N) has no effect on the amount of GTP pre-bound to RagC. Top panel: Pre-bound GTP to RagC chased by XTP or XDP binding on RagA(D130N). Bottom panel: quantification. Later-bound XTP or XDP on RagA(D130N) has no effect on the pre-bound GTP.
(E) Experimental setup of a half-site binding assay to measure the on-rates of nucleotides to singly-loaded Rag GTPases. Unlabeled nucleotides were added at sub-equal molar amounts compared to the nucleotide-binding pockets to generate singly-loaded Rag GTPases.
(F) Half-site on-rate measurements for GTP association when the Rags are singly-loaded with GTP (filled circle) or GDP (open circle). Subunit in bold is the subunit associated with the labeled GTP in the assay to measure the half-site on-rate. For example, RagA-RagCGDP (open red circle) shows how fast RagA associates with labeled GTP when RagC is preloaded with GDP. The slope gives the half-site on-rates. Notice that concentration-dependence is lost in the case of GTP.
(G) Half-site on-rate measurements for GDP association when the Rags are singly-loaded with GTP (filled circle) or GDP (open circle). As before, subunits in bold indicates which subunit is binding the labeled GDP in the assay to measure the half-site on-rate. GDP associates with the Rag GTPases more slowly if one subunit is preloaded with GTP.
(H) Summary of half-site on-rates for wildtype Rag GTPases at 4°C. Grey numbers in parenthesis denote the standard deviations of the reported values calculated from at least three independent experiments.
(I) Experimental setup for measuring the on-rates of nucleotides to the guanine-specific subunit when the xanthine-specific subunit is preloaded.
(J) On-rate of GTP association to RagC when RagA(D130N) was preloaded with XTP (filled circle) or XDP (open circle).
(K) On-rate of GTP association to RagA when RagC(D181N) was preloaded with XTP (filled circle) or XDP (open circle).
(L) Summary of differential on-rates for GTP at 4 °C. Grey numbers in parenthesis denote the standard deviations of the reported values calculated from at least three independent experiments.
(M) Illustration of the locked conformation induced by the binding of the first GTP to RagA and its inhibition of the association of the second GTP with RagC. The reverse case is shown in Supplementary Figure 2Q.
These findings suggest that the binding of GTP to either RagA or RagC could alter the conformation of the entire heterodimer to induce a “locked state” that suppresses the association of GTP to the other subunit (negative cooperativity). To verify this possibility, we directly measured the on-rate of GTP to singly-loaded wildtype Rag GTPase heterodimers using a half-site binding assay (Figure 2E–H and Supplementary Figure 2B–E). We reasoned that if the binding of the first GTP inhibits the association of the second GTP, we should observe a slower on-rate. This is indeed the case: when RagC is bound to GDP, RagA associates GTP at 890 M−1s−1 (Figure 2F and H). When RagC is loaded with GTP, however, the on-rate no longer exhibits concentration dependence (Figure 2F), and gives a first-order rate constant of 1.1×10⁻⁴ s−1. Similar results were obtained using the xanthine-specific mutants described above (Figure 2I–L and Supplementary Figure 2F–I): when the xanthine-specific subunit pre-binds XTP instead of XDP, the on-rate of GTP to the guanine-specific subunit is slower (Figure 2J for RagC, 2K for RagA, and summarized in 2L). These results are consistent with the Rag heterodimer being in a conformation that is not permissive to the direct binding of the substrate when it is singly loaded with GTP. In this locked state the transient opening of the binding pocket becomes rate-limiting, making the “on-rate” first-order and thus independent of Rag concentration (Supplementary Figure 2J and K) (Fersht, 1999).
We extended the half-site on-rate measurement to GDP association, and found, to a lesser extent, a decrease in on-rates when one subunit was pre-loaded with GTP (Figure 2G and H). However, the observed rate for GDP association is still dependent on the Rag concentration, likely because GDP is smaller so that even in the locked state the Rags cannot fully exclude it from the partially shielded nucleotide-binding site.
To directly probe the conformations of the Rag GTPases in different nucleotide loading states, we utilized a lysine modification assay (Supplementary Figure 2L), where the extent of lysine modification by Sulfo-NHS-acetate correlates with its solvent accessibility (Guo et al., 2008). When both subunits bind GDP, the Rag GTPases have a modification profile very similar to that of empty Rags (log2 ratio ~ 0, Supplementary Figure 2M). However, in the presence of 1:1 GTP:GDP, several lysine residues show a significantly lower level of modification (Supplementary Figure 2M). For example, Lys20 of RagA and Lys74 of RagC, both localizing within the nucleotide-binding pocket, are much less modified than without GTP, consistent with a local conformational change upon GTP binding that is prevalent amongst Ras-family GTPases. Another region that displays lower levels of modification is Lys230 of RagA and Lys258 of RagC (Supplementary Figure 2N and O). Based on a homologous structure (Supplementary Figure 2P), these residues localize to the hinge region connecting the NBD and CRD (Gong et al., 2011; Jeong et al., 2012). The significant reduction in the modification of these residues indicates that the hinge region is more shielded than in the GDP-bound state, suggesting that GTP binding induces a more compact conformation.
Thus, in aggregate these data indicate that when one subunit binds GTP, the Rag heterodimer rearranges into a more compact (“locked”) conformation that can account for the second transition state on the free-energy plot (Figure 2M), and decouples kon and koff.
The binding of a single GTP to the Rag heterodimer induces the hydrolysis of a second GTP
Despite the existence of the locked state, we wondered what would happen if both Rag subunits did manage to bind GTP. For example, if in the active heterodimer (GTPRagA-RagCGDP) RagC loses its GDP and misloads with GTP, is there a mechanism to promote hydrolysis of the newly bound GTP or do both subunits have an equal chance of hydrolyzing their GTPs? If the latter were the case, the heterodimer could flip from the active to inactive state, which might be undesirable.
We monitored labeled GTP hydrolysis using thin layer chromatography (TLC) in both single and multiple turnover setups (Figure 3A and 3E) (Peluso et al., 2001). In single turnover assays, a trace amount of GTP is incubated with an excess of the Rag GTPases, so that only a single subunit in each heterodimer will have the opportunity to hydrolyze GTP once (Figure 3A). In multiple turnover assays, the Rag GTPases are saturated with excess GTP, so that both subunits can hydrolyze GTP for multiple rounds (Figure 3E). These two setups yielded completely different kinetic parameters (Figure 3B–D, F–H, Supplementary Figure 3B and 3C, and summarized in 3K). The Rag GTPases hydrolyzed GTP 14-fold faster in the multiple than single turnover assay (kcat in Figure 3K), suggesting that the GTPRagA-RagCGTP state is unstable. Moreover, the KM for GTP was also 3000-fold higher in the multiple versus single turnover assay (Figure 3K), showing that the association of the second GTP is kinetically unfavorable, as predicted by the locking model proposed above. In the same assays, heterodimers containing RagA or RagC mutants with impaired GTP binding (cf. Supplementary Figure 1B and C) showed no differences between single and multiple turnover assays (Figure 3I–K and Supplementary Figure 3D–G).
Figure 3. Directional GTP hydrolysis maintains the functional state of the Rag GTPases.
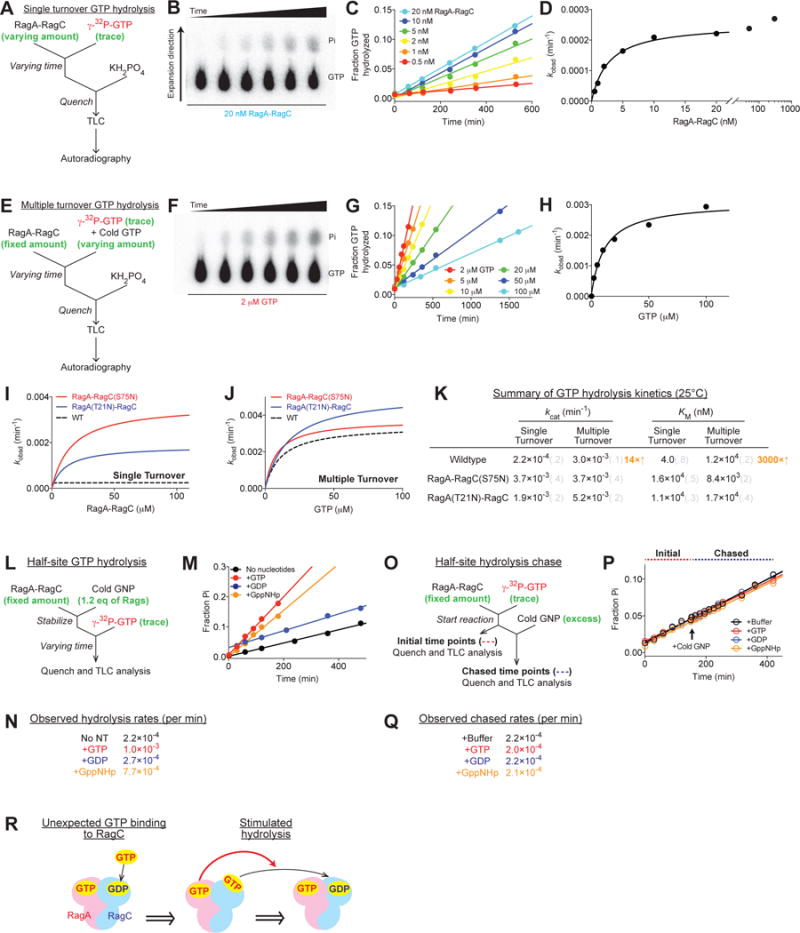
(A and E) Experimental setup for the single (A) and multiple (E) turnover GTP hydrolysis assays. A saturating amount of the Rag GTPases was incubated with a trace amount of labeled GTP to ensure single turnover conditions (A). A saturating amount of GTP was incubated with the Rag GTPases to ensure multiple turnover conditions (E).
(B and F) Thin layer chromatography to separate radioactive phosphate from unhydrolyzed GTP at different time points. 20 nM Rag GTPases hydrolyzed a trace amount of labeled GTP in a single turnover assay (B). 2 μM Rag GTPases hydrolyzed 2 μM GTP in a multiple turnover assay (F).
(C and G) Quantification and linear regression of the fraction of hydrolyzed GTP yields the observed rate constants (kobsd) at different Rag (C) or GTP (G) concentrations.
(D and H) Michaelis-Menten fittings of kobsd against Rag or GTP concentration yield kcat and KM for the single turnover (D) and multiple turnover (H) reactions.
(I–J) Single turnover (I) and multiple turnover (J) GTP hydrolysis reactions for RagA-RagC(S75N) (red circle) and RagA(T21N)-RagC (blue circle). Dashed curves show the activity of wildtype Rags as a reference.
(K) Summary of GTP hydrolysis kinetics for the Rag GTPases at 25°C. Grey numbers in parenthesis denote the standard deviations of the reported values calculated from at least three independent experiments.
(L) Experimental setup for a half-site GTP hydrolysis reaction.
(M) Half-site GTP hydrolysis in the presence of GTP (red), GDP (blue), or GppNHp (orange). Radioactively labeled GTP is hydrolyzed on one subunit of the Rag GTPases when the other is preloaded with nucleotides. Preloaded GTP and GppNHp trigger hydrolysis by the other subunit. Control (black) contains no preloaded nucleotides.
(N) Summary of the observed rate constants for half-site GTP hydrolysis reactions in M.
(O) Experimental setup for a half-site GTP hydrolysis chase. Labeled GTP was preloaded and hydrolyzed on one subunit of the Rag GTPases, before an excess amount of cold nucleotides was added to occupy the remaining binding sites.
(P) Half-site GTP hydrolysis chased by GTP (red), GDP (blue), or GppNHp (orange). No difference in the slope was observed. Pure buffer was added to the control (black).
(Q) Summary of the observed rate constants for half-site GTP hydrolysis chase in P.
(R) Illustration of the effect of the locked conformation on GTP hydrolysis. GTP binding to RagA triggers GTP hydrolysis by RagC. The reverse case is shown in Supplementary Figure 3H.
We also probed how the order of GTP binding to the Rag heterodimer impacts hydrolysis by its subunits. We first checked the hydrolysis of the later bound GTP using a half-site hydrolysis setup (Figure 3L), where we loaded half of the nucleotide binding pockets in the Rag heterodimer with unlabeled GTP or GDP, so that labeled GTP can only occupy and be hydrolyzed by the remaining site. When the Rag GTPases were singly loaded with GTP or GppNHp, the hydrolysis rate on the other subunit was fourfold faster than when loaded with GDP (Figure 3M and N). To measure the hydrolysis rate of the pre-bound GTP we switched the reaction order so that labeled GTP was first loaded on the Rag GTPases, and then an excess of unlabeled GTP or GDP was added as a chase to occupy the remaining site (Figure 3O). In this scenario, no acceleration in the reaction rate was observed regardless of the chase. The pre-bound GTP was hydrolyzed at a constant, slow speed, similar to that in a single turnover setup (Figure 3P and Q), suggesting the later loaded GTP has no effect on the pre-bound GTP. Thus, the pre-bound GTP hydrolyzes itself at a slow rate, while causing accelerated hydrolysis at the other nucleotide-binding pocket.
Combining the results from above, we conclude that a single GTP binding event on one subunit is necessary and sufficient to drive the heterodimer into a locked state that inhibits the association and promotes the hydrolysis of GTP by the other subunit (Figure 3R). Thus, “intersubunit communication” maintains the Rag heterodimer in its active or inactive state, ensuring the stability of each and pointing to the necessity of regulators to interconvert between them.
The Rag GAPs interconvert between the functional states of the Rag GTPase heterodimer
The consequences of intersubunit communication and the slow intrinsic GTP dissociation and hydrolysis rates of the Rags should make transitions between the two stable states intrinsically challenging. These findings clearly point to a key role for extrinsic regulators in modulating the Rag GTPases in response to nutrients.
Indeed, two GTPase Activating Proteins (GAPs) have been discovered for the Rags: GATOR1 (Bar-Peled et al., 2013; Panchaud et al., 2013) and FLCN-FNIP2 (Petit et al., 2013; Tsun et al., 2013) for RagA/B and RagC/D, respectively (Figure 4A). To test the hypothesis that these GAPs accelerate state conversion of the Rag heterodimer to match the temporal requirements of mTORC1 signaling, we measured the kinetic parameters for GAP-stimulated GTP hydrolysis reactions. For wildtype Rags, GATOR1 and FLCN-FNIP2 stimulate GTP hydrolysis in a dose-dependent manner (Figure 4B and 4C, and summarized in 4K). The rate enhancement of GATOR1 or FLCN-FNIP2 is 45-fold (Figure 4B) and 1000-fold (Figure 4C) in a single turnover reaction, respectively, and 20-fold (Supplementary Figure 4E) and 50-fold (Supplementary Figure 4M) in a multiple turnover reaction, respectively. The stimulated hydrolysis is much faster than the intrinsic hydrolysis of the Rag GTPases, which brings the half-life of the activated state from over 8 hours down to 12 minutes (37 °C), and of the inactive state to 30 seconds. These rates are consistent with the time scales at which mTORC1 signaling responds to amino acids. Therefore, we concluded that GATOR1 and FLCN-FNIP2 resolve the locked states (activated or inactive), facilitating the Rags for state-conversion.
Figure 4. Regulators of the Rag GTPase heterodimer control its nucleotide loading state.

(A) SDS-PAGE followed by Coomassie blue staining of recombinant GATOR1 and FLCN-FNIP2 complexes indicating their subunits.
(B–C) Single turnover reactions of GATOR1- (B) and FLCN-FNIP- (C) stimulated GTP hydrolysis of wildtype Rags. GATOR1 and FLCN-FNIP dose-dependently increase GTP hydrolysis by wildtype Rags.
(D) GATOR1-stimulated GTP hydrolysis of RagA(Q66L)-RagC mutant in a single turnover condition. The leucine substitution in RagA abolishes the stimulation by GATOR1.
(E) Concentration dependence of GATOR1-stimulated GTP hydrolysis under single turnover conditions for wildtype Rags (black), RagA(Q66L)-RagC (blue), RagA-RagC(Q120L) (orange), and RagA(Q66L)-RagC(Q120L) (red).
(F) FLCN-FNIP2-stimulated GTP hydrolysis of RagA-RagC(Q120L) mutant in a single turnover condition. The leucine substitution in RagC abolishes the stimulation by FLCN-FNIP2.
(G) Concentration dependence of FLCN-FNIP2-stimulated GTP hydrolysis under single turnover conditions for wildtype Rags (black), RagA(Q66L)-RagC (blue), RagA-RagC(Q120L) (orange), and RagA(Q66L)-RagC(Q120L) (red).
(H) Summary of hydrolysis kinetics for GATOR1- or FLCN-FNIP2-stimulated reactions.
In Ras-like GTPases, a glutamine residue (Gln61 in Ras) serves as the general base for GTP hydrolysis and chelates the nucleophilic-attacking water to stabilize the transition state (Pai et al., 1990; Scheffzek et al., 1997). We analyzed the corresponding glutamine mutants of the Rag GTPases in the GAP-stimulated GTP hydrolysis reaction. As expected, GATOR1 acts specifically on RagA because RagA(Q66L)-RagC (Figure 4D and 4E), but not RagA-RagC(Q120L) (Supplementary Figure 4C), loses GATOR1-dependent stimulation. In contrast, RagA-RagC(Q120L) (Figure 4F and 4G), but not RagA(Q66L)-RagC (Supplementary Figure 4J), no longer responds to FLCN-FNIP2. These results suggest that the conserved glutamine residues strongly participate in GAP-stimulated GTP hydrolysis, and that the two GAPs likely reposition this residue on the corresponding Rag to facilitate GTP hydrolysis.
Point mutations in Switch I of the Rag GTPases disrupt intersubunit communication
As discussed above, intersubunit communication by the Rag heterodimer provides a mechanism for maintaining its subunits loaded with opposite nucleotides. To understand the biological relevance of this mechanism, we sought mutants that disrupt intersubunit communication. By systematically characterizing the biochemical properties of recurring RagC mutations found in follicular lymphoma, we identified two interesting mutants, RagC(L91P) and RagC(K84T), in Switch I (Figure 5A) (Long et al., 2016; Okosun et al., 2015). The affinity of guanine nucleotides to these mutants closely resembles that of the wildtype proteins (Figure 5B, 5D and Supplementary Figure 5A–E), suggesting that they maintain an intact nucleotide binding pocket. However, in the RagA-RagC(L91P) heterodimer, the off-rate for GTP of RagC increases by 10-fold, while that for GDP remains similar (Figure 5C, 5D, and Supplementary Figure 5F). These results suggest that the binding of GTP to RagC(L91P) does not drive the Rag heterodimer into the locked conformation that should have inhibited its dissociation.
Figure 5. Mutations in Switch I of the Rag GTPases impair intersubunit communication.

(A) Crystal structure of Gtr2p (RagC homolog in yeast) bound to GppNHp (PDB: 3R7W). Switch I region is shown in orange. Upon GppNHp binding, Switch I forms a lid on top the nucleotide binding pocket. Leu91Hs and Lys84Hs are shown in spheres.
(B) GTP binding to RagA-RagC(L91P). Top panel: nucleotide bound to RagA and RagC(L91P). Bottom panel: quantification. Data were fit to a single-site binding equation to obtain the Kd. In comparison, wildtype binding is shown as dashed curves. RagA-RagC(L91P) binds GTP in a similar fashion as the wildtype Rags.
(C) Reaction time-course of radioactively labeled GTP remaining bound to RagA-RagC(L91P) during the off-rate measurement. Top panel: GTP bound to RagA and RagC(L91P) after using unlabeled GTP as a chase. Bottom panel: quantification. Data were fit to a single exponential decay to obtain the koff. The wildtype off-rate is shown as dashed curves for reference. GTP dissociates from RagA-RagC(L91P) faster than from the wildtype Rags.
(D) Summary of koff and Kd values for RagA-RagC(L91P), RagA-RagC(K84T), and RagA(R37P)-RagC. Wildtype data are reproduced from Figure 1Q for ease of comparison.
(E–F) Half-site on-rates for RagA-RagC(L91P) (squares) and RagA-RagC(K84T) (diamonds) (E), and RagA(R37P)-RagC (circles) (F). The subunits in bold are those with which the labeled GTP is associating in the assay to measure the half-site on-rate. The slope gives the half-site on-rate. Wildtype half-site on-rates are shown as dashed lines for comparisons. Notice that the concentration dependence for GTP association is partially restored for all the mutants. * indicates p < 0.05; ** indicates p < 0.01; ns: not significant from zero.
(G) Summary of half-site on-rates of GTP to RagA-RagC(L91P), RagA-RagC(K84T), and RagA(R37P)-RagC. On-rates for wildtype Rags are reproduced from Figure 2H for ease of comparison.
(H–I) Single (H) and multiple (I) turnover GTP hydrolysis assays for RagA-RagC(L91P) (blue circles) and RagA-RagC(K84T) (brown circles), and RagA(R37P)-RagC (red circles). Wildtype curves are shown as dashed lines.
(J) Summary of hydrolysis kinetics for RagA-RagC(L91P), RagA-RagC(K84T), and RagA(R37P)-RagC. Wildtype data are reproduced from Figure 3K for ease of comparison.
(K) Illustration of the effects of the Switch I mutations on intersubunit crosstalk within the Rag heterodimer.
If this were true, the previously observed properties of the locked state should diminish: preloaded GTP should not inhibit the second GTP from associating and, if it does, trigger its hydrolysis. We used the half-site setup to measure the on-rate of the second GTP (Figure 2E). For wildtype Rags with normal intersubunit communication, the second GTP association does not have concentration-dependence (Figure 5E, dashed line and cf. Figure 2F), but for RagA-RagC(L91P) mutant, the concentration-dependence is partially restored for both subunits (Figure 5E and G), suggesting that the first GTP binding does not effectively drive the heterodimer containing this mutant into the closed conformation. Moreover, the rate enhancement in a multiple turnover GTP hydrolysis reaction (Figure 5I), but not in a single turnover reaction (Figure 5H), is partially suppressed for RagA-RagC(L91P), suggesting that the pre-bound GTP does not efficiently trigger hydrolysis of the later-bound GTP. In addition, the half-site hydrolysis stimulation by GTP is impaired for this mutant (Supplementary Figure 5M and N). Therefore, we conclude that the L91P mutation in RagC partially disrupts intersubunit communication (Figure 5K). Tests of the analogous mutant in RagA, RagA(R37P), and of the RagC(K84T) mutant led to similar conclusions (Figure 5D–J), suggesting that mutations in either Rag subunit can disrupt the locking process.
Rag mutants deficient in intersubunit communication impair regulation of mTORC1 by amino acids
We took advantage of the mutants defective in intersubunit communication to determine its importance in mTORC1 signaling in cells. We first focused on the interaction of the Rag heterodimer with mTORC1, which is strongest when RagA is loaded with GTP and RagC with GDP. As expected, heterodimers containing the RagA(Q66L) mutant that does not respond to GATOR1-stimulated GTP hydrolysis or the RagC(S75N) mutant that favors GDP binding, interacted better with mTORC1 than the wild-type proteins, while mutants have the opposite effects bound worse (Figure 6A and Supplementary Figure 6A) (Sancak et al., 2008).
Figure 6. Communication-defective Rag mutants impair mTORC1 signaling in cells.

(A) Coimmunoprecipitation of Rag GTPase heterodimers containing communication-defective mutants with mTORC1 subunits mTOR and Raptor. Communication-defective mutants mimic mutants incapable of binding GTP in terms of their interactions with mTORC1.
(B and C) Effects of the communication-defective mutants on mTORC1 signaling in response to amino acid stimulation (B) or starvation (C). mTORC1 signaling is detected by the phosphorylation of Thr389 of S6K1 in response to amino acid stimulation (B) or starvation (C). mTORC1 signaling is impaired in cells expressing communication-defective mutants.
(D and E) mTORC1 activity during a time course of amino acid stimulation (D) or starvation (E). Communication-defective mutants slow the response of the mTORC1 pathway to changes in amino acid levels.
(F) Illustration of the effects of the communication-defective mutants on mTORC1 signaling in response to amino acids.
Interestingly, the communication-defective RagA mutant (RagA R37P), despite its capability to bind GTP, bound as poorly to mTORC1 as the RagA(T21N) mutant that is deficient in GTP-binding, suggesting that locking is required for RagA to maintain the GTP-loaded state needed to associate with mTORC1 (Figure 6A). In contrast, heterodimers containing the communication-defective RagC mutants L91P or K84T interacted better with mTORC1 than those with wildtype RagC, indicating that in the absence of the locking mechanism, RagC likely reverts to the GDP-bound state that promotes the interaction with mTORC1 (Figure 6A). Thus, mutants that do not affect nucleotide binding but prevent intersubunit communication have strong effects on the Rag-mTORC1 interaction by preventing the Rag heterodimer from achieving the locked states.
We next examined the effects of the mutants on the phosphorylation of the mTORC1 substrate S6K1 in response to amino acid stimulation and starvation. In HEK-293T cells expressing the control protein Metap2 or the wildtype Rags, amino acids stimulation and deprivation regulated mTORC1 activity, as monitored by the phosphorylation of its substrate S6K1 (Figure 6B and 6C). As expected, mutants that alter the nucleotide binding preferences of the Rags strongly impacted mTORC1 signaling: the RagA(T21N) and RagA(Q66L) mutants rendered the pathway unresponsive to amino acids (Figure 6B), while RagC(S75N) prevented the turning-off of mTORC1 signaling normally caused by amino acid starvation (Figure 6C).
Mutants that block intersubunit communication also caused severe signaling defects. The expression of RagA(R37P) prevented mTORC1 activation in response to amino acid stimulation (Figure 6B), while that of RagC(L91P) and RagC(K84T) suppressed the inhibition of mTORC1 signaling that normally occurs upon amino acid deprivation (Figure 6C). Moreover, in cells expressing the communication-defective mutants, the response rate of mTORC1 signaling to amino acid stimulation or starvation was also blunted (Figure 6D and 6E). These observations correlate well with the biochemical and protein interaction assays, and reveal that mTORC1 signaling in response to amino acids is distorted if the Rag heterodimer cannot achieve the locked state (Figure 6F).
Discussion
As the convergence point of diverse amino acid signals, the heterodimeric Rag GTPases have a central role in controlling the localization and activation of mTORC1. Here, we used kinetic approaches to analyze the intersubunit communication between the subunits within the Rag heterodimer, and found that its unique architecture allows for crosstalk between the subunits that is essential for the normal function of the mTORC1 pathway. Specifically, when one subunit binds GTP, it triggers a conformational change that makes it dominant over the other and drives the Rag heterodimer into a locked conformation. This state suppresses the association of a second GTP, and, even if binding does occur, induces its faster hydrolysis. This intersubunit communication is a unique mode of regulation for GTPases and informs how the Rag GTPases transmit amino acid sufficiency to mTORC1.
At the molecular level, how do the Rag GTPases attain the locked conformation? Combining insights from our biochemical analyses with those from the previously solved structures of the homologous yeast Gtr proteins (Gong et al., 2011; Jeong et al., 2012), we hypothesize the following chain of events. The binding of the GTP to one subunit of the heterodimer, triggers local conformational changes in Switch I and II, which form a lid over its nucleotide binding pocket. Unlike Ras, whose Switch I adopts a loop conformation upon GTP binding, we predict from the Gtr1 structure that Switch I of the Rag GTPases forms a short α-helix (Figure 7A and B). This helix is in the right position to touch the other subunit, possibly precluding rearrangement of its Switch I and thus causing slower association and higher hydrolysis rate for the second GTP. The proposed reliance of the locking state on cooperation between the Switch I regions of the Rag subunits, could explain why we can impair it by introducing mutations that promote Switch I flexibility.
Figure 7. Proposed locking mechanism for the regulation of the Rag GTPases.

(A and B) Comparison of the conformations of Ras (A) and Gtr2p (B) upon GTP or GDP binding. The Switch I regions of Ras and Gtr2p are shown in red or orange. Switch II is shown in cyan or green. Gtr2p (the RagC homolog in yeast) shows more dramatic conformational changes than Ras in Switch I and II when it is associated with GTP analog.
(C) Functional cycle of the Rag heterodimer in response to amino acid levels. Two stable states, GTPRagA-RagCGDP and GDPRagA-RagCGTP, generate constant outputs for mTORC1 in the presence or absence of amino acids, respectively. The GDPRagA-RagCGDP configuration allows for interconversion between the active and inhibited states.
Beyond its requirement for intersubunit communication and normal mTORC1 signaling, there are several other reasons why the heterodimeric architecture of Rag GTPases may have evolved. First, unlike conventional signaling GTPases that exist in two states — on (GTP-bound) and off (GDP-bound) — the Rag GTPases can exist in four. Although previous work suggests that two are stable (Sancak et al., 2008), GTPRagA-RagCGDP and GDPRagA-RagCGTP, a third, GDPRagA-RagCGDP, must be an intermediate given the importance of the GAPs for interconverting between them. Moreover, the off state of the Rag heterodimer requires RagC to bind GTP, which suppresses its association with mTORC1 regardless of the identity of the nucleotide bound to RagA (Supplementary Figure 7). It is likely that a Switch I rearrangement in RagC either directly displaces mTORC1, or shields the residues responsible for it to associate. Therefore, the off state of the Rag GTPase heterodimer is likely different from that of canonical GTPases, in that it is ‘active’ because mTORC1 is actively rejected due to physical hindrance rather simply being unable to bind with it. We speculate that this provides an additional mechanism to prevent the mis-activation of mTORC1. Therefore, the heterodimeric nature of the Rag GTPases creates more states that should allow for the more precise control of mTORC1 signaling. We hypothesized that eventually a role for the fourth state, GTPRagA-RagCGTP, will emerge.
Second, a heterodimer allows for more binding sites to integrate the many regulators and effectors that the Rag GTPases must contact. Residing in what is likely a crowded environment on the lysosomal surface, the Rag GTPases need to interact with several large multi-protein factors, including, but probably not limited to, Ragulator (Sancak et al., 2010), SLC38A9 (Jung et al., 2015; Rebsamen et al., 2015; Wang et al., 2015), GATOR1 (Bar-Peled et al., 2013; Panchaud et al., 2013), FLCN-FNIP2 (Petit et al., 2013; Tsun et al., 2013), and mTORC1 (Sancak et al., 2008). Considering that the size of a canonical GTPase domain is only ~ 20 kDa, it is physically impossible for it to interface with so many factors at the same time and a heterodimer provides additional binding sites for this to occur. In addition, the existence of the locking mechanism, allows for the control of the nucleotide loading state of one subunit to determine the functional state of the entire heterodimer.
In comparison to Ras, the Rag GTPases have slower rates of GTP dissociation and hydrolysis (Frech et al., 1994). These properties enable the Rags to hold on to the nucleotide loading state in which they reside (Figure 7C), probably because of a requirement for generating a constant output. In order to switch between functional states, two GAPs are needed. By better positioning the critical glutamine residue that chelates the nucleophilic-attacking water, GATOR1 and FLCN-FNIP2, strongly stimulate the GTP hydrolysis rates of RagA and RagC, respectively, which drives the heterodimer from a locked on- or off-state into the GDPRagA-RagCGDP intermediate (Figure 7C). At this point, if a GTP molecule binds to the same subunit, it will be hydrolyzed immediately because of the proximity to the corresponding GAP. On the other hand, if GTP binds to the other subunit, which drives the Rags into the opposite functional state, no stimulated hydrolysis will happen because of the specificity of GATOR1 and FLCN-FNIP2 (cf. Figure 5). The existence of intersubunit communication by the Rag heterodimer and of many Rag GTPase regulators hints at the importance of ensuring faithful and efficient mTORC1 signaling.
STAR METHODS
CONTACT FOR REAGENT AND RESOURCE SHARING
Further information and requests for resources and reagents should be directed to and will be fulfilled by the Lead Contact, David M. Sabatini (sabatini@wi.mit.edu).
EXPERIMENTAL MODEL AND SUBJECT DETAILS
HEK-293T cells were obtained from ATCC and maintained in an incubator sett at 37°C and 5% CO2. HEK-293T cells were cultured in DMEM with 10% IFS supplemented with 2 mM glutamine, penicillin (100 IU/ml), and streptomycin (100 μg/ml).
FreeStyle 293-F cells were obtained from Thermo Fisher and maintained in a Multitron Pro shaker setting at 37°C, 125 rpm, 8% CO2, and 80% hu midity. FreeStyle 293-F cells were cultured in FreeStyle 293 Expression Medium supplemented with penicillin (100 IU/ml) and streptomycin (100 μg/ml).
METHOD DETAILS
Purification of the Rag GTPase heterodimer (I)
To co-express the Rag GTPase dimer in bacteria, a pETDuet-1 vector encoding codon optimized, C-terminally His-tagged RagA and tagless RagC (pSK109) was transformed into BL21(DE3) competent cells and plated on a LB-agar plate containing 100 μg/ml ampicillin. A single colony was inoculated in 50 ml LB media containing 100 μg/ml ampicillin and shaken at 37°C overnight. The saturated overnight culture was diluted 1:100 into four liters of LB to continue growth. Optical density (OD) of the culture was monitored at 600 nm, and the temperature was lowered to 18°C when OD600 reached 0.4 – 0.6 (early log-phase). Half an hour later when the culture was cooled down to 25 °C, the Rag dimer was induced by 0.5 mM IPTG and expressed overnight at 18°C (~ 20 hours).
Unless specified below, all the purification steps were carried out at 4°C or on ice to stabilize the Rag GTPases.
The bacterial pellets were resuspended in 100 ml of Resuspension Buffer (50 mM NaHEPES, pH 7.4; 100 mM NaCl; 2 mM MgCl2; 2 mM DTT; 0.5 mM PMSF; 0.05% Triton; 100 μM GDP; 100 μg/ml lysozyme; 10 μg/ml DNase; and four tablets of protease inhibitor cocktail). The mixture was stirred at 4°C for 30 minutes to ensure homogeneous resuspension, before passing through the microfluidizer five times at the pressure of 18,000 psi. The cell lysate was cleared by centrifugation at 40,000×g for one hour. The supernatant containing soluble Rag GTPase heterodimer was taken for the next step.
The cleared cell lysate was first cleaned up using a hand-packed anion exchange column, taking advantage of the negatively charged RagC subunit. 15 ml of Q-sepharose Fast Flow slurry was packed and equilibrated in Buffer A (50 mM NaHEPES, pH 7.4; 50 mM NaCl; 2 mM MgCl2; 2 mM DTT; 100 μM GDP; 0.05% Triton). The cleared cell lysate was then applied to the column using an isocratic flow pump at a rate of 2 ml/min. After sample loading, the column was washed by Buffer A for 20 column volumes, and the bound proteins were eluted by a linear salt gradient of Buffer A to Buffer A′ (50 mM NaHEPES, pH 7.4; 500 mM NaCl; 2 mM MgCl2; 2 mM DTT; 100 μM GDP; 0.05% Triton). Fractions containing the Rag dimer were pooled together and dialyzed three times against Buffer B (50 mM NaHEPES, pH 7.4; 150 mM NaCl; 2 mM MgCl2; 0.5 mM TCEP; 100 μM GDP; 0.05% Triton) in preparation for Ni-NTA purification.
Dialyzed fractions from Q-sepharose were incubated with 5 ml of Ni-NTA resin that was pre-equilibrated in Buffer C (50 mM NaHEPES, pH 7.4; 150 mM NaCl; 2 mM MgCl2; 0.5 mM TCEP; 100 μM ATP; 100 μM GDP; 0.05% Triton). Ni-NTA column was hand-packed after an hour of incubation, and washed by 20 column volumes of Buffer C and 10 column volumes of Buffer C′ (Buffer C supplemented with 30 mM imidazole and 300 mM NaCl). The Rag GTPase dimer was then eluted by Buffer C″ (Buffer C supplemented with 250 mM imidazole). The elutant was concentrated in a 30 kDa molecular-weight cut-off concentrator, and ultracentrifuged at 100,000×g for 30 minutes, to remove all the aggregates in preparation for FPLC purification.
For FPLC purification, a monoQ column was first equilibrated in 90% Buffer D (50 mM NaHEPES, pH 7.4; 2 mM MgCl2; 2 mM DTT) and 10% Buffer D′ (50 mM NaHEPES, pH 7.4; 1 M NaCl; 2 mM MgCl2; 2 mM DTT), before the elutant from Ni-NTA was applied. A linear gradient from 12% D′ to 30% D′ was used to elute the bound proteins, and a single peak was collected at around 22% D′, which corresponds to the Rag GTPase heterodimer. The peak was concentrated, and any bound nucleotides were stripped by 10 mM EDTA for an hour at room temperature. The apo Rag heterodimer was then applied to a HiLoad 16/60 Superdex 200 gel-filtration column pre-equilibrated in Buffer E (50 mM NaHEPES, pH 7.4; 100 mM KOAc; 1 mM EDTA; 2 mM DTT). The peak corresponding to the Rag heterodimer was collected and concentrated. The final product was aliquoted and flash frozen in the presence of 5% glycerol, and stored at -80°C. The final yield is ~ 1 mg Rag heterodimer per liter of LB culture.
The Rag GTPases purified using this construct are suitable for equilibrium binding assays, on- and off-rate measurements, and single turnover GTP hydrolysis assays. Because of the trace amount of contaminating GTPases which hydrolyzes GTP at a much faster rate, the product here cannot be used for multiple turnover GTP hydrolysis assay.
Purification of the Rag GTPase heterodimer (II)
To completely remove any contaminating GTPases, a pCOLADuet-1 vector (KanR) encoding codon optimized, N-terminally His10-R8-SUMO-tagged RagA and tagless RagC (pSK235) was expressed using a similar protocol as above. 8 liters of bacteria culture were lysed and cleared in 160 ml of Resuspension Buffer (substitute DTT with 0.5 mM TCEP). The cleared supernatant was first cleaned up using a hand-packed Ni-NTA column using a similar protocol as above. The elutant was concentrated and ultracentrifuged for FPLC.
A monoS column was first equilibrated in 85% Buffer D and 15% Buffer D′, before the elutant from Ni-NTA was applied. A linear gradient from 20% D′ to 100% D′ was used to elute the Rag GTPases. The peak was concentrated, and the fusion protein was digested overnight by the 3C protease to cleave the His10-R8-SUMO-tag. The digested mixture was applied to monoS again to remove the tag, and the apo Rag heterodimer was then applied to monoQ followed by HiLoad 16/60 Superdex 200 gel-filtration column. The final yield is ~ 50 μg Rag dimer per liter of LB culture.
Despite the low yield, the Rag GTPases purified using this construct are free of contaminating GTPases and are suitable for multiple turnover GTP hydrolysis assays.
Purification of the GATOR1 and FLCN-FNIP2 complexes
To generate the GAPs for the Rag GTPases, one million 293 FreeStyle cells were inoculated into 2 liters of FreeStyle media. Twenty-four hours later, cells were transfected using PEI with the following combination of pRK5 constructs: For GATOR1: 420 μg FLAG-Depdc5, 840 μg HA-Nprl2, and 840 μg HA-Nprl3; For FLCN-FNIP2: 600 μg FLAG-FNIP2 and 1.5 mg HA-FLCN. Thirty-six hours after transfection, cells were spun down and washed once with ice-cold PBS. Cells were lysed in 100 ml Triton lysis buffer (40 mM NaHEPES, pH 7.4; 100 mM NaCl; 5 mM MgCl2; 100 μM ATP; 10 mM Na4P2O7; 10 mM Na β-glycerol phosphate; 1% Triton; and two tablets of protease inhibitor cocktail), and were dounced to homogenize. After clearing up the insoluble fractions by centrifuging at 40,000×g for 30 minutes, 4 ml of pre-equilibrated FLAG-M2 beads were added to lysate. Recombinant protein complexes were immunoprecipitated for 3 hours at 4°C, before packing into a column. The resin was washed with 10 column volumes of Triton lysis buffer, followed by 20 column volumes of Triton lysis buffer supplemented with 300 mM NaCl. Before elution, the resin was buffer exchanged into CHAPS buffer (40 mM NaHEPES, pH 7.4; 150 mM NaCl; 2 mM MgCl2; and 0.1% CHAPS). FLAG-tagged GATOR1 or FLCN-FNIP2 was then eluted from the FLAG-M2 beads with 3×FLAG peptide dissolved in CHAPS buffer for one hour at 4°C. The elutant was concentrated using a 100 kDa molecular-weight cut-off filter and ultracentrifuged at 100,000×g for 30 minutes in a TLA-100.3 rotor, to remove all the aggregates in preparation for FPLC purification.
To further improve the purity and confirm the integrity of subunit assembly, the protein complexes were subsequently loaded onto a HiLoad 16/60 Superdex 200 gel-filtration column pre-equilibrated in Buffer GFB (50 mM NaHEPES, pH 7.4; 150 mM NaCl; 2 mM MgCl2; 2 mM DTT; and 0.1% CHAPS). The peak corresponding to the desired complex was collected, flash frozen in GFB supplemented with 10% glycerol and stored at −80°C.
Equilibrium binding assays
Before use, the newly thawed Rag GTPase heterodimer was ultracentrifuged at 200,000×g for an hour and its concentration was re-determined, to completely remove any aggregates caused by the freeze-thaw cycle.
Unless otherwise specified, all the biochemical assays below were carried out in Assay Buffer (50 mM NaHEPES, pH 7.4; 100 mM KOAc; 2 mM MgCl2; 2 mM DTT; and 0.1% CHAPS).
To determine the binding affinity of nucleotides to individual Rag subunits, increasing concentrations of Rag GTPases, usually ranging from 5 nM to 2 μM on a log-scale, were mixed with trace amount (~ 1 nM) of α-32P-GTP or α-32P-GDP (Perkin-Elmer). The reaction mixtures were incubated at 4°C until equilibrium was reached, usually for four hours, before directly spotted onto a chilled metal block covered with Parafilm. 0.3 Joule of 254 nm UV light was applied to the droplets, to induce non-specific, zero distance crosslinking between the nucleotide and the subunit it bound to. The resulting products were analyzed by 12% Tris-Glycine gel. After fixing and drying, the gel was exposed to a phosphor-imaging screen, and the intensities of the radioactive signals (Iobsd) were visualized by a Typhoon scanner and quantified using the ImageQuant software. The signals were fit to a single-site binding equation (Equation I) to extract the Kd for both subunits.
| Equation I |
in which Amplitude = Radioactive Intensity × Crosslinking efficiency × Imaging efficiency.
For samples taken from the same batch of experiment and run on the same gel, these three terms can be assumed approximately equal, and the Amplitude can be directly compared within. However, these relative terms may vary for mutants or in different assays, so the absolute values of the radioactive signal cannot be compared across different experiments. Notice that the dissociation constant Kd is independent of the Amplitude and thus is irrelevant to a change in any of the relative terms.
The sequential binding (Figure 2A) and sequential chase (Figure 2C) assays were performed in a similar fashion. For the sequential binding assay (Figure 2A), before radioactively labeled GTP was added to the reaction, the Rag GTPase mutants were pre-incubated with 1.2 equal molar of XTP or XDP at each concentration, to ensure that the xanthine-specific site was occupied. For the sequential chase assay (Figure 2C), 5 equal molar of XTP or XDP was added to the reaction mixture after the guanine-specific site was pre-loaded with radioactively labeled GTP.
On-rate measurements
To determine the on-rates of nucleotides to individual Rag subunits, at time zero, different concentrations of Rag GTPases, e.g. 100/200/300/400 nM, were mixed with trace amount (~ 1 nM) of α-32P-GTP or α-32P-GDP to initiate the reaction. Small aliquots of the mixture were taken out at different time points for crosslinking analysis, to trace the amount of radioactively labeled nucleotides that had been associated to the Rag GTPases, until equilibrium was reached. For example, in Figure 1I, eleven time points were taken between time zero and two hours. For each concentration of the Rag GTPases, the time points were blotted on the same gel and quantified as above. The observed reaction constants (kobsd) were extracted using a single exponential rise function (Equation II):
| Equation II |
in which Amplitude = Radioactive Intensity × Crosslinking efficiency × Imaging efficiency.
The kobsds were then linear-fit against the concentration of the Rag GTPases to obtain the on-rate (kon) using Equation III:
| Equation III |
The half-site on-rate (Figure 2E) was determined in a similar fashion, except that wildtype Rag GTPases were pre-incubated with 1.2 equal molar of unlabeled GTP or GDP at each concentration prior to the on-rate measurement. Because each functional unit of the Rag GTPases contain two nucleotide binding sites and the fact that the second GTP binding is more difficult than the first, we can assume that in the presence of 1.2 equal molar of unlabeled nucleotide, the majority of the Rag GTPases was singly occupied, while sufficient amount of unoccupied nucleotide binding pockets remained for the later-added radioactively labeled nucleotide to be associated with. Therefore, the half-site on-rate is a measure of the association rate of the radioactively labeled nucleotide to the singly-loaded Rag GTPases.
The differential on-rate (Figure 2I) was determined using xanthine-specific Rag mutants, which were pre-incubated with 1.2 equal molar of unlabeled XTP or XDP at each concentration, before the radioactively labeled GTP was added to initiate the on-rate measurement. Because of the modified hydrogen bonding pattern, xanthine-specific Rag mutants should be singly loaded with unlabeled XTP or XDP, so the differential on-rate measures the association of the radioactively labeled GTP to the guanine-specific site of the Rag mutants. Notice that in these mutants, the effect of pre-loaded XTP to inhibit GTP association is not as pronounced as that of GTP in the half-site on-rate measurement for wildtype Rags, which suggests that intersubunit communication may be partially defective in the xanthine-specific mutants.
Off-rate measurements
To determine the dissociation rates of nucleotides from individual Rag subunits, we used a pulse-chase setup. A trace amount (~ 1 nM) of α-32P-GTP or α-32P-GDP was first incubated with 1 μM Rag GTPases for two hours, so that a certain amount of radioactively labeled nucleotides were associated with each subunit. At time zero, a large excess (1 mM) of unlabeled nucleotides were added to the reaction, to ensure that once the radioactively labeled nucleotides fall out of the nucleotide binding pocket, the chance of its re-association is small. Small aliquots of the mixture were taken out at different time points for crosslinking analysis, to trace the amount of radioactively labeled nucleotides remaining bound to the Rag GTPases. The off-rates (koff) were extracted by fitting the intensities of the radioactive signals to a single exponential decay function using Equation IV:
| Equation IV |
in which Amplitude = Radioactive Intensity × Crosslinking efficiency × Imaging efficiency.
Notice that the koff is independent of the Amplitude and thus is irrelevant to a change in any of the relative terms, usually caused by batch-to-batch variation.
Single turnover GTP hydrolysis experiments
To determine the hydrolysis rate of the Rag GTPases under single turnover conditions, increasing amounts of Rag GTPases, from 0.5 nM to 20 nM for wildtype Rags, was incubated with ~ 0.1 nM of γ-32P-GTP. Aliquots of the reaction mixture were taken at different time points and quenched using 0.75 M KH2PO4 (pH 3.3). These points were taken within the time window that less than 20% of the GTP was hydrolyzed. For example, six time points were taken for wildtype Rags at 1 minute, 1, 2, 4, 6, and 9 hours, as shown in Figure 3B. The time points were then applied to cellulose 300 PEI thin layer chromatography (TLC) plates, which were expanded in TLC buffer (1 M formic acid and 0.5 M LiCl) for 20 minutes. The plates were dried and imaged with phosphorimaging screens. The intensities of the radioactive signals were read out by a Typhoon scanner and quantified using the ImageQuant software. Linear regression was used to fit the fraction of phosphate generated by GTP hydrolysis against time, giving the observed rate constants (kobsd). The kobsds were then fit to a Michaelis-Menten equation (Equation V), to extract the kcat and KM values for the single turnover hydrolysis reaction.
| Equation V |
Equation V was derived as following. Consider the reaction in a single turnover setup:
| (V.1) |
in which k1 and k-1 represent the association and dissociation constants, and k2 represents the catalytic rate constant for the chemistry step. Notice that in the single turnover setup, the amount of Rag GTPases is in excess of that of radioactively labeled GTP, so that the enzyme turnover, i.e. dissociation of GDP from the Rag, was omitted. Intermediary species are generated at the speed of:
| (V.2) |
| (V.3) |
Based on conservation of matter:
| (V.4) |
| (V.5) |
in which [Rag]0 and [GTP]0 represent the total concentration of the Rag GTPases and GTP at the beginning of the reaction. In a single turnover setup, where (1) the concentration of the Rag GTPases is much higher than that of GTP, and (2) the reaction is monitored within 20% of hydrolysis, we can approximate the equations above to:
| (V.6) |
| (V.7) |
Substitute (V.6) and (V.7) into (V.2), we obtain:
| (V.8) |
the solution of which is:
| (V.9) |
under the boundary condition that at time zero, [Rag•GTP] = 0. Notice that this equation can only be applied at the early stage of the reaction, before ~ 20% of the GTP has been hydrolyzed. When t > 0, the exponential term quickly diminishes to zero, so the concentration of the intermediate species [Rag•GTP] can be reduced to:
| (V.10) |
Define and substitute (V.10) into (V.3), and solve for the concentration of phosphate, we get:
| (V.11) |
Because the readout from TLC is the fraction of GTP that is hydrolyzed, we have:
| (V.12) |
in which is the observed rate constant at a given Rag concentration.
Notice that the TLC assay cannot differentiate GTP hydrolysis from individual subunits of the wildtype Rag GTPases. Therefore, the measured kcat and Km are the weighted average of the kcat and Km values for RagA and RagC. Considering the similar on-rates of GTP to RagA and RagC, and that RagA(T21N)-RagC and RagA-RagC(S75N) behave similarly in both single and multiple turnover reactions (Figure 3I–K), the true values of kcat and Km for RagA and RagC should be similar and close to the measured values.
For the half-site GTP hydrolysis reaction in Figure 3L, 10 μM of wildtype RagA-RagC was pre-equilibrated with 12 μM of unlabeled nucleotides (1.2 equal molar). After the Rags were singly loaded, ~ 0.1 nM of γ-32P-GTP was added to the mixture to start the reaction. Time points were taken and analyzed as above, and the observed hydrolysis rates were obtained by applying linear regression to the radioactive signals against time.
For the half-site hydrolysis chase reaction in Figure 3O, ~ 0.1 nM of γ-32P-GTP was first incubated with 200 nM of wildtype RagA-RagC to start the reaction. Six time points were taken, before 100 μM of unlabeled nucleotides were added to the reaction mixture, after which more time points were taken. The observed hydrolysis rates were obtained by applying linear regression to the radioactive signals against time.
For GATOR1- and FLCN-FNIP2-stimulated GTP hydrolysis reaction under single turnover conditions, increasing amounts of GATOR1 or FLCN-FNIP2 were included in the reaction that measures the hydrolysis rate of ~ 0.1 nM of γ-32P-GTP by 50 nM wildtype or mutant Rag GTPases. Time points were taken at each GATOR1 or FLCN-FNIP2 concentration to trace the reaction, and analyzed as above.
Multiple turnover GTP hydrolysis experiments
To determine the hydrolysis rates of the Rag GTPases under multiple turnover conditions, a fixed amount of Rag GTPases (2 μM for wildtype Rags), was incubated with increasing amounts of GTP doped with a trace amount of γ-32P-GTP. The total GTP concentration used to determine the kinetic parameters for multiple turnover GTP hydrolysis of wildtype Rags are 2, 5, 10, 20, 50, and 100 μM (Figure 3G). The reactions were treated and analyzed similarly as above. Linear regression was used to fit the fraction of phosphate generated by GTP hydrolysis against time, generating the observed rate constants (kobsd). The kobsds were then fit to a Michaelis-Menten equation (Equation VI), to extract the kcat and KM values for the multiple turnover hydrolysis reaction.
| Equation VI |
Equation VI was derived as following. Consider the reaction in a multiple turnover setup:
| (VI.1) |
in which k1 and k-1 represent the association and dissociation constants; k2 represents the catalytic rate for the chemistry step; k3 represents the dissociation constant of GDP. Because GDP dissociation is fast as determined by the off-rate measurement and GTP concentration is high, the intermediary species Rag•GDP can be omitted. Therefore, at the initial stage of the reaction (early steady-state), the intermediates are generated at the speed of:
| (VI.2) |
| (VI.3) |
Using the steady-state assumption and conservation of matter:
| (VI.4) |
the rate of GTP being hydrolyzed can be written as:
| (VI.5) |
Let and since the readout from TLC is the fraction of GTP that is hydrolyzed, we have:
| (VI.6) |
in which is the observed rate constant at a given GTP concentration.
Similarly, the measured kcat and Km here are the weighted average of the kcat and Km values for RagA and RagC, which in principle should be close to one another.
For GATOR1- and FLCN-FNIP2-stimulated GTP hydrolysis reactions under multiple turnover conditions, increasing amounts of GATOR1 or FLCN-FNIP2 were included in the reaction that monitors the hydrolysis rate of 250 μM GTP by 2 μM wildtype or mutant Rag GTPases. Time points were taken at each GATOR1 or FLCN-FNIP2 concentration to trace the reaction, and analyzed as above.
Free energy diagram
The free energy diagrams in Figure 1R and 1S were constructed based on the experimentally determined reaction rates and equilibrium constants using the standard state of 1 μM. For free-energy change at equilibrium, we used Equation VII:
| Equation VII |
in which R = 1.987 cal mol−1 K−1, T = 277 K, and K is the equilibrium constant measured experimentally. For activation barrier, we used Equation VIII:
| Equation VIII |
in which R = 1.987 cal mol−1 K−1, T = 277 K, kB = 3.33 × 10⁻²⁴ cal K−1, h = 1.583 × 10⁻³⁴ cal sec, and k is the experimentally measured rate constant.
Preparation of cell lysates and immunoprecipitates
To determine the response of mTORC1 to amino acid stimulation or starvation under the control of Rag mutants, two million HEK-293T cells were plated onto a 10-cm dish. 24 hours later, the cells were transfected with 2 ng of Flag-S6K1 and 100 ng of each Rag mutants. 36 hours later, amino acid stimulation or starvation was performed based on the procedure shown in Figures 6B and 6C. Cells were rinsed once with ice-cold PBS and lysed with Triton lysis buffer (40 mM NaHEPES, pH 7.4; 5 mM MgCl2; 100 μM ATP; 10 mM Na4P2O7; 10 mM Na β-glycerol phosphate; 1% Triton; and one tablet of protease inhibitor cocktail per 25 ml of buffer). The lysates were cleared by centrifugation at 15,000 rpm at 4°C in a microcentrifuge for 10 minutes. For anti-FLAG immunoprecipitations, the FLAG-M2 beads were pre-equilibrated in Triton lysis buffer. 30 μl of a 50/50 slurry of the FLAG-M2 affinity beads was then added to cleared lysates and incubated at 4 °C for two hours. Following immunoprecipitation, the beads were washed one time with Triton lysis buffer and 3 times with Triton lysis buffer supplemented with 500 mM NaCl. Immunoprecipitated proteins were denatured by the addition of 50 μl of 2.5×SDS buffer, resolved by SDS-PAGE, and analyzed by immunoblotting. Western blots were quantified using ImageJ software.
For the time-course experiments (Figure 6D and 6E), HEK-293T cells were treated and lysed at precise time points, and the pS6K1 level was visualized as the indicator of mTORC1 activity.
Western blots were quantified using ImageJ software.
Lysine modification assay
To detect the conformational changes of Rag GTPases in different nucleotide loading state, we adapted a lysine modification assay. Aliquots of 0.5 μg/μl wildtype Rag GTPase were first incubated with 200 μM GDP, 100 μM GDP and 100 μM GTP, or buffer on ice for two hours. 4 mM Sulfo-NHS-acetate was then added to the mixture, to irreversibly modify the amine group on the lysine side chain. The reactions were quenched by 0.2 M Tris-HCl (pH 8.0) after 10 minutes. The products were digested by chymotrypsin and the peptides were identified by mass spectrometry. Total ion current (TIC) for the peptide that contains modified lysine residue was used to quantify the modification efficiency.
QUANTIFICATION AND STATISTICAL ANALYSIS
All the kinetic assays were repeated at least three times, and the results were reported with Mean ± SEM.
Supplementary Material
Highlights.
The Rag GTPase dimer uses a “locking mechanism” to regulate its nucleotide state.
The binding of GTP to one subunit prevents GTP from associating with the other.
Unexpected GTP binding in the locked conformation leads to stimulation of hydrolysis.
The locking mechanism is necessary for the normal response of mTORC1 to amino acids.
Acknowledgments
We thank all members of the Sabatini Laboratory for helpful insights. We thank Dr. Shu-ou Shan for critical reading of the manuscript. This work was supported by grants from the NIH (R01 CA103866, R01 CA129105 and R37 AI47389) and Department of Defense (W81XWH-15-1-0230) to D.M.S., and fellowship support from the Life Sciences Research Foundation to K.S, where he is a Pfizer Fellow. D.M.S. is an investigator of the Howard Hughes Medical Institute.
Footnotes
Publisher's Disclaimer: This is a PDF file of an unedited manuscript that has been accepted for publication. As a service to our customers we are providing this early version of the manuscript. The manuscript will undergo copyediting, typesetting, and review of the resulting proof before it is published in its final citable form. Please note that during the production process errors may be discovered which could affect the content, and all legal disclaimers that apply to the journal pertain.
Author Contributions
K.S. and D.M.S. initiated the project and K.S. designed the research plan. K.S. performed all the experiments and analyzed the data with input from A.C. K.S. wrote and D.M.S. edited the manuscript.
References
- Bar-Peled L, Chantranupong L, Cherniack AD, Chen WW, Ottina KA, Grabiner BC, Spear ED, Carter SL, Meyerson M, Sabatini DM. A Tumor suppressor complex with GAP activity for the Rag GTPases that signal amino acid sufficiency to mTORC1. Science. 2013;340:1100–1106. doi: 10.1126/science.1232044. [DOI] [PMC free article] [PubMed] [Google Scholar]
- De Franceschi N, Wild K, Schlacht A, Dacks JB, Sinning I, Filippini F. Longin and GAF domains: structural evolution and adaptation to the subcellular trafficking machinery. Traffic. 2014;15:104–121. doi: 10.1111/tra.12124. [DOI] [PubMed] [Google Scholar]
- Dibble CC, Manning BD. Signal integration by mTORC1 coordinates nutrient input with biosynthetic output. Nat Cell Biol. 2013;15:555–564. doi: 10.1038/ncb2763. [DOI] [PMC free article] [PubMed] [Google Scholar]
- Efeyan A, Comb WC, Sabatini DM. Nutrient-sensing mechanisms and pathways. Nature. 2015;517:302–310. doi: 10.1038/nature14190. [DOI] [PMC free article] [PubMed] [Google Scholar]
- Feig LA, Cooper GM. Inhibition of NIH 3T3 cell proliferation by a mutant ras protein with preferential affinity for GDP. Mol Cell Biol. 1988;8:3235–3243. doi: 10.1128/mcb.8.8.3235. [DOI] [PMC free article] [PubMed] [Google Scholar]
- Fersht A. Structure and Mechanism in Protein Science. Macmillan; 1999. [Google Scholar]
- Feuerstein J, Goody RS, Wittinghofer A. Preparation and characterization of nucleotide-free and metal ion-free p21 “apoprotein”. J Biol Chem. 1987;262:8455–8458. [PubMed] [Google Scholar]
- Frech M, Darden TA, Pedersen LG, Foley CK, Charifson PS, Anderson MW, Wittinghofer A. Role of glutamine-61 in the hydrolysis of GTP by p21H-ras: an experimental and theoretical study. Biochemistry. 1994;33:3237–3244. doi: 10.1021/bi00177a014. [DOI] [PubMed] [Google Scholar]
- Gong R, Li L, Liu Y, Wang P, Yang H, Wang L, Cheng J, Guan KL, Xu Y. Crystal structure of the Gtr1p-Gtr2p complex reveals new insights into the amino acid-induced TORC1 activation. Genes Dev. 2011;25:1668–1673. doi: 10.1101/gad.16968011. [DOI] [PMC free article] [PubMed] [Google Scholar]
- González A, Hall MN. Nutrient sensing and TOR signaling in yeast and mammals. Embo J. 2017;36:397–408. doi: 10.15252/embj.201696010. [DOI] [PMC free article] [PubMed] [Google Scholar]
- Guo X, Bandyopadhyay P, Schilling B, Young MM, Fujii N, Aynechi T, Guy RK, Kuntz ID, Gibson BW. Partial acetylation of lysine residues improves intraprotein cross-linking. Anal Chem. 2008;80:951–960. doi: 10.1021/ac701636w. [DOI] [PubMed] [Google Scholar]
- Hall BE, Bar-Sagi D, Nassar N. The structural basis for the transition from Ras-GTP to Ras-GDP. Proc Natl Acad Sci USa. 2002;99:12138–12142. doi: 10.1073/pnas.192453199. [DOI] [PMC free article] [PubMed] [Google Scholar]
- Hwang YW, Miller DL. A mutation that alters the nucleotide specificity of elongation factor Tu, a GTP regulatory protein. J Biol Chem. 1987;262:13081–13085. [PubMed] [Google Scholar]
- Inoki K, Li Y, Xu T, Guan KL. Rheb GTPase is a direct target of TSC2 GAP activity and regulates mTOR signaling. Genes Dev. 2003;17:1829–1834. doi: 10.1101/gad.1110003. [DOI] [PMC free article] [PubMed] [Google Scholar]
- Jeong JH, Lee KH, Kim YM, Kim DH, Oh BH, Kim YG. Crystal structure of the Gtr1p(GTP)-Gtr2p(GDP) protein complex reveals large structural rearrangements triggered by GTP-to-GDP conversion. J Biol Chem. 2012;287:29648–29653. doi: 10.1074/jbc.C112.384420. [DOI] [PMC free article] [PubMed] [Google Scholar]
- Jewell JL, Russell RC, Guan KL. Amino acid signalling upstream of mTOR. Nat Rev Mol Cell Biol. 2013;14:133–139. doi: 10.1038/nrm3522. [DOI] [PMC free article] [PubMed] [Google Scholar]
- Jung J, Genau HM, Behrends C. Amino Acid-Dependent mTORC1 Regulation by the Lysosomal Membrane Protein SLC38A9. Mol Cell Biol. 2015;35:2479–2494. doi: 10.1128/MCB.00125-15. [DOI] [PMC free article] [PubMed] [Google Scholar]
- Leipe DD, Kabsch W, Koonin EV, Aravind L. Classification and evolution of P-loop GTPases and related ATPases. J Mol Biol. 2002;317:41–72. doi: 10.1006/jmbi.2001.5378. [DOI] [PubMed] [Google Scholar]
- Levine TP, Daniels RD, Wong LH, Gatta AT, Gerondopoulos A, Barr FA. Discovery of new Longin and Roadblock domains that form platforms for small GTPases in Ragulator and TRAPP-II. Small GTPases. 2013;4:62–69. doi: 10.4161/sgtp.24262. [DOI] [PMC free article] [PubMed] [Google Scholar]
- Li Y, Inoki K, Guan KL. Biochemical and Functional Characterizations of Small GTPase Rheb and TSC2 GAP Activity. Mol Cell Biol. 2004;24:7965–7975. doi: 10.1128/MCB.24.18.7965-7975.2004. [DOI] [PMC free article] [PubMed] [Google Scholar]
- Long PA, Zimmermann MT, Kim M, Evans JM, Xu X, Olson TM. De novo RRAGC mutation activates mTORC1 signaling in syndromic fetal dilated cardiomyopathy. Hum Genet. 2016;135:909–917. doi: 10.1007/s00439-016-1685-3. [DOI] [PMC free article] [PubMed] [Google Scholar]
- Menon S, Dibble CC, Talbott G, Hoxhaj G, Valvezan AJ, Takahashi H, Cantley LC, Manning BD. Spatial Control of the TSC Complex Integrates Insulin and Nutrient Regulation of mTORC1 at the Lysosome. Cell. 2014;156:771–785. doi: 10.1016/j.cell.2013.11.049. [DOI] [PMC free article] [PubMed] [Google Scholar]
- Nakashima N, Noguchi E, Nishimoto T. Saccharomyces cerevisiae putative G protein, Gtr1p, which forms complexes with itself and a novel protein designated as Gtr2p, negatively regulates the Ran/Gsp1p G protein cycle through Gtr2p. Genetics. 1999;152:853–867. doi: 10.1093/genetics/152.3.853. [DOI] [PMC free article] [PubMed] [Google Scholar]
- Nowak E, Goody RS. Kinetics of adenosine 5″-triphosphate and adenosine 5″-diphosphate interaction with G-actin. Biochemistry. 1988;27:8613–8617. doi: 10.1021/bi00423a016. [DOI] [PubMed] [Google Scholar]
- Okosun J, Wolfson RL, Wang J, Araf S, Wilkins L, Castellano BM, Escudero-Ibarz L, Al Seraihi AF, Richter J, Bernhart SH, et al. Recurrent mTORC1-activating RRAGC mutations in follicular lymphoma. Nat Genet. 2015 doi: 10.1038/ng.3473. [DOI] [PMC free article] [PubMed] [Google Scholar]
- Pai EF, Krengel U, Petsko GA, Goody RS, Kabsch W, Wittinghofer A. Refined crystal structure of the triphosphate conformation of H-ras p21 at 1.35 A resolution: implications for the mechanism of GTP hydrolysis. Embo J. 1990;9:2351. doi: 10.1002/j.1460-2075.1990.tb07409.x. [DOI] [PMC free article] [PubMed] [Google Scholar]
- Panchaud N, Péli-Gulli MP, De Virgilio C. Amino acid deprivation inhibits TORC1 through a GTPase-activating protein complex for the Rag family GTPase Gtr1. Sci Signal. 2013;6:ra42. doi: 10.1126/scisignal.2004112. [DOI] [PubMed] [Google Scholar]
- Peluso P, Shan SO, Nock S, Herschlag D, Walter P. Role of SRP RNA in the GTPase Cycles of Ffh and FtsY †. Biochemistry. 2001;40:15224–15233. doi: 10.1021/bi011639y. [DOI] [PubMed] [Google Scholar]
- Petit CS, Roczniak-Ferguson A, Ferguson SM. Recruitment of folliculin to lysosomes supports the amino acid-dependent activation of Rag GTPases. J Cell Biol. 2013;202:1107–1122. doi: 10.1083/jcb.201307084. [DOI] [PMC free article] [PubMed] [Google Scholar]
- Rebsamen M, Pochini L, Stasyk T, de Araujo MEG, Galluccio M, Kandasamy RK, Snijder B, Fauster A, Rudashevskaya EL, Bruckner M, et al. SLC38A9 is a component of the lysosomal amino acid sensing machinery that controls mTORC1. Nature. 2015 doi: 10.1038/nature14107. [DOI] [PMC free article] [PubMed] [Google Scholar]
- Saito K, Araki Y, Kontani K, Nishina H, Katada T. Novel role of the small GTPase Rheb: its implication in endocytic pathway independent of the activation of mammalian target of rapamycin. J Biochem. 2005;137:423–430. doi: 10.1093/jb/mvi046. [DOI] [PubMed] [Google Scholar]
- Sancak Y, Bar-Peled L, Zoncu R, Markhard AL, Nada S, Sabatini DM. Ragulator-Rag complex targets mTORC1 to the lysosomal surface and is necessary for its activation by amino acids. Cell. 2010;141:290–303. doi: 10.1016/j.cell.2010.02.024. [DOI] [PMC free article] [PubMed] [Google Scholar]
- Sancak Y, Peterson TR, Shaul YD, Lindquist RA, Thoreen CC, Bar-Peled L, Sabatini DM. The Rag GTPases bind raptor and mediate amino acid signaling to mTORC1. Science. 2008;320:1496–1501. doi: 10.1126/science.1157535. [DOI] [PMC free article] [PubMed] [Google Scholar]
- Saucedo LJ, Gao X, Chiarelli DA, Li L, Pan D, Edgar BA. Rheb promotes cell growth as a component of the insulin/TOR signalling network. Nat Cell Biol. 2003;5:566–571. doi: 10.1038/ncb996. [DOI] [PubMed] [Google Scholar]
- Scheffzek K, Ahmadian MR, Kabsch W, Wiesmüller L, Lautwein A, Schmitz F, Wittinghofer A. The Ras-RasGAP complex: structural basis for GTPase activation and its loss in oncogenic Ras mutants. Science. 1997;277:333–338. doi: 10.1126/science.277.5324.333. [DOI] [PubMed] [Google Scholar]
- Schürmann A, Brauers A, Massmann S, Becker W, Joost HG. Cloning of a novel family of mammalian GTP-binding proteins (RagA, RagBs, RagB1) with remote similarity to the Ras-related GTPases. J Biol Chem. 1995;270:28982–28988. doi: 10.1074/jbc.270.48.28982. [DOI] [PubMed] [Google Scholar]
- Shan SO. ATPase and GTPase Tangos Drive Intracellular Protein Transport. Trends Biochem Sci. 2016 doi: 10.1016/j.tibs.2016.08.012. [DOI] [PMC free article] [PubMed] [Google Scholar]
- Shaw RJ, Cantley LC. Ras, PI(3)K and mTOR signalling controls tumour cell growth. Nature. 2006;441:424–430. doi: 10.1038/nature04869. [DOI] [PubMed] [Google Scholar]
- Simon I, Zerial M, Goody RS. Kinetics of interaction of Rab5 and Rab7 with nucleotides and magnesium ions. J Biol Chem. 1996;271:20470–20478. doi: 10.1074/jbc.271.34.20470. [DOI] [PubMed] [Google Scholar]
- Stocker H, Radimerski T, Schindelholz B, Wittwer F, Belawat P, Daram P, Breuer S, Thomas G, Hafen E. Rheb is an essential regulator of S6K in controlling cell growth in Drosophila. Nat Cell Biol. 2003;5:559–565. doi: 10.1038/ncb995. [DOI] [PubMed] [Google Scholar]
- Sweet DJ, Gerace L. A GTPase distinct from Ran is involved in nuclear protein import. J Cell Biol. 1996;133:971–983. doi: 10.1083/jcb.133.5.971. [DOI] [PMC free article] [PubMed] [Google Scholar]
- Tsun ZY, Bar-Peled L, Chantranupong L, Zoncu R, Wang T, Kim C, Spooner E, Sabatini DM. The Folliculin Tumor Suppressor Is a GAP for the RagC/D GTPases That Signal Amino Acid Levels to mTORC1. Mol Cell. 2013 doi: 10.1016/j.molcel.2013.09.016. [DOI] [PMC free article] [PubMed] [Google Scholar]
- Vetter IR, Nowak C, Nishimoto T, Kuhlmann J, Wittinghofer A. Structure of a Ran-binding domain complexed with Ran bound to a GTP analogue: implications for nuclear transport. Nature. 1999;398:39–46. doi: 10.1038/17969. [DOI] [PubMed] [Google Scholar]
- Wang S, Tsun ZY, Wolfson RL, Shen K, Wyant GA, Plovanich ME, Yuan ED, Jones TD, Chantranupong L, Comb W, et al. Lysosomal amino acid transporter SLC38A9 signals arginine sufficiency to mTORC1. Science. 2015 doi: 10.1126/science.1257132. [DOI] [PMC free article] [PubMed] [Google Scholar]
- Wang Y, Nakashima N, Sekiguchi T, Nishimoto T. Saccharomyces cerevisiae GTPase complex: Gtr1p-Gtr2p regulates cell-proliferation through Saccharomyces cerevisiae Ran-binding protein, Yrb2p. Biochem Biophys Res Commun. 2005;336:639–645. doi: 10.1016/j.bbrc.2005.08.108. [DOI] [PubMed] [Google Scholar]
- Wong M. A critical review of mTOR inhibitors and epilepsy: from basic science to clinical trials. Expert Rev Neurother. 2013;13:657–669. doi: 10.1586/ern.13.48. [DOI] [PMC free article] [PubMed] [Google Scholar]
- Yue VT, Schimmel PR. Direct and specific photochemical crosslinking of adenosine 5′-triphosphate to an aminoacyl-tRNA synthetase. Biochemistry. 1977;16:4678–4684. doi: 10.1021/bi00640a023. [DOI] [PubMed] [Google Scholar]
Associated Data
This section collects any data citations, data availability statements, or supplementary materials included in this article.