
Figure 5.
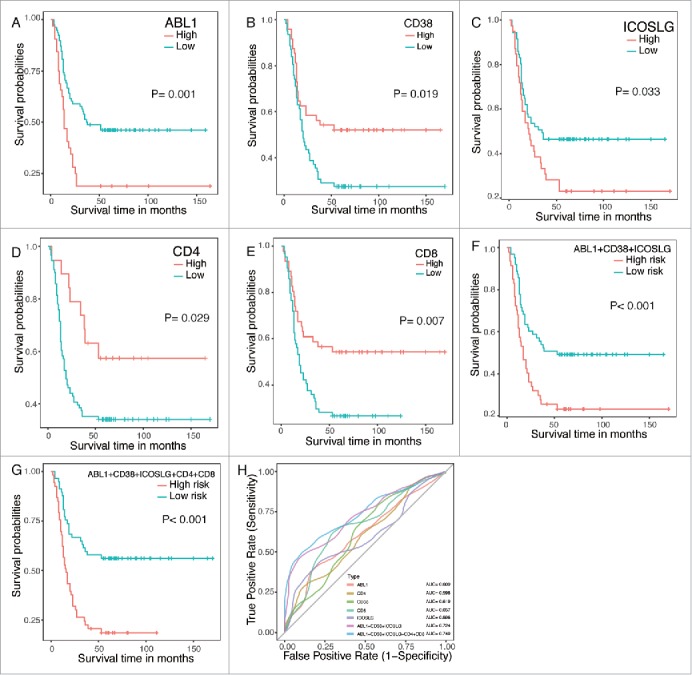
IHC validations of prognostic factors in ESCC. The independent prognostic factors ABL1, CD38 and ICOSLG were chosen as candidates in the validations. CD4+ and CD8+ T lymphocytes were also detected as controls. Panel A to E. Kaplan-Meier plots of each gene with red line represent high expression group while blue lines represent low expression group. Panel F and G. Kaplan-Meier plots of predictors built with the specific genes. Panel H. ROC curves of each parameters with AUC scores.