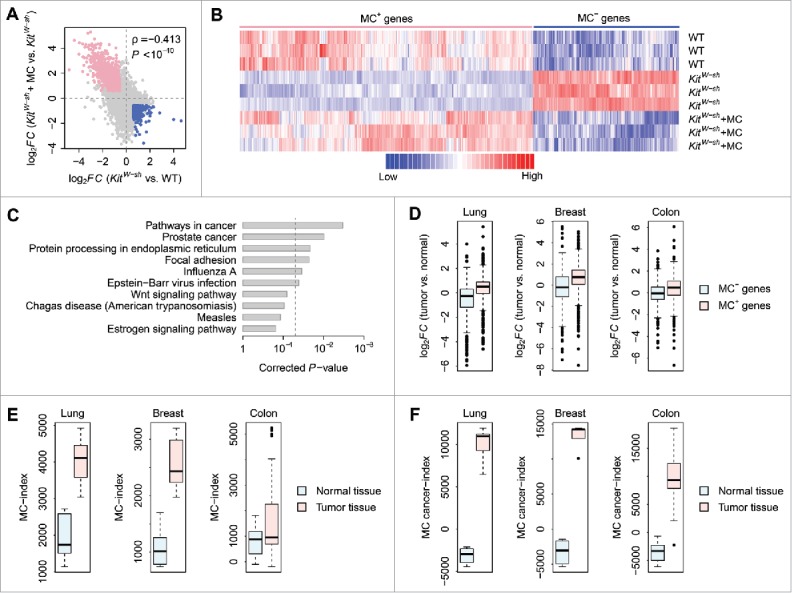
Figure 1.

The mast cell–dependent mouse genes. (A) Correlation in log2-transformed gene expression fold change (log2FC) between KitW-sh and WT mice (X-axis) and between KitW-sh+MC and KitW-sh mice (Y-axis). Each dot stands for a gene. The log2FC between KitW-sh and WT mice is negatively correlated with the log2FC between KitW-sh+MC and KitW-sh mice. Only the genes differentially expressed between KitW-sh and WT mice and between KitW-sh+MC and KitW-sh mice in opposite direction were considered as mast cell–dependent genes. The pink dots denote the genes downregulated in mast cell–deficient mice but recovered after mast cell engraftment (MC+ genes). The blue dots represent the genes upregulated in mast cell–deficient mice but recovered after mast cell engraftment (MC− genes). (B) Gene expression heatmap of the MC+ and MC− genes. Each row in the heatmap denotes one mouse while each column denotes one gene. Red represents relatively increased gene expression whereas blue represents downregulation. (C) The top 10 KEGG pathways associated with the mast cell–dependent genes. The P-values were computed by Fisher's exact test and corrected by the Benjamini-Hochberg procedure. The vertical dash-line denotes the significance level of α = 0.05. (D) Gene expression fold change of the MC+ and MC− genes between mouse tumor and normal tissues. The expression pattern of both the MC+ and MC− genes in mouse lung, breast, and colon tumors was compared with normal lung, breast, and colon tissues, respectively. Y-axis denotes the log2FC between tumor and normal tissues. (E) Comparison of MC-index between mouse tumor and normal tissues. (F) Comparison of MC cancer-index between mouse tumor and normal tissues.
