Abstract
This paper builds on the work of Mett and Hyde [J. Magn. Reson. 165 (2003) p.137] and Sidabras, Mett, and Hyde [J. Magn. Reson. 172 (2005) p.333] where multiple flat aqueous sample cells placed perpendicular to electric fields in microwave cavities were used to reduce the rf losses and increase the EPR signal. In this work, we present three novel sample holders for loop-gap resonators (LGRs) and cylindrical cavity geometries. Two sample holders have been commissioned and built by polytetrafluoroethylene (PTFE) extrusion techniques: a 1 mm O.D. capillary with a septum down the middle, named DoubleDee, and a 3.5 mm O.D. star shaped sample holder, named AquaStar. Simulations and experimental results at X-band show that the EPR signal intensity increases by factors of 1.43 and 3.87 in the DoubleDee and AquaStar respectively, over the current TPX 0.9 mm O.D. sample tube in a two-loop–one-gap LGR. Finally, combining the insight gained from the constructed sample holders and finite-element solutions, a third multi-lumen sample holder for a cylindrical TE011 cavity is optimized, named AquaSun, where simulations show an EPR signal intensity increase by a factor of 8.2 over a standard 1 mm capillary.
Keywords: loop-gap resonator, electron paramagnetic resonance, cylindrical symmetry, multi-lumen sample holders, aqueous samples
Graphical Abstract
1. Introduction
We consider in this paper the subject of sample-cell design for reduced dielectric loss from aqueous samples in loop-gap resonators (LGR), Fig. 1. One-gap LGRs as well as multi-gap LGRs necessarily exhibit loss arising from RF voltage potentials across the gaps that extend into the sample. A cylindrical sample tube in an LGR is surrounded by the metallic wall of the sample loop, and the electric field vectors must everywhere be perpendicular to a metallic surface. Voltages vary from gap-to-gap and RF current flows, which is the source of ohmic losses. The pattern of electric field vectors within the sample depends not only on these circumferential voltages, but also on the orientation of electric field vectors with respect to the surface of the aqueous sample.
Figure 1.
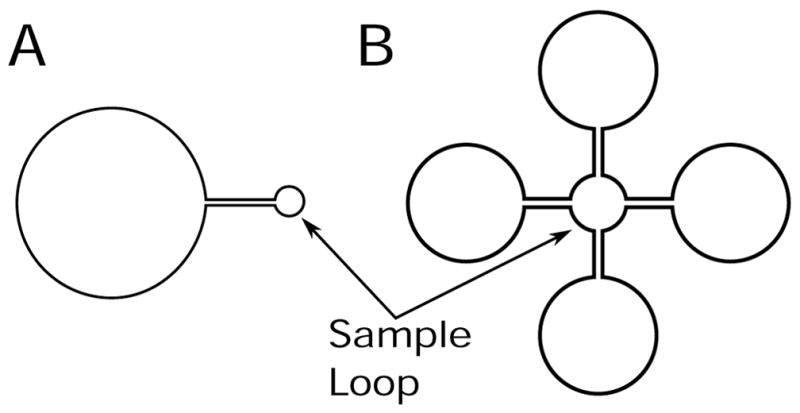
Two LGR geometries: (a) a two-loop–one-gap with a 1 mm sample loop and b) a five-loop–four-gap with a 5 mm sample loop.
Our understanding of aqueous sample losses in an LGR is derived from experience with various types of sample holders used in cavity resonators. Introduction by Varian of a commercial rectangular TE102 cavity for EPR spectroscopy at X-band led to the subsequent introduction of the so-called quartz flat cell to constrain aqueous samples to the nodal plane in the center of the cavity. If the cell is sufficiently thin and encompasses this plane, dielectric loss is low and the cavity Q-value is reasonably high. The signal-to-noise ratio (SNR) is improved relative to use of a cylindrical capillary and proportional to volume. Customers soon discovered that the flat cell functioned well not only when oriented to lie in this nodal plane but also when rotated 90° such that the microwave electric field incident on the cell was perpendicular to the cell surface. Hyde [1] provided a theoretical explanation, namely, the discontinuity of the electric field that occurs in the perpendicular orientation because of the high dielectric constant of water. He also showed that the signal intensity could be improved further by an assembly of three flat-cells in this orientation. Eaton and Eaton [2] confirmed this multi-cell finding, and more recently Mett and Hyde [3] and Sidabras et. al [4] provided a full analysis of multiple flat cells in perpendicular orientation.
Mett and Hyde [3] characterized three types of loss. Type I loss is associated with electric field vectors that are tangential to the sample surface. These vector components must be continuous across the interface between free space and dielectric or between two dielectrics. Type II loss is associated with the discontinuity of electric field vectors E that are perpendicular to the sample surface. The perpendicular component of E becomes displacement D, and polarization charges are present on the surface. Although dielectric losses associated with perpendicular electric fields are greatly reduced, they nevertheless are present. Furthermore, if there is a tangential gradient of E, there will necessarily be a gradient of surface charges, which implies the presence of additional Type I loss. Finally, Type III loss is associated with the complexity of electric field found on the ends of a flat cell.
Soon after Varian’s commercial EPR initiative, JEOL Ltd. offered an EPR spectrometer for sale that utilized a cylindrical TE011 microwave cavity. Perhaps surprisingly, it was discovered that a flat cell inserted along the axis of the JEOL cavity worked well. The lines of electric field are circular about the axis of this cavity, and therefore tend to be perpendicular to the flat cell if it is sufficiently thin. Thus, this finding in cylindrical geometry is consistent with Hyde’s work on the perpendicular orientation of a flat cell in the rectangular TE102 cavity: the electric field vector is discontinuous and dielectric losses in water are reduced. We have discussed this geometry briefly [5]. However, discussion of the use of a flat cell in a cylindrical TE011 cavity in the formal scientific literature is not extensive.
Mett and Hyde [3] analytically optimized multi-stacked flat cells perpendicular to the electric field in a rectangular TE102 cavity. However, because the flat cell breaks cylindrical symmetry, a similar analytical approach in cylindrical geometry is not available. Instead, insight gained from the rectangular geometry is combined with observations of the fields, losses, and EPR signal using ANSYS High Frequency Structure Simulator (HFSS, Version 17.0; Canonsburg, PA) to develop sample holders of complex cross section with increased EPR signal. We provide in this paper simulations of electromagnetic RF fields for a flat cell in a cylindrical TE011 cavity as background for our central interest in design of aqueous sample cells for use in LGRs.
Sensitivity considerations studying the effects of the radius of a capillary and quartz dewar inserts in a cylindrical TE011 and Bruker SHQ cavity were presented by Nesmelov et al.[6]. In this work the enhancements due to dielectric effects were studied in detail. A third block of information on aqueous sample cells in cavity resonators stems from the introduction by Bruker of the AquaX cell, which is an array of 19 close-packed 0.5 mm sample bores. Nesmelov and Thomas [7] provide a detailed study of this class of sample geometries, and we also have considered the geometry [5].
If an aqueous sample is contained in a capillary that is inserted in a microwave resonator with the electric field perpendicular to the axis of the capillary, a somewhat different perspective with respect to dielectric loss is required. Equal and opposite polarization charges form on the leading and trailing sides of the capillary. These charges give rise to a field both within and outside the capillary that opposes the applied field. In a plane perpendicular to the capillary, the field resembles that of an electric line-dipole [8]. Type I losses dominate. As the diameter of the capillary increases, Type II losses begin to contribute. It is not necessary for the capillary to lie in an electric field node. For example, in the Bruker Aqua-X configuration the outer capillaries extend into electric field regions of substantial intensity.
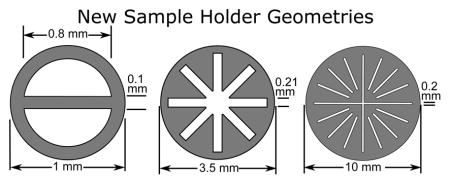
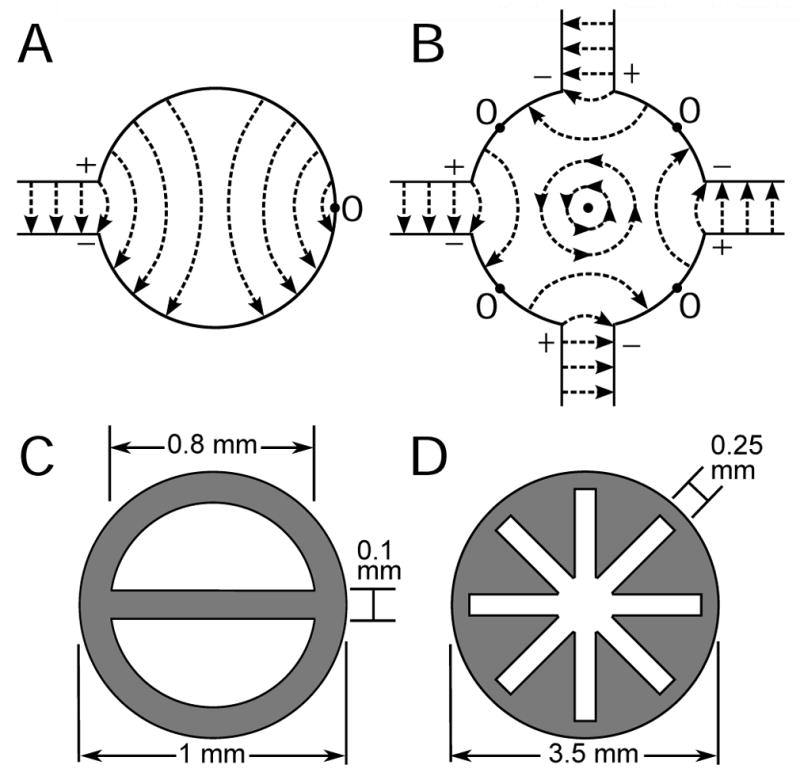
The three prototypical sample tube geometries of Fig. 2 are considered. We develop a polytetrafluoroethylene (PTFE) extrusion corresponding to Fig. 2A that can be used both in cylindrical TE011 cavity resonators and in the LGR of Fig. 1B. We explore the use of an extrusion that is divided into two lumen by a septum, Fig. 2B, thus effectively creating two capillaries that are dee shaped rather than circular. Finally, a third perspective is introduced, the so-called AquaSun, Fig. 2C, which can be simulated, but is at the edge of fabrication techniques. Our point is to combine aqueous sample methodologies in a thought experiment to provide an idea of what may be possible in future designs. This simulation was carried out in resonant cavity geometry, although it could have been done in LGR geometry.
Figure 2.
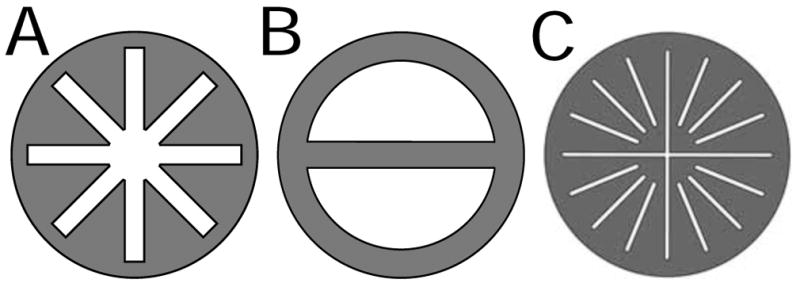
Three aqueous sample tube cross sections: (a) the AquaStar; (b) the DoubleDee; and (c) the AquaSun. Grey represents PTFE.
2. Methods
Finite-element simulations were performed on a Dell Precision T7500 workstation with dual six-core Xeon 5650 2.67 GHz processors with 12 MB of L2 Cache per chip and 124 GB of system DDR4 RAM. A RAM Drive was set up with 8 GB of RAM in order to reduce hard-drive bottlenecks. This system has been optimized for simulations and new versions of ANSYS HFSS are able to take advantage of all twelve CPUs during finite-element modeling matrix solving. The operating system was Windows 7 64-bit. The eigenmode solver was used and typical simulation times were 5 minutes. All simulations were performed at 9.5 GHz (X-band).
The goal in the design of the sample holders was to maximize EPR saturable signal intensity in two configurations: (i) in a two-loop–one-gap LGR with a 1.2 mm diameter sample loop and (ii) for 20–30 μL of sample. The sample was assumed to be in diluted aqueous solution (εr = 63.0 + i29.0) [9] and the sample holders were PTFE (εr = 2.1 + i0.0021) [10].
Extruded PTFE sample tubes were fabricated using multi-lumen extrusion techniques by Zeus Industrial Products, Inc. (Orangeburg, SC). Each design was shipped in one meter unrolled lengths.
A two-loop–one-gap LGR with 1.2 mm sample loop was used to compare a 0.6 mm I.D. TPX sample tube with a 1 mm O.D. PTFE Double-Dee, Fig. 2B, with the septum both perpendicular and parallel to the LGR gap. A five-loop–four-gap LGR was designed with a 5 mm sample loop optimized for the AquaStar, Fig. 2A. Experimental EPR sensitivity values were recorded at peak values of P1/2, which produced constant H1 (a saturable sample). The ratio of these intensities was then calculated and compared with finite-element ratios. EPR power saturation experiments were performed using 50 μM aqueous solution of degassed disodium nitrosodisulfonate (PADS; Frémy’s Salt) in an aqueous buffer at a pH of 9. Since the relaxation times T1 and T2 of Frémy’s Salt are known, the resonator efficiency, Λ with units of G/W1/2, can be directly calculated and scaled from the measured P1/2 value [6, 11, 12]. All tests were performed on a standard Bruker E500 X-band spectrometer.
Some geometries extend well into the electric field region of the TE011 cavity and may lie in a region where the H1 field is not uniform. Therefore, the effect of the magnetic field variation on the sample should be taken into account when calculating the resonator efficiency, which is defined at a point and assumes uniform field [13]. Here, we choose to define the resonator efficiency as an average over the sample volume,
| (1) |
where B1r is the clock-wise (or counter clock-wise) rotational component of the linear magnetic field perpendicular to the static magnetic field, in Gauss, integrated over the sample volume, V. In addition, Ps, Pw, and Pt are the power losses associated with the sample, walls, and sample holder, respectively. Saturable signal and Λ values were calculated using ANSYS HFSS solutions as described in Chapter 5 of Misra [5] and tabulated for comparison with the experimental data. All values were normalized to a 1 mm capillary in a cylindrical TE011 cavity.
3. Design Concepts
3.1. Simulations of a Flat Cell in a Cylindrical TE011 Cavity
Figure 3 illustrates the three types of loss as defined by Mett and Hyde [3] that occur when a flat cell containing water is placed in a cylindrical TE011 cavity. Figure 3A shows the geometry over which simulations were carried out. The circle is an aid to visualization of the geometry in cylindrical coordinates and has no physical significance. Figure 3B, C, and D show ANSYS HFSS solutions plotting the cylindrical electric field components along a concentric circle where ρ is 2.5 mm. In this and all the other field plots, the magnetic field magnitude in the center of the cavity (or LGR) was normalized to 1 A/m. The units of E/Hm in the plots are Ω. Type II electric field reduction is shown in Fig. 3B. Type I tangential electric field null is shown in Fig. 3C. Type III electric field complexity towards the end of the sample is shown in Fig. 3D. The Type III loss increase at the edge of the sample is still significantly smaller than if there is no sample present. The line dipole charge buildup on the edge of the sample opposes the incident electric field.
Figure 3.
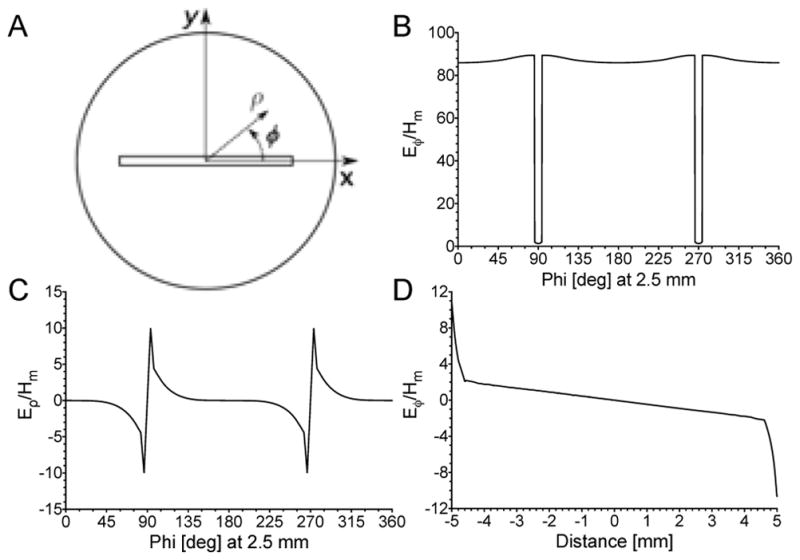
Cylindrical electric field components highlighting the three types of losses along a 2.5mm radius circle concentric within a TE011 cavity. A) Cross-section of a TE011 with a 8 × 0.2 mm flat-cell sample B) Electric field, Eϕ, showing the reduction of electric field in the sample from Type II losses, C) Electric field, Eρ, showing the tangential electric field null down the center of the sample cell, and D) Electric field, Eϕ, along the center of the sample showing the Type III complexity where the electric field increases towards the end of sample cell.
Figure 4 illustrates the same flat cell sample and cavity as Fig. 3 except that the electric field components are shown in color magnitude spatial cross section instead of a line drawing. The Type II, Type I, and Type III losses can be seen in Figs. 4A, B, and C and can be compared to Figs. 3B, C, and D, respectively.
Figure 4.
Electric field 2D plot showing the three types of losses established in Mett and Hyde [3] A) Plot of Eϕ showing Type II and Type III loss. B) Plot of Eρ showing the electric field tangential to the sample surface and C) a zoom of Eρ highlighting the Type I and Type III loss.
3.2. Loop-gap Resonator Geometries
In the loop-gap resonator geometries, electric fields in the gaps result in an electric field distribution as illustrated in Fig. 5. Projecting insight from Mett and Hyde [3] onto the loop-gap resonator geometry, distinct lines of electric field perpendicular to metallic surfaces can be visualized in the two-loop–one-gap, Fig. 5A, and the five-loop–four-gap, Fig. 5B, resonators. Potentials exist across each gap with polarities as shown in Fig. 5A and 5B. In Fig. 5B the potentials across the gaps are equal. The locations of electric field nulls are also indicated in Fig. 5 as zeroes. The two-loop–one-gap null is located at the point farthest from the gap, while the five-loop–four-gap nulls are located halfway between adjacent gaps.
Figure 5.
Illustration of the electric vector fields in the sample loop of A) a two-loop–one-gap 1.2 mm inner diameter and B) a five-loop–four-gap 5 mm inner diameter LGR. Shown are positions of zero electric field, marked as 0. Illustration of the two sample holder geometries with dimensions: C) the DoubleDee and D) the AquaStar.
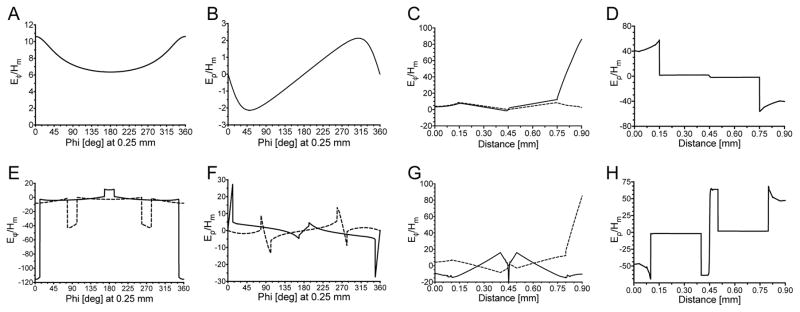
Typically a capillary of an optimized diameter is used in both the two-loop (0.9 mm O.D., 0.6 mm I.D.) or five-loop (0.9 mm O.D., 1.2. mm I.D.) resonator. Shown in Fig. 6A–D, is the electric field profile for a capillary in the two-loop–one-gap LGR. Fig. 6A is the Eϕ profile of the TPX capillary on a 0.25 mm radius circle concentric with a 0.5 mm LGR sample loop radius. A peak of the electric field is shown at the gap at 0°. A charge gradient along the sample boundary is formed inducing a tangential electric field which penetrates the sample. Figure 6B shows the Eρ profile along the same 0.25 mm radius circle. Here, the perpendicular field peaks around the gap and is strictly zero at 180°, consistent with the null of the electric field.
Figure 6.
Electric field profiles comparing the TPX capillary (A–D) with the DoubleDee (E–H) in a 1 mm I.D. 2-loop–1-gap LGR. A) Eϕ and B) Eρ along a 0.25 mm radius circle concentric with the sample loop, showing an electric field peak at the LGR gap at 0°. C) Eϕ along the line parallel to the gap (solid) and perpendicular to the gap (dashed), D) Eρ perpendicular to the gap. E) Eϕ showing discontinuities of the electric field at the DoubleDee septum and F) Eρ showing tangential electric field null. Plots are for septum orientations perpendicular (solid) and parallel (dashed) to the electric field along a 0.5 mm concentric circle. G) Eϕ perpendicular to the gap for the septum orientation parallel to the gap (solid) and Eϕ parallel to the gap for the septum orientation perpendicular to the gap (dashed). H) Eρ perpendicular to the gap for the septum orientation parallel to the gap.
The Eϕ profile along the diameter, shown in Fig. 6C, parallel to the gap (solid) shows an increase in the electric field at the gap consistent with Type II loss, while the line perpendicular to the gap (dashed) does not show edge effects. In Fig. 6D, the Eρ profile perpendicular to the gap shows a general reduction of the electric field caused by the sample and a charge gradient in the sample holder.
For the two-loop–one-gap geometry, placing a septum in the center of a capillary following the lines of perpendicular electric field, illustrated in Fig. 5A, results in the sample holder shown in Fig. 5C. This DoubleDee structure reduces the losses associated with the tangential electric field. Shown as a solid line in Fig. 6E, the electric field within the sample is reduced by an average of 2.5 within the sample compared to the tangential electric field in a TPX capillary, Fig. 6A.
Additionally electric field perpendicular component has been split into two separate component channels, shown in Fig. 6F further reducing the total electric field. However, increasing the number of channels becomes impractical at 1 mm diameter and simulations show no significant effects if two septa were placed orthogonal to each other. This is primarily due to a reduction of volume.
Rotating the septum 90° from the gap has a similar effect but less pronounced, shown in Fig. 6E and 6F as a dashed line. The septum still breaks up the circulating tangential fields induced by the electric field charge gradient on the surface of the sample, but the tangential electric field toward the gap is larger than when the septum is parallel to the LGR gap. The Eϕ profile along the diameter, shown dashed in Fig. 6G, parallel to the gap for the septum perpendicular to the gap shows an increase in the electric field at the gap (Type II loss), while perpendicular to the gap for the septum parallel to the gap (solid) does not show these edge effects and shows an overall reduced electric field. In Fig. 6H the Eρ profile perpendicular to the gap shows reduction of the electric field caused by the sample and the increase in electric field in the PTFE sample holder, consistent with Sidabras et al. [4]
In the five-loop–four-gap geometry, a series of four flat cells can be placed to take advantage of the perpendicular electric field lines and the electric field nulls. This geometry leads to the structure shown in Fig. 5D, where the electric field is illustrated in Fig. 7A. This multi-armed structure, named AquaStar, reduces losses in three fundamental ways illustrated by simulation in Fig. 7B–D. The first is to reduce the losses associated with the gaps and perpendicular fields by extending arms towards the gaps, shown in Fig. 7B every 90° starting at 0°. The second extends arms where the electric field nulls occur, shown in Fig. 7B every 90° starting at 45°. The third reduction comes from circulating electric fields present towards the center of the loop-gap created by Faraday’s law and the superposition of the electric fields from the gaps creating a gradient of charges along the arms, shown in Fig. 7C. This reduction occurs until the 4 arms connect in the center where circulating tangential electric field is the dominant source of loss, shown in Fig. 7D for the perpendicular (solid) and null (dashed) arms. It is interesting to note the two distinct tangential gradients in each arm depending on whether or not the arm is in an electric field null, at 45°, or perpendicular electric field, at 90°.
Figure 7.
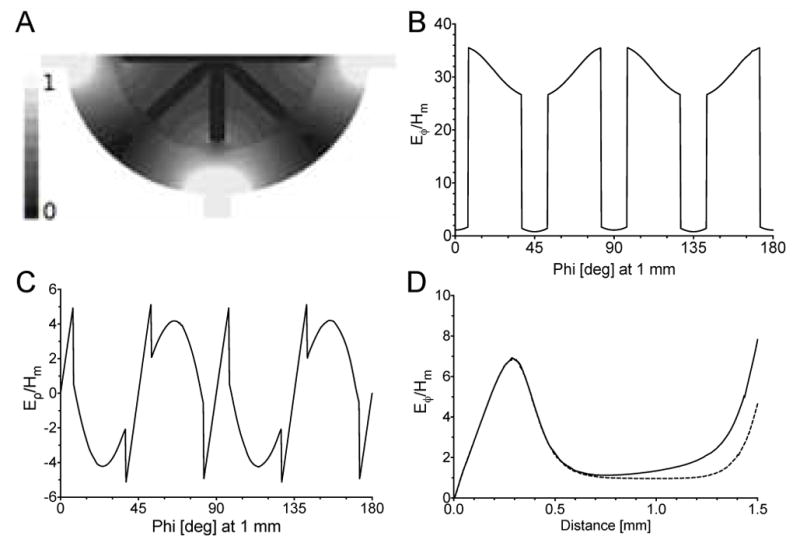
A) Electric field for the AquaStar geometry in the five-loop–four-gap LGR. B) Eϕ is plotted showing the Type II reduction in each sample cell and C) Eρ showing tangential electric field nulls in each sample cell at 45° increments. D) Eϕ along the center of the sample showing the Type III increase towards the end of sample cell for a cell parallel to the gap (solid) and parallel to the electric field null (dashed). Increase in electric field at 0.3 mm is formed from circulating tangential fields where the arms connect.
4. Results
Characteristics of simulated and measured data of the resonators with various sample cells are shown in Table 1. Shown are unloaded Q-values, which by definition do not account for the loading of the external circuit, see Ch. 7 of Ref. 14. EPR signal intensities are calculated or measured at constant microwave field (signal saturable condition) and normalized to a 1 mm capillary in a cylindrical TE011. The measured and simulated Λave can be directly compared. Good agreement is shown. The two-loop–one-gap simulations show a 50% better signal than the experimental results. This is caused by a lower than expected Q-value of the experimental resonator.
Table 1.
Resonator and sample cell characteristics calculated and measured. EPR signals are at constant microwave field and normalized to a 1 mm capillary in a cylindrical TE011, while Λave can be directly compared.
| Geometry | freq. [GHz] | Q-value | Norm. Signal | Λave [G/W1/2] | Vol. [μL] | ||||
|---|---|---|---|---|---|---|---|---|---|
| Meas. | Calc. | Meas. | Calc. | Meas. | Calc. | Meas. | Calc. | ||
|
| |||||||||
| Two-Loop–One-Gap | |||||||||
|
| |||||||||
| TPX (0.6 mm I.D.) | 9.23 | 9.34 | 204 | 268 | 0.21 | 0.32 | 5.61 | 4.37 | 2.2 |
| DoubleDee Par. | 9.31 | 9.41 | 419 | 408 | 0.31 | 0.43 | 6.83 | 5.32 | 3.2 |
| DoubleDee Perp. | 9.29 | 9.38 | 387 | 352 | 0.25 | 0.39 | 5.82 | 4.96 | 3.2 |
|
| |||||||||
| Five-Loop–Four-Gap | |||||||||
|
| |||||||||
| Capillary (1 mm I.D.) | 9.56 | 9.75 | 620 | 802 | 0.35 | 0.35 | 1.67 | 1.78 | 7 |
| AquaStar | 9.44 | 9.63 | 673 | 640 | 0.83 | 0.81 | 1.52 | 1.61 | 25 |
|
| |||||||||
| Cylindrical TE011 | |||||||||
|
| |||||||||
| Capillary (1 mm I.D.) | 9.86 | 9.58 | 3651 | 6640 | 1 | 1 | 1.12 | 1.45 | 30 |
| AquaX | 9.86 | 9.53 | 2466 | 4040 | 3.24 | 3.17 | 0.52 | 0.47 | 143 |
| AquaStar | 9.86 | 9.58 | 2530 | 5154 | 3.02 | 2.97 | 0.68 | 0.78 | 100 |
| AquaSun | – | 9.43 | – | 1848 | – | 8.18 | – | 0.52 | 396 |
Also shown in Table 1 is the simulated and calculated characteristics for four geometries in a cylindrical TE011 cavity: 1 mm capillary, Bruker AquaX, this paper’s AquaStar, and a proposed geometry AquaSun. Circulating electric fields in the ϕ-direction of the cylindrical TE011 resonator allow the AquaStar to be advantageous, leading to improved EPR signal intensities. Electric field lines are similar to that of the five-loop–four-gap resonator, except each arm is in a perpendicular field since there are no nulls. The Q-value of the system is 2.5 times higher with the AquaStar compared to the Bruker AquaX and half the volume yields a similar signal intensity.
Additional comparison of the multi-bore Bruker AquaX is shown. Bruker AquaX consists of 19 0.5 mm I.D. capillaries in a close-packed geometry bundle. The bundle is either a set of 0.1 mm wall thickness quartz capillaries or a single PTFE extrusion, depending on the version. It was shown in Sidabras et al. [4] that the optimum EPR signal enhancement will occur when the sample holder has the lowest dielectric constant, due to an increase of electric field charge gradient. Therefore, measurements and simulations are performed on the PTFE extrusion version. Results are presented in Table 1.
The design of the AquaSun, illustrated in Fig. 8A, separates the sample into a multi-lumen flat cell structure. The AquaSun consists of 16 evenly azimuthally spaced flat cells each with a thickness of 0.15 mm including two flat cells crossing in the center. The design is limited by a Q-value of 2000 as a practical limit for tuning and matching. Shown in Fig. 8B is the reduction of the electric field and Fig. 8C shows the null centered in each flat cell, illustrating the optimal configuration. Shown in Fig. 8D, is Eϕ along each flat cell. The two long cells are shown as a solid line. The electric field increases due to the larger cross section in the center, while Type III losses increase at the outer edge. Shown as dashed lines are the field components for the shortened flat cells. The shortened flat cells have Type III loss increases at both the outer and inner edges. By reducing the center cross section, a significant reduction of electric field occurs compared to the AquaStar in Fig. 7D where all four flat cells intersect.
Figure 8.
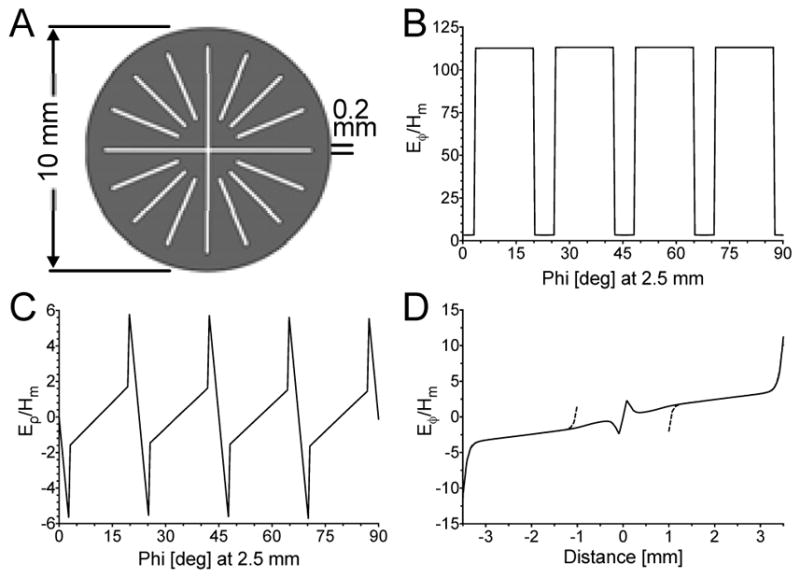
A) The proposed AquaSun sample tube designed for a cylindrical TE011 cavity, where each of the 12 azimuthal flat cells and two crossed flat cells are aligned with the perpendicular electric field in the azimuthal direction. Cylindrical electric field components are plotted: B) Eϕ showing the Type II reduction in each sample cell at a 2.5 mm radius; and C) Eρ showing tangential electric field nulls in each sample cell at 22.5° increments over half the circumference along the center of the flat cells. D) Eϕ along the center of the sample showing the Type III increase towards the end of the azimuthal sample cells (dashed) and through one of the crossed flat cells (solid). A small increase due to circulating electric fields occurs near the center.
The AquaSun geometry illustrates how flat geometries in perpendicular electric field can benefit more than close-packed capillaries, such as the Bruker AquaX. With this geometry, a potential 8.2 fold increase of EPR signal can be obtained over a 1 mm I.D. capillary. Currently, the AquaSun geometry is at the edge of fabrication techniques of PTFE. Other extrusion techniques and materials, such as polyether-ether-ketone (PEEK), are being investigated.
5. Conclusions
By careful observation of the electric field profiles, the design of custom sample holder geometries has led to a reduction in the electric field intensities within a sample, yielding significant EPR signal gains. In general, in order to maximize this effect, one must break up tangential electric field (Type I), minimize edge effects (Type III), and maximize the perpendicular surface to the electric field (Type II).
From this understanding, two new sample geometries with complex cross section for LGRs and cylindrical cavities have been simulated, analyzed, and fabricated. The DoubleDee is a 1 mm capillary with a single septum for a two-loop–one-gap LGR and the AquaStar is a quadruple flat-cell geometry for a five-loop–four-gap LGR and cylindrical TE011 cavity. These new geometries provide increases in EPR signal strength over standard samples in their respective resonators. Design of custom sample holding geometries allow for an increase in sample volume, and therefore, EPR signal intensity for a given Q-value. Further increases are found in the design of a multi-lumen flat cell sample geometry for the cylindrical TE011 cavity, where an EPR signal improvement of a factor of 8.2 over a standard 1 mm sample was simulated.
Several tentative conclusions can be drawn concerning further development of the PTFE extrusion technique. Two extrusions were, in fact, produced for the AquaStar configuration. The first had an exterior configuration that closely paralleled the interior aqueous sample space, while the second design enclosed the aqueous space in a circular tube as shown in Fig. 5D. The second design was substantially more robust. The 3.5 mm outer diameter design yielded the best experimental results. For a cavity, where a diameter of 1 cm would be reasonable, substantial improvement of the AquaStar configuration is possible simply by increase in the diameter of the structure. Refinement of the cross section of the radial spokes is also possible. The good simulation results of the 1 cm diameter AquaSun provides further motivation for continued optimization of the AquaStar.
The concept of a line dipole is known in the field of electricity and magnetism, but not, apparently in EPR sample tube design. It may provide insight into further development of various aqueous sample configurations.
Highlights.
Three new sample holder geometries for aqueous samples are introduced
Perpendicular electric field in loop-gap and cylindrical geometries guide the design
Experimental and simulated EPR signal intensity improvements are presented
Acknowledgments
This work was supported by grants EB001417, EB002052, and EB001980 (National Biomedical EPR Center) from the National Institute of Biomedical Imaging and Bioengineering of the National Institutes of Health. We would also like to thank Dr. Candice Klug for her invaluable discussions and help with establishing good practices in testing and setup.
Footnotes
Publisher's Disclaimer: This is a PDF file of an unedited manuscript that has been accepted for publication. As a service to our customers we are providing this early version of the manuscript. The manuscript will undergo copyediting, typesetting, and review of the resulting proof before it is published in its final form. Please note that during the production process errors may be discovered which could affect the content, and all legal disclaimers that apply to the journal pertain.
References
- 1.Hyde JS. A New Principle for Aqueous Sample Cells for EPR. Rev Sci Instr. 1972;43:629–631. [Google Scholar]
- 2.Eaton SS, Eaton GR. Electron Paramagnetic Resonance Sample Cell for Lossy Samples. Anal Chem. 1977;49(8):1277–1278. [Google Scholar]
- 3.Mett RR, Hyde JS. Aqueous Flat Cells Perpendicular to the Electric Field for Use in Electron Paramagnetic Resonance Spectroscopy. J of Magn Reson. 2003;165(1):137–152. doi: 10.1016/s1090-7807(03)00275-1. [DOI] [PubMed] [Google Scholar]
- 4.Sidabras JW, Mett RR, Hyde JS. Aqueous Flat-Cells Perpendicular to the Electric Field for Use in Electron Paramagnetic Resonance Spectroscopy, II: Design. J Magn Reson. 2005;172(2):333–341. doi: 10.1016/j.jmr.2004.11.006. [DOI] [PubMed] [Google Scholar]
- 5.Hyde JS, Sidabras JW, Mett RR. Resonators for multifrequency epr of spin labels. In: Misra SK, editor. Multifrequency Electron Paramagnetic Resonance: Theory and Applications. Ch. 5.2. Wiley-VCH Verlag GmbH & Co. KGaA; Weinheim, Germany: 2011. pp. 244–269. [Google Scholar]
- 6.Nesmelov YE, Gopinath A, Thomas DD. Aqueous sample in an EPR cavity: Sensitivity Considerations. J Magn Reson. 2004;167(1):138–146. doi: 10.1016/j.jmr.2003.12.005. [DOI] [PMC free article] [PubMed] [Google Scholar]
- 7.Nesmelov YE, Thomas DD. Multibore sample cell increases EPR sensitivity for aqueous samples. J Magn Reson. 2006;178:318–324. doi: 10.1016/j.jmr.2005.10.012. [DOI] [PubMed] [Google Scholar]
- 8.Smythe WR. Static and Dynamic Electricity. 2. McGraw-Hill; New York: 1950. see Secs. 4.03 and 4.21. [Google Scholar]
- 9.Ellison WJ. Permittivity of Pure Water, at Standard Atmospheric Pressure, over the Frequency Range 025THz and the Temperature Range 0100C. J Phys Chem Ref Data. 2007;36(1):1–18. [Google Scholar]
- 10.Von Hippel AR. Dielectric Materials and Applications. Artech House; Boston: 1954. [Google Scholar]
- 11.Oh KJ, Altenbach C, Collier RJ, Hubbell WL. Site-Directed Spin Labeling of Proteins. Methods Mol Biol. 2000;145:147–169. doi: 10.1385/1-59259-052-7:147. [DOI] [PubMed] [Google Scholar]
- 12.Kooser R, Volland W, Freed J. ESR Relaxation Studies on Orbitally Degenerate Free Radicals. I. Benzene Anion and Tropenyl. J Chem Phys. 1969;50:5243–5257. [Google Scholar]
- 13.Hyde JS, Froncisz W. Loop-gap resonators. In: Hoff AJ, editor. Advanced EPR: Applications in Biology and Biochemistry. Elsevier; Amsterdam: 1989. pp. 277–306. [Google Scholar]
- 14.Ginzton EL. Microwave Measurements. McGraw-Hill; New York: 1957. [Google Scholar]


