
Extended Data 7. Registration of cells across three days of imaging.
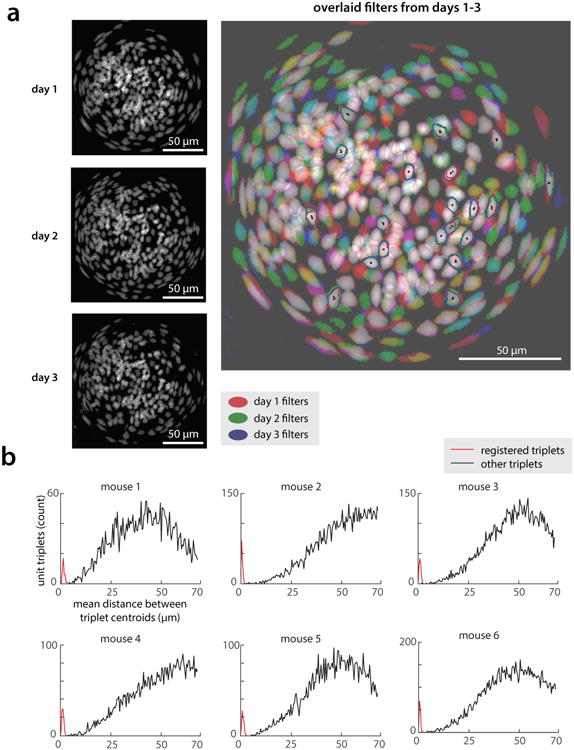
(a) (Left) Maximum projection maps of all spatial filters from each of three days of imaging in an example mouse. (Right) RGB composite image of the three left images (day 1 = red channel, day 2 = green channel, day 3 = blue channel), showing overlap of registered filters (overlap in all three channels appears in white). Outlined are 20 example cells (out of 135) that could be identified in all three days of imaging: red/green/blue lines indicate filter outlines on first/second/third day, respectively; black points mark filter centroids. (b) Histograms of average distance between filter centroids from days 1-3, in cells that could be tracked across days (red) as compared to random triplets of cells (black). Day 1-3 centroids from tracked cells were separated by an average of 2.15±0.06 microns (mean ± s.e.m., n = 593 cells tracked across days in 6 mice, during standard RI assay).