

Abstract
As P-glycoprotein (P-gp) transport on antidepressant delivery has been extensively evaluated using in vitro cellular and in vivo rodent models, an increasing number of publications addressed the effect of P-gp in limiting brain penetration of antidepressants and causing treatment-resistant depression in current clinical therapies. However, contradictory results were observed in different systems. It is of vital importance to understand the potential for drug interactions related to P-gp at the blood-brain barrier (BBB), and whether co-administration of a P-gp inhibitor together with an antidepressant is a good clinical strategy for dosing of patients with treatment-resistant depression. In this review, the complicated construction of the BBB, the transport mechanisms for compounds that cross the BBB, and the basic characteristics of antidepressants are illustrated. Further, the reliability of different systems related to antidepressant brain delivery, including in vitro bidirectional transport cell lines, in vivo Mdr1 knock-out mice, and chemical inhibition studies in rodents are analyzed, supporting a low possibility that P-gp affects currently marketed antidepressants when these results are extrapolated to human BBB. These findings can also be applied to other central nervous system drugs.
1. Background
Depression is currently the fourth most serious global health problem, especially in the developed world [1]. Most antidepressants used in the clinic are small, lipophilic molecules that can readily cross endothelial cells via passive diffusion [2]. For a long time, passive diffusion has been viewed as a major mechanism for good penetration at the BBB of antidepressants. In the last 20 years, with the availability of the P-gp knockout mouse model, numerous studies have been conducted in P-gp knockout versus wild type mice and significant P-gp efflux of antidepressants has been observed, followed by an increasing number of publications that address the important role of P-gp expressed at the brain capillary endothelial cells on the efflux of most antidepressants at the BBB [3]. Thus, efflux of antidepressants by brain P-gp has been regarded as one important factor that potentially results in treatment-resistant depression [4]. A series of studies in rodents with chemical inhibition of P-gp were conducted based on the observation in the knockout model. However, contradictory results have been observed for in vitro bidirectional transport studies using P-gp overexpressing cell lines (MDCK-MDR1) for most antidepressants that have previously been reported to exhibit marked P-gp efflux at the BBB [5]. In addition, association studies of ABCB1 genetic variants and clinical response to antidepressants have shown equivocal results [6].
P-gp is expressed in the intestine, liver, and brain, and plays a vital role in drug absorption, distribution and excretion. Whether P-gp can affect the delivery of marketed antidepressants into the brain is of great importance. However, the present ambiguous observations about the effect of P-gp on antidepressant penetration into the brain may mislead clinical research and drug discovery. To understand the potential for drug interactions related to P-gp at the BBB, and whether co-administration of a P-gp inhibitor with an antidepressant is a good strategy for patients with treatment-resistant depression, it is important to consider the factors that influence the brain penetration and the reliability of the P-gp effect in vitro as well as in vivo. In addition, it is necessary to make a rational extrapolation of P-gp effects on antidepressants from preclinical studies to clinical treatment.
Further investigations are needed to clarify the P-gp effect on antidepressant brain penetration. Over the past 20 years, our laboratory performed a series of cellular, animal and human studies and predicted transporter effects, transporter-enzyme interplay and potential drug-drug interaction in the intestine, liver, and recently, the brain using the biopharmaceutics drug distribution classification system (BDDCS). In this review, we conducted an extensive literature search and reanalyzed the available in vitro and in vivo data related to P-gp effects and brain penetration of antidepressants to characterize the P-gp effect on the delivery of antidepressants into brain, as well as its relevance for treatment-resistant depression.
2. Antidepressants
2.1 Depression
Major Depressive Disorder (MDD) is a psychiatric disease characterized by depressed mood accompanied by feelings of irritability, low self esteem, hopelessness, worthlessness, and guilt. Other symptoms of MDD include decreased ability to concentrate, changes in appetite, weight or sleep patterns, low energy, increased fatigue, and diminished interest or pleasure in normally enjoyable activities. A diagnosis of MDD will be made if a patient exhibits five or more symptoms listed above for at least 14 days [7].
Depression is the most prevalent of mental disorders, causing retraction from social life and premature death [8]. Currently, diagnoses of depression are increasing and it is proposed that depression will be counted among the top 3 most important world health problems by 2020 [9]. Depression affects patients’ quality of life and work, and leads to higher rates of many other chronic diseases.
Increased pharmaceutical investments and health care costs are related to depression treatment. Antidepressants are a class of medications used to treat depression or prevent it from occurring. According to the FDA website, almost 30 antidepressants are currently available on the market. They work to normalize levels of a group of chemicals in the brain known as neurotransmitters. Certain neurotransmitters, such as serotonin, norepinephrine and dopamine have been found to be involved in improving mood and emotion (www.fda.gov/consumer). Based on the effects of antidepressants on different neurotransmitters, these drugs are grouped into several different classes: monoamine oxidase inhibitors (MAOIs), tricyclic antidepressants (TCAs), serotonin and norepinephrine reuptake inhibitors (SNRIs), and selective serotonin reuptake inhibitors (SSRIs) [10].
2.2 Treatment-resistant depression
As might be expected, since numerous antidepressants are available, only about 60 to 70 percent of patients respond to their first prescribed antidepressant (www.fda.gov/consumer). The remaining 30–40 percent of patients do not achieve satisfactory sustained improvement with reasonable doses for sufficient duration. Moreover, 10 percent of patients will not achieve a clinically adequate response to any prescribed antidepressant, which is defined as treatment-resistant depression [11]. Though the mechanisms of action of antidepressants have not been adequately understood, there are multiple therapeutic strategies for treatment-resistant depression, such as administration of high dose antidepressants, combination of antidepressants with augmenting agents or other antidepressants, psychotherapy, electroconvulsive therapy, vagus nerve stimulation, repetitive transcranial magnetic stimulation and psychosurgery with deep brain stimulation [12, 13].
From a pharmacokinetic perspective, the inability to reach therapeutic concentrations may contribute to treatment-resistant depression. For example, maprotiline 75 mg was shown to be more effective than 37.5 mg during a 1 year study [14], and plasma levels of nortriptyline between 80–120 ng/ml was more effective than 40–60 ng/ml over 3 years [15]. Potential explanations for lower concentrations in plasma and the brain include high expression levels of metabolic enzymes in patients, concurrent dosing of metabolic inducers [11] and P-gp expression at the BBB [16].
2.3 Pharmacokinetics of antidepressants
Though the various antidepressants exhibit different mechanisms of action, they share similar pharmacokinetic properties. After oral administration, all the antidepressants are well absorbed in the gut, although they differ in the extent of intestinal and hepatic first pass metabolism, leading to different amounts of unchanged drug reaching the systemic circulation, i.e. different bioavailability. Antidepressants are extensively metabolized in the liver by the cytochrome P450 (CYP) enzymes and mainly excreted as metabolites in the urine, with only a small portion of the dose excreted as unchanged drug. Most antidepressants have relatively long half lives, with remarkably different values for each drug. The half-lives of venlafaxine, paroxetine, citalopram are 5, 21, and 36 hours, respectively. Fluoxetine has a half-life that ranges between 1 and 4 days and is eliminated much slower compared to other antidepressants [17].
Several pharmacokinetic factors contribute to the high inter-subject variability of antidepressant plasma concentrations. Numerous studies show that all the antidepressants are CYP substrates, mostly mediated by CYP3A4, CYP2C19, and CYP2D6, which can exhibit genetic polymorphisms, thus yielding variable individual concentrations [18]. In addition, it is difficult to define a clear threshold for a therapeutic window within which therapeutically effective concentrations can be defined. The range of concentrations yielding an effective response may vary by 10–20 fold in different patients [19].
Although only few of the antidepressants are inhibitors of CYP isoforms at therapeutic concentrations, potential drug-drug interactions must be considered when inhibitors and inducers of CYPs are dosed concomitantly.
3. Blood-Brain Barrier (BBB)
3.1 Introduction
The blood-brain barrier is an interface that protects the central nervous system from potentially harmful chemicals and maintains a stable environment by preventing permeation of most molecules from the circulating blood into brain. This physical barrier is formed by brain capillary endothelial cells, together with perivascular elements that surround the endothelial cell layer, as well as tight junctions between the cerebral endothelial cells.
Cerebral endothelial cells that line the brain capillary system are different from the endothelial cells in the periphery of the body. They do not have fenestrations and exhibit more mitochondria, sparse pinocytic vesicular transport and more extensive tight junctions between overlapping cells [20], all of which can efficiently impede compounds from permeating through endothelial cells and entering into brain. Endothelial cells, combined with perivascular elements, are defined as a neurovascular unit and mainly consist of astrocyte end feet, pericytes and neurons. It was reported that these 3 elements are responsible for the induction and maintenance of BBB properties, such as the formation of tight junctions, organization of endothelial cells into capillary-like structures, and the polarized expression of transporters in the endothelial membranes [21]. Neurons are also associated with active vascular recruitment and subsequent remodeling [20].
Tight junctions are dynamic structures that act as a gatekeeper by selectively restricting paracellular diffusion of molecules into the brain. Tight junctions consist of three transmembrane proteins, namely claudin, occudin and junction adhesion molecules, as well as membrane-associated cytoplasmic proteins such as ZO-1, ZO-2, ZO-3, cingulin and others [22].
The BBB is unique not only because of the existence of this physical barrier, but also because of the expression of a polarized efflux transport system and enzymatic degradation in endothelial cells.
3.2 Transport mechanism of molecules across the BBB
Due to the impermeability of the central nervous system, it is a challenge for most molecules to gain access into the brain, although a number of molecules do transfer from the blood to brain. Several mechanisms are potentially involved in this process.
First, simple passive diffusion, which comprises both transcellular and paracellular diffusion, is driven by a concentration gradient that moves molecules from higher concentrations to lower concentrations until equilibrium is reached. Generally, transcellular permeability is limited to small molecules that have a molecule weight < 500 Da and have a combination of attributes of sufficient hydrophilicity, so that the molecule can be dissolved in water, and sufficient lipophilicity, to be soluble in the hydrophobic core of the lipid bilayer [23]. Gases such as O2 and CO2 can also diffuse through membranes in this manner. Paracellular diffusion, expected to play a predominant role in the permeability of hydrophilic molecules, seldom occurs due to the tight junctions in the BBB.
Second is endocytosis, which is an energy dependent process that could apply to larger molecules, including some large proteins (e.g. insulin, albumin and ceruloplasmin). Cells absorb molecules by engulfing them via a variety of mechanisms, such as receptor-mediated endocytosis and adsorptive-mediated endocytosis [26].
Third is carrier-mediated transport, which is an approach that is associated with the movement of molecules across the cell membrane via specific membrane proteins. Based on their inward or outward transport characteristics, they are classified as carrier-mediated influx or carrier-mediated efflux, respectively. Carrier-mediated influx is a common route for the transport of small endogenous molecules (i.e. amino acids, nucleosides and glucose) into the CNS [28]. Drugs can also be delivered into the brain by endogenous transporters expressed at the luminal and abluminal membranes of the endothelial cells such as OATP1A2, OATP2B1 and OCT3 [26]. Carrier-mediated efflux can preferentially transport molecules that are lipid soluble and amphiphilic out of endothelial cells against a concentration gradient by ATP hydrolysis, utilizing transporters such as P-glycoprotein (ABCB1) and breast cancer resistance protein (BCRP, ABCG2).
There are also ion channels expressed on the brain endothelial membranes that allow the passage of water, Na+, K+ and Cl− [23]. It is obvious that the BBB allows the passage of water, some gases and essential nutrients by passive or active influx to maintain neural function. The BBB can also selectively prevent the entry of xenobiotics that may be neural toxins by active efflux via P-gp and BCRP. In this way, the BBB can provide protection for the central nervous system and maintain stable brain function.
3.3 Coexistence of passive and carrier-mediated transport at the BBB
For a long time, it has been believed that lipophilicity and molecular weight were determinants for a drug to cross the BBB. In 1980, Levin showed a good correlation between the ability of a drug to partition into the lipid bilayer portion of the cell monolayer and penetration of the drug across the BBB [31]. However, exceptions have been found in further research. For example, molecules that do not have the commensurate lipophilicity, such as D-glucose and L-amino acids, can also enter endothelial cells [32]. In contrast, some molecules that have high lipid solubility, such as cyclosporine, do not show high permeation into the brain [33].
As various transporter systems have been identified and the transcellular routes of various CNS drugs have been explored, it has been recognized that the majority of drugs that do not exhibit the correlation with lipophilicity are substrates of transporters. Influx transporters expressed at the membranes of brain capillary endothelial cells can explain the high permeability of polar molecules across the BBB. And the efflux transporters, especially P-gp, can explain why highly lipophilic drugs have apparently poor BBB permeability. Thus, active transport can play a predominant role in affecting the delivery of drugs into the brain, and as such, the contribution of both passive diffusion and active transport must be considered when evaluating the permeation of CNS drugs across the BBB.
3.4 Parameters to evaluate brain penetration
Brain penetration can be evaluated by two parameters: the rate of brain uptake and the extent of brain exposure at steady state [34].
The rate of brain uptake is determined by BBB permeability and is a direct measure of a compound’s ability to penetrate into brain and is not influenced by metabolism, plasma protein binding or non-specific brain binding [35,36]. Several in silico, in vitro, and in situ methods have been used for the prediction of BBB permeability. In vitro methods include cell based systems such as MDCK-MDR1 and brain endothelial cells, as well as non cell based high throughput PAMPA-BBB methods. In situ brain perfusion is the most common assay utilized to determine BBB permeability.
The extent of brain exposure is defined as the ratio of brain concentration to plasma concentration at equilibrium (equation 1). Since most antidepressants are administered chronically, the extent of exposure may be more critical than the rate of penetration. The total brain to plasma concentration ratio, Kp,brain, was historically the most commonly used in vivo parameter. It is assumed that compounds with high Kp,brain values have more brain penetration compared to compounds with low Kp,brain values. But this parameter often shows a poor correlation with pharmacodynamic response. It is argued that the Kp,brain, values are affected by the extent of plasma protein and brain tissue binding [37,38].
| (1) |
where fu is a measure of fraction unbound in plasma or brain and Cu is unbound concentration. From the equations above, we can see that a high Kp,brain can be caused by low plasma binding, high non specific brain tissue binding or high unbound brain to plasma ratio, and may not necessarily yield high penetration of unbound drug into the brain. Conversely, low Kp,brain compounds may have high unbound drug brain exposure.
According to the free drug hypothesis, unbound brain concentrations are the driving force for receptor binding and membrane permeation [34, 39]. It is only the unbound brain concentrations that can interact with CNS receptors and targets. Therefore, the unbound brain to plasma concentration ratio at steady state, which is defined as Kp,uu,brain, is used today as the pharmacological entity that quantifies the extent of brain exposure. Values of Kp,uu,brain significantly lower than 1 indicate CNS restriction by active efflux. In contrast, a value greater than 1 is consistent with enhanced CNS distribution [38]. However, there are relatively few publications that define the appropriate cut-off for expected CNS activity following clinically relevant doses. In 2007 Kalvass et al. [38] proposed a cut-off of 0.33, with Kp,uu, brain values less than 0.33 indicating poor brain exposure, and reiterated this choice more recently [40].
The measurement of Kp,uu,brain in rodent species can be achieved by several different methods. Microdialysis in vivo is the only method that can measure the concentrations of unbound drug in brain interstitial fluid (Cu,brain ISF) directly with continuous sampling to provide concentration–time profiles of drug in the brain. However, this method is limited by the technical difficulties, requiring special equipment and expertise [41,42]. Another method is based on Kp,brain, where intravenous infusion, subcutaneous or intraperitoneal administration of drug into animals is often combined with blood and tissue sampling to first measure Kp,brain. Then, equilibrium dialysis of brain homogenate [43] or brain slice uptake studies [44] are conducted to measure brain unbound fractions. Unbound concentrations in brain and plasma were estimated by multiplying the total concentration by the unbound fraction ratios in the brain and plasma, respectively. However, neither of these two methods can apply to clinical human brain penetration evaluation.
In clinical studies, cerebrospinal fluid (CSF) concentrations have been widely used as a surrogate for brain interstitial fluid concentrations (ISF). The concept that the CSF and ISF are functionally equivalent may be found in neuroscience text books [45] and has been perpetuated for many years. However, brain anatomy and physiology, as well as brain-penetrating basic vital dye studies, indicate that drug entry into the CSF across the choroid plexus is an entirely separate process from drug transport across the BBB [46,47]. Cerebrospinal fluid is a fluid compartment in rapid equilibrium with the blood. The way that molecules can distribute from the CSF compartment into brain parenchyma and the ISF is through ependymal surface diffusion. However, the diffusion rate is much slower compared to the rapid rate of bulk flow (convection) into blood. Limited by slow diffusion, the transport of drug from the CSF to brain tissue is slow. Since there is no general relationship between CSF and ISF concentrations, the use of CSF instead of ISF concentrations to evaluate BBB penetration has been questioned [48,49].
3.5 BDDCS prediction of P-gp effect in the brain
In 2005, Wu and Benet proposed the Biopharmaceutics Drug Disposition Classification System (BDDCS) [51]. Drugs were classified into four categories based on their extent of metabolism and solubility: Class I (high solubility, extensive metabolism, high membrane permeability rate), Class II (low solubility, extensive metabolism, high membrane permeability rate), Class III (high solubility, poor metabolism, low membrane permeability rate), and Class IV (low solubility, poor metabolism, low membrane permeability rate). BDDCS provides a useful tool in early drug discovery for predicting oral drug disposition, food effects on drug absorption, transporter effects on drug absorption, routes of elimination, and potentially clinically significant drug interactions that may arise in the intestine, liver and brain [52–54].
After oral administration, drugs go through a series of complicated pharmacokinetic processes before unbound concentrations yield effects at the target site. For CNS drugs many other factors (aside from the BBB and P-gp) can affect drug delivery to the site of action and limit brain concentrations, namely uptake and efflux transporters in the intestine and liver and their interplay with metabolizing enzymes. Benet and colleagues have successfully predicted and observed transporter effects and related transporter-enzyme interplay in the intestine and liver based on BDDCS classification [51–53]. Recently, we predicted the brain disposition for orally administered drugs using BDDCS and gained an accuracy of more than 90%. In our predictions, we combined molecular properties with biological factors, taking into account passive permeability rate and the active transporter P-gp [54]. Here, we apply BDDCS to the prediction of brain disposition for orally administered antidepressant drugs.
3.5.1 Class 1 compounds
For class 1 compounds, which are highly soluble-highly permeable-extensively metabolized, the passive permeability at concentrations unrestricted by solubility appears to overwhelm any potential transporter effects [51,55]. In this situation, class 1 compounds may be substrates of transporters in cellular systems, but transporter effects will be clinically insignificant in the gut, liver or brain. For example, verapamil is shown to be a substrate of P-gp in the MDCK-MDR1 cellular system, but it exhibits no clinically significant P-gp transporter effects in the intestine, liver, and brain (human Kp,uu,brain=0.55) [56].
In 2012, Broccatelli et al. investigated the brain penetration of orally administered drugs [54]. They identified 153 marketed drugs that met three criteria: 1) the effect of the drug in the brain was known and generally agreed upon, 2) the BDDCS class was known, and 3) published studies exist for the drugs, characterizing in vitro their status as P-gp substrates. Of the 153 drugs, 82 were BDDCS Class 1 drugs, of which 63 exhibited good brain penetration and were not P-gp substrates. The remaining 19 show significant P-gp efflux as determined in vitro in MDCK-MDR1 cells, yet 18 of the 19 were known as BBB+ drugs from clinical data. Broccatelli et al. [54] used a lower cut-off, i.e. Kp,uu,brain ≥0.10, than Kalvass and colleagues [38,40]. Broccatelli and coworkers were influenced by the previous work of Li et al.[57], and others referenced by Li et al., who had utilized a Kp,brain lower cut-off of ≥0.10. However, there appears to be no published testing of the appropriate cut-off for a large group of similarly acting drugs, as we are testing here for antidepressants. As noted subsequently, relatively few antidepressants exhibit Kp,uu,brain levels between 0.10 and 0.33. The one outlier in the 19 P-gp substrates mentioned above, colchicine had been classified by Benet et al. [58] as a BDDCS Class 1 drug, but we now believe that colchicine is predominantly eliminated in humans as unchanged drug in the bile, and should be more properly listed as BDDCS Class 3.
Most of the current antidepressant drugs are BDDCS class 1 drugs and are extensively metabolized in liver and intestine. Based on BDDCS predictions, even though they are P-gp substrates, there should be minimal transporter effects in gut and liver and they should show good penetration in brain (BBB+). In Broccatelli’s study, 19 BDDCS Class 1 antidepressants were studied, of which 16 are not P-gp substrates and 3 are P-gp substrates. Of course, all the 19 antidepressants are BBB+, which correlates well with the BDDCS brain penetration prediction. Recently, Poirier et al. investigated the permeability rates and efflux ratios of 76 CNS drugs in LLC-PK1 cells overexpressing P-gp. Of the 76 drugs, 65 exhibited efflux ratios lower than 2, while the remaining 11 drugs had efflux ratios higher than 2 and were thus considered to be P-gp substrates, yet all of these 11 P-gp substrates had good brain penetration. Among these 11 drugs, 8 are categorized as BDDCS class 1, yielding a good fit with our prediction that BDDCS class 1 drugs are not affected by P-gp efflux clinically, even if they are P-gp substrates using in vitro cell systems [59].
Nonetheless, consideration should be taken when antidepressant drugs are dosed together with enzyme inhibitors or inducers, which can markedly change drug exposure.
3.5.2 Class 2 compounds
For class 2 compounds, the high permeability rate will grant drug molecules rapid access into the gut membrane and enterocytes by passive diffusion, making intestinal uptake transporter unimportant. However, due to the low solubility of class 2 compounds, the low concentrations of drug entering enterocytes do not overwhelm (or saturate) the efflux transporters, as is observed for class 1 compounds, making efflux transporter effects potentially important in the gut. Class 2 drugs have also been observed to be affected by both uptake and efflux transporters in the liver [60]. Thus, transporter-enzyme interplay will be of great importance for highly metabolized BDDCS class 2 drugs that are substrates for drug metabolizing enzymes and transporters in the gut and liver.
In the gut, drug is absorbed by passive processes into enterocytes, where it may be metabolized by drug metabolizing enzymes. However, apical efflux transporters, such as P-gp, can pump drug back into the intestinal lumen where it may then re-enter enterocytes, thereby allowing repeated access to the enzymes in the enterocytes, preventing the intact drug molecule from entering the hepatic portal blood. The intestinal metabolism of a drug could be changed as a function of P-gp activity, without neither inhibiting nor inducing intestinal enzymes. In this way, enzymes and transporters work in a coordinated manner to prevent xenobiotics from reaching the systemic circulation.
Compared to efflux-transporter interplay in the intestine, where drug molecules enter the organ on the apical side and access the efflux transporter prior to the enzyme, the efflux transporter-enzyme interaction in the liver is reversed, since drug molecules enter the liver on the basolateral side, encountering the enzyme prior to being effluxed by P-gp into bile. In this situation, some substrates that permeate into hepatocytes will be metabolized, and more parent substrates will be pumped out by P-gp or other efflux transporters to the bile duct without diffusing back into hepatocytes because it is against a concentration gradient. Therefore, inhibition of hepatic drug efflux can increase the extent of hepatic metabolism of a class 2 drug due to the increased access of the drug to the metabolizing enzymes. In contrast, inhibition of intestinal drug efflux can lead to decreased intestinal metabolism of the concomitant drug due to decreased access of the drug to the enzymes [62].
In the study of Broccatelli et al. [54], 40 drugs are categorized as Class 2 drugs. Among these 40 drugs, 14 are P-gp substrates as determined by in vitro bidirectional MDCK-MDR1 cell line studies, of which 11 are BBB− drugs that do not penetrate the brain. The remaining 3 drugs are BBB+ drugs that can readily access the brain, which means that for Class 2 drugs, 78.6% of P-gp substrates are BBB−. Of the remaining 26 drugs that are not P-gp substrates, 4 drugs are BBB− and 22 are BBB+. It is obvious that the P-gp efflux transporter in brain can have an effect on the drug disposition of class 2 drugs and should be avoided for CNS drugs. Further examination of the outlier drugs of Broccatelli et al. [54] and Poirier et al. [59] in terms of Kp,uu,brain measurements may be a useful study.
Three antidepressants were categorized as BDDCS class 2 in the study of Broccatelli et al. [54] as shown in Table 1. For antidepressants that are BDDCS class 2 compounds, efflux transporters in the gut, liver and brain may limit the delivery to the brain and should be considered. Influx transporters may facilitate the penetration of antidepressants into brain. Consideration should also be given when these drugs are co-administered with enzyme inhibitors and inducers, since class 2 drugs are highly metabolized. Transporter-enzyme interplay is important and coadministration of a P-gp and/or enzyme inhibitor can greatly change the systemic exposure of drugs, and thereby yield central effects for drugs with low Kp,uu,brain that do not exhibit central effects under normal dosing conditions.
Table 1.
In silico property analyses for antidepressants
| Drug | BDDCS Class |
Nitrogen Count |
Oxygen Count |
Norinder- Haeberlein [66] |
CLogP | HBA Count |
HBD Count |
MW | Lipinski BBB [68] |
Calculated Kp,uu,b |
PLS Model [50] |
Caco2 (VolSurf+) [69] |
Broccatelli et al. [54] |
Actual BBB [54] |
|---|---|---|---|---|---|---|---|---|---|---|---|---|---|---|
|
| ||||||||||||||
| Amitriptyline | 1 | 1 | 0 | + | 4.85 | 1 | 0 | 278.41 | + | 0.66 | + | 1.40 | + | + |
| Amoxapine | 1 | 3 | 1 | + | 3.41 | 3 | 1 | 314.79 | + | 0.35 | + | 0.98 | + | + |
| Bupropion | 1 | 1 | 1 | + | 3.21 | 2 | 1 | 240.75 | + | 0.48 | + | 1.03 | + | + |
| Citalopram | 2 | 2 | 1 | + | 3.13 | 3 | 0 | 325.40 | + | 0.35 | + | 0.90 | + | + |
| Clomipramine | 1 | 2 | 0 | + | 5.92 | 2 | 0 | 315.86 | − | 0.48 | + | 1.41 | + | + |
| Desipramine | 1 | 2 | 0 | + | 4.47 | 2 | 1 | 267.39 | + | 0.48 | + | 1.12 | + | + |
| Doxepin | 1 | 1 | 1 | + | 4.09 | 2 | 0 | 280.38 | + | 0.48 | + | 1.25 | + | + |
| Duloxetine | 1 | 1 | 1 | + | 4.26 | 2 | 1 | 298.42 | + | 0.48 | + | 1.13 | + | + |
| Escitalopram | 1 | 2 | 1 | + | 3.13 | 3 | 0 | 325.40 | + | 0.35 | + | 0.93 | + | + |
| Fluoxetine | 1 | 1 | 1 | + | 4.57 | 2 | 1 | 310.33 | + | 0.48 | + | 0.76 | + | + |
| Fluvoxamine | 1 | 2 | 2 | + | 3.32 | 4 | 1 | 319.34 | + | 0.25 | + | −0.07 | + | + |
| Imipramine | 1 | 2 | 0 | + | 5.04 | 2 | 0 | 281.42 | − | 0.48 | + | 1.36 | + | + |
| Maprotiline | 1 | 1 | 0 | + | 4.52 | 1 | 1 | 278.41 | + | 0.66 | + | 1.24 | + | + |
| Mirtazapine | 1 | 3 | 0 | + | 2.81 | 3 | 0 | 266.36 | + | 0.35 | + | 1.21 | + | + |
| Nortriptyline | 1 | 1 | 0 | + | 4.32 | 1 | 1 | 264.39 | + | 0.66 | + | 1.19 | + | + |
| Paroxetine | 1 | 1 | 3 | + | 4.24 | 4 | 1 | 330.37 | + | 0.25 | + | 0.58 | + | + |
| Quetiapine | 1 | 3 | 2 | + | 2.99 | 5 | 1 | 383.51 | + | 0.18 | + | 0.85 | + | + |
| Selegiline | 1 | 1 | 0 | + | 3.02 | 1 | 0 | 188.29 | + | 0.66 | + | 1.44 | + | + |
| Sertraline | 1 | 1 | 0 | + | 5.35 | 1 | 1 | 307.24 | − | 0.66 | + | 1.25 | + | + |
| Trazodone | 2 | 5 | 1 | − | 3.85 | 4 | 0 | 371.86 | + | 0.25 | + | 1.21 | + | + |
| Trimipramine | 2 | 2 | 0 | + | 5.44 | 2 | 0 | 295.44 | − | 0.48 | + | 1.42 | + | + |
| Venlafaxine | 1 | 1 | 2 | + | 3.27 | 3 | 1 | 278.41 | + | 0.35 | + | 0.91 | + | + |
3.5.3 Class 3 and Class 4 compounds
For Class 3 and Class 4 compounds, which are poorly permeable drugs, uptake transporters are important for intestinal absorption, hepatocyte uptake, and brain penetration. Once these drugs enter the enterocytes, hepatocytes or brain endothelial cells, efflux transporter effects can also occur. That is, since the influx of class 3 and Class 4 compounds will generally be rate limited by an uptake transporter, the counter effects of efflux transporters will not be saturated and can also be important. Our further analysis of Broccatelli’s dataset shows that 73% of the P-gp substrates in BDDCS classes 3 and 4 are BBB− (11 of the 15 P-gp substrates are BBB−). Since Class 3 and Class 4 compounds are poorly metabolized, metabolic interactions are not important. Uptake transporter, efflux transporter, and uptake–efflux transporter interplay are of major importance.
Currently there are few if any antidepressant drugs that are class 3 or class 4 due to their low permeability rate and low penetration into brain. Targeting relevant brain and intestinal uptake transporters and avoiding efflux transporters in the brain and gut should be considered for Class 3 and Class 4 CNS drugs.
In Figure 1, we briefly summarize how transporters and enzymes affect antidepressant drugs. This can also be applied to other CNS drugs.
Fig. 1.
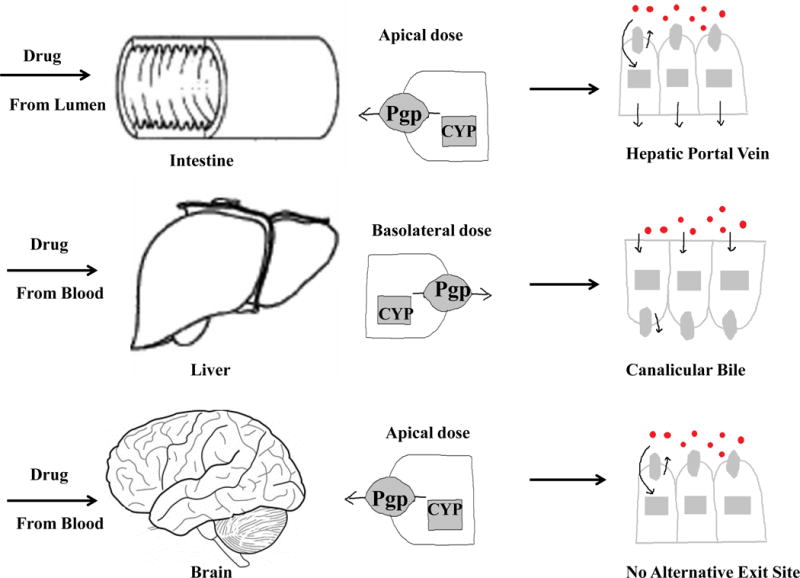
The potential transporter-enzyme interplay in the intestinal, liver and brain
4. Reliability of methods to evaluate brain penetration of antidepressants
4.1 In silico models
The increasing need for high throughput drug discovery enhances the popularity of in silico models of BBB permeation. Numerous in silico models have been developed and validated, in which molecular structure and brain exposure relationships have been investigated.
Historically, CNS penetration assessment in most in silico models were derived from Log Kp,brain [64–66], or Log permeability-surface area coefficient (Log PS) data sets [67]. Log Kp,brain reflects the total drug concentration in the brain, which is highly influenced by brain and plasma protein binding and may be unrelated to BBB transport and unbound brain exposure. Log PS was developed to evaluate the permeability of a drug across the brain capillary endothelium in terms of unbound concentration. However, it is a BBB transport rate parameter, which is of little pharmacological consequence for the long-term administration of antidepressants. More recently, a structure-brain exposure relationships in silico model was developed in terms of Kp,uu,brain, which was reported to be a more promising parameter related to brain penetration[50].
In Table 1, the predicted brain penetration of antidepressants was evaluated based on several in silico models. The actual brain penetration of antidepressants was listed based on our previous work [54]. All the antidepressants in Table 1 are actual BBB+ drugs. Molecular descriptors, including calculated LogP (CLogP), molecular weight (MW), hydrogen bond acceptor counts (HBA), hydrogen bond donor count (HBD), and counts of oxygen and nitrogen, are used to predict brain penetration through in silico models.
According to rules recommended by Norinder-Haeberlein [65] and Lipinski’s BBB rules of thumb [68], which are derived from Log Kp,brain, 95% and 82% of the 22 antidepressants, respectively, listed in Table 1 are predicted to have good penetration.
Calculated Kp,uu,brain based on projections to latent structures (PLS) model [50] was also used to assess brain penetration. All 22 antidepressants exhibit Kp,uu,brain values ≥ 0.1, with four, fluvoxamine, paroxetine, quetiapine and trazodone, falling below 0.33. Results showed that all antidepressants listed are predicted to readily cross endothelial cells and have good BBB penetration in the PLS model. Thus, at least for antidepressants, it appears that the proposed cut-off for Kp,uu,brain of 0.1 by Broccatelli et al. [54] is more appropriate.
In 2012, Broccatelli et al. integrated BDDCS classification with in vitro P-gp efflux and in silico permeability data and created a decision tree to predict drug brain penetration [54]. The VolSurf+ descriptor CACO2, which was generated from Caco-2 cell permeation studies, was used as a surrogate for in vitro passive permeability [69]. Based on Broccatelli’s decision tree, all the listed antidepressants are predicted to be BBB+.
In silico models offer the promise of rapid, relatively inexpensive characterizations. However, the disadvantage of in silico model predictions of brain penetration is that the experimental brain penetration values, such as Log Kp,brain or Kp,uu,brain are measured using different experimental procedures, many using different animals vs. man. The variations between different experiments can affect the accuracy of experimental data on which these models were established [70]. In addition, being derived only from molecular structural information, most in silico models do not take into account the biological factors that are responsible for brain penetration.
4.2 The parallel artificial membrane permeation assay (PAMPA)
The PAMPA system is a parallel artificial membrane devoid of carrier-mediated and paracellular processes and is used as a high-throughput in vitro model to assess membrane passive permeation. It was first introduced by Kansy et al. [71] and has been widely used in the pharmaceutical industry to predict intestinal absorption. In 2003, Di et al. developed a modified PAMPA assay to predict BBB penetration (PAMPA-BBB) [72]. The main difference between the PAMPA and PAMPA-BBB models is the lipid membrane. Compared to the membranes of PAMPA, which consists of 2% (w/v) dioleoylphosphatidylcholine dissolved in dodecane, the membranes used in the PAMPA-BBB model contain a more complicated porcine brain extract, so as to better mimic the blood-brain barrier. Mensch et al. confirmed that both the PAMPA-BBB model and the PAMPA model accurately identified compounds that pass the BBB (BBB+) and those that poorly penetrate the BBB (BBB−) [73].
According to historical PAMPA data at Pfizer, compounds with PAMPA Papp >5×10⁻⁶ cm/s exhibited good permeability across Caco-2 and MDCK biological cell membranes [74]. Di et al. based their criteria on PAMPA-BBB values and previously reported BBB permeation ranges. PAMPA-BBB Papp above 4×10⁻⁶ cm/s was predicted to yield high BBB permeation, Papp under 2×10⁻⁶ cm/s was predicted to yield low BBB permeation, and the permeation of compounds with a Papp value between 2×10⁻⁶ and 4×10⁻⁶ cm/s was uncertain [72].
In Table 2, the PAMPA permeability rates of antidepressants are listed [34,72,74,75]. In this data set, only sertraline, with a PAMPA-BBB Papp of 2.8×10⁻⁶ cm/s, is lower than the high permeability cutoff set by historical Pfizer data (5×10⁻⁶ cm/s)[74], or Di and coworkers (4×10⁻⁶ cm/s) [72]. Contradictory PAMPA Papp values have been reported for fluoxetine. We followed Di’s PAMPA-BBB data for fluoxetine and treated it as a high passive permeability compound. From this dataset, all antidepressants, except sertraline, exhibit high passive permeability in vitro and are predicted to have good brain penetration.
Table 2.
BDDCS prediction of potential transporter and enzyme effects of CNS drugs following oral dosing
| Class 1 | Class 2 |
|---|---|
| Transporter effects minimal and clinically insignificant in the intestine, liver and brain. | Uptake transporters in liver and brain may enhance penetration; Efflux transporters in gut, liver and brain may decrease drug access. |
| Metabolic interactions in the intestine and liver should be considered. | Transporter-enzyme interactions in the intestine, liver and brain should be considered. |
|
| |
| Class 3 | Class 4 |
| Uptake and efflux transporters in the brain may affect BBB penetration of theses drugs. | Uptake and efflux transporters in the brain may affect BBB penetration of these drugs. |
| Metabolic interactions are not important. | Metabolic interactions are not important. |
The PAMPA membrane is a physicochemical barrier, which can only predict drug passive diffusion into brain endothelial cells. However, antidepressants may also be affected by active influx or efflux transport or by drug metabolism, which could change the permeability rate in vivo. For example, a drug can have a high PAMPA permeability, but being a substrate of an efflux transporter can lead to poor penetration into brain. Conversely, a low PAMPA permeability could underestimate the permeation of a drug, which is a substrate of an influx transporter into brain. To some extent, it may be unwise to judge brain penetration only by PAMPA classification, particularly for BDDCS class 2 drugs. More information regarding drug transport and metabolism is needed. An evaluation of PAMPA-BBB permeability of BDDCS class 2 drugs that do not exhibit central effects could be illuminating.
4.3 In vitro transport studies in MDCK-MDR1 cell line
MDCK-MDR1 cells are widely used to study P-gp efflux by conducting a bidirectional transport assay and evaluating the efflux ratio. Since only the compound crossing the cell monolayer is measured, transport is less influenced by nonspecific binding compared to membrane based P-gp assays such as the ATPase assay. The MDCK-MDR1 cell system can also be used to predict passive BBB permeability. At high transepithelial electrical resistance (TEER), low paracellular permeability of the system would be expected to be able to accurately predict compounds with poor transcellular permeability.
In Table 3, we list in vitro transport data for 23 antidepressants in cell systems over-expressing P-gp, of which 20 are BDDCS class 1, and 3 are class 2. For 18 of these antidepressants more than one efflux ratio has been reported [74,76–82]. Our laboratory carried out an extensive literature search of 153 orally administered drugs and analyzed their efflux ratio values in MDCK-MDR1 cell lines [54]. We observed that 77% of the efflux ratios were determined in MDCK-MDR1 cell lines derived from the Netherlands Cancer Institute (Borst cell line), while 23% were determined in MDCK-MDR1 cell lines originating from the National Institute of Health (NIH cell line). Based on data from drugs studied in both cell lines, there was a 4.26 fold higher ratio for NIH cell line studies compared to Borst cell line studies. Since an efflux ratio higher than 2 has been adopted to identify P-gp substrates for Borst cell lines [83], we suggested using an 8.5 efflux ratio cut off for the NIH cell line to define P-gp substrates. When more than one efflux ratio value were available for the same drug in the same derived cell systems, the cut off was applied to the average of all the published values. If the efflux ratio value of both Borst and NIH cell lines were available for the same drug, and the results in these two cell lines are inconsistent, as found for citalopram, we adopted the assignment based on the Borst cell line data.
Table 3.
The permeability of antidepressants in PAMPA
| Drug | BDDCS Class | PAMPA (cm/sec ×106) |
Reference |
|---|---|---|---|
|
| |||
| Amitriptyline | 1 | 8 | [34] |
| Amoxepine | 1 | 12 | [34] |
| Bupropion | 1 | 13 | [34] |
| Citalopram | 2 | 9 | [34] |
| 14.5 | [74] | ||
| Desipramine | 1 | 12 | [72] |
| Doxepin | 1 | 10 | [34] |
| Duloxetine | 1 | 28.3 | [75] |
| Fluoxetine | 1 | 7.4 | [34] |
| 0.1 | [74] | ||
| Fluvoxamine | 1 | 10 | [74] |
| Imipramine | 1 | 13 | [72] |
| Maprotiline | 1 | 8.5 | [34] |
| Mirtazapine | 1 | 13 | [34] |
| Nortriptyline | 1 | 10.1 | [74] |
| Paroxetine | 1 | 5.7 | [74] |
| Quetiapine | 1 | 11 | [34] |
| Selegiline | 1 | 26.1 | [74] |
| Sertraline | 1 | 2.8 | [74] |
| Trazodone | 2 | 12 | [34] |
| 13.6 | [74] | ||
| Venlafaxine | 1 | 8.2 | [34] |
According to these criteria, the great majority (83%) of antidepressants exhibit no or weak P-gp mediated transport. More specifically, 16 of 20 BDDCS class 1 antidepressants and all three BDDCS class 2 antidepressants (trazodone, trimipramine and citalopram) are not P-gp substrates. Both high permeability rate and absence of P-gp efflux facilitate drug transport into the brain, yielding a potentially high probability to cross the BBB. Two of the four BDDCS class 1 antidepressants (escitalopram, clomipramine, paroxetine and sertraline) showing marked P-gp efflux in the MDCK-MDR1 cells gave inconsistent results in multiple studies, clomipramine (yes Wager et al. [79]; no Mahar Doan et al. [78]); paroxetine (yes Wager et al. [79], no Feng et al. [74]). One of the three BDDCS class 2 antidepressants, citalopram, exhibited inconsistent P-gp efflux in studies conducted in different MDCK-MDR1 cell lines (yes NIH cell lines [76], no Borst cell lines [74,79]).
Although transport studies in the MDCK-MDR1 cell line have been widely used to predict a compound’s delivery into brain, there are still limitations in this system. MDCK-MDR1 cells, which are derived from canine kidney epithelial cells, differ from cerebral endothelial cells in terms of membrane permeability and endogenous transporter expression. Lack of metabolic activity in this system can influence disposition of highly metabolized antidepressants, making accurate estimation difficult based only on in vitro cell line studies. Moreover, in addition to rate of brain uptake, extent of brain exposure is also important to evaluate, since antidepressants are chronically administered. Therefore, the combination of in vitro and in vivo experimental strategies is necessary.
4.4 In vivo Mdr1knock-out mouse model
Since 1994, knockout mice that lack of the expression of P-gp have been available [84]. Experiments based on this model can be treated as a complete inhibition of P-gp leading to enhanced understanding of P-gp function.
The knockout mouse model has been used to evaluate the P-gp effect of many antidepressants. In these studies most samples were taken at a single time point. Brain and plasma concentrations at this time point were determined and compared in knockout versus wild type mice to assess the effect of P-gp [3,85–87]. Some studies collected samples at multiple time points and thus the area under the concentration-time curve (AUC) was used [5, 88, 89]. Here we collect these data in two sets, either AUC or single time point concentrations, and evaluate the extent of brain penetration and the effect of P-gp in knockout versus wild type mice.
In Table 4, calculations show that the lack of P-gp yields a 23±15% increase in the plasma AUC for 12 studies of 10 antidepressants (see KO/WT plasma). Brain exposure is generally increased to a greater extent (108±83%) in knockout versus wild type mice (KO/WT brain). To investigate how much the lack of P-gp contributes to the increase of brain exposure, brain AUC is normalized to plasma AUC (KO/WT B/P), yielding a 49±46% increase for the 12 studies. Based on Doran’s criteria [5] the effects of P-gp expression on brain penetration of CNS drugs in knockout mice relative to wild type counterparts can be assessed by comparing KO/WT B/P values relative to a unity criterion of 2. A KO/WT B/P value higher than 2 indicates P-gp has a pronounced effect on a drug’s brain penetration. For the 9 drugs investigated by Doran et al. [5], only fluvoxamine (2.26) and paroxetine (2.13) exhibit ratios greater than 2. Liu et al. [89] reported a value of 3.21 for citalopram in knockout versus wild type rats, in contrast to the 1.89 value of Doran. Uhr et al. [88] reported a ratio of 1.03 for amitriptyline, and 1.45 for nortriptyline, a value less than 2, consistent with Doran et al. [5]. These results suggest that the contribution of P-gp for most antidepressants is marginal at best.
Table 4.
P-gp substrate identification of antidepressants in multiple bidirectional transport systems
| Drug | BDDCS Class | MDCK-MDR1 Source | Donor Conc. (μ Mol) | Papp(A→B) cm/sec ×106 | Papp(B→A) cm/sec ×106 | ER | P-gp substrate | ER Reference |
|---|---|---|---|---|---|---|---|---|
|
| ||||||||
| Amitriptyline | 1 | NIH | 3 | 9.8 | 1.9 | N | [76] | |
| Amitriptyline | 1 | NIH | 5 | 3.57 | 9.88 | 2.8 | [77] | |
| Amitriptyline | 1 | Borst | 10 | 47.4 | 63.6 | 1.3 | [78] | |
| Amitriptyline | 1 | Borst | 5 | 21 | 18.3 | 0.9 | [82] | |
| Amoxapine | 1 | NIH | 3 | 14.8 | 4.1 | N | [76] | |
| Bupropion | 1 | NIH | 3 | 47.5 | 1.4 | N | [76] | |
| Clomipramine | 1 | Borst | 10 | 36.9 | 52.6 | 1.4 | Y | [78] |
| Clomipramine | 1 | Borst | 10.9 | [79] | ||||
| Citalopram | 2 | Borst | 2 | 1.3 | N | [74] | ||
| Citalopram | 2 | NIH | 3 | 18.1 | 20.1 | [76] | ||
| Citalopram | 2 | Borst | 1.9 | [79] | ||||
| Desipramine | 1 | Borst | 10 | 34.2 | 20.2 | 0.6 | N | [80] |
| Desipramine | 1 | Borst | 10 | 55.1 | 56.8 | 1.0 | [78] | |
| Desipramine | 1 | NIH | 5 | 5.56 | 37.41 | 6.7 | [77] | |
| Doxepin | 1 | Borst | 10 | 54.2 | 62.2 | 1.2 | N | [78] |
| Doxepin | 1 | NIH | 3 | 16.3 | 1.9 | [76] | ||
| Duloxetine | 1 | Borst | 1.8 | N | [79] | |||
| Escitalopram | 1 | Borst | 2.0 | Y | [79] | |||
| Escitalopram | 1 | Borst | 2.11 | 15.23 | 7.2 | [81] | ||
| Fluoxetine | 1 | Borst | 10 | 17.9 | 12.1 | 0.7 | N | [80] |
| Fluoxetine | 1 | Borst | 10 | 52.1 | 61.7 | 1.2 | [78] | |
| Fluoxetine | 1 | Borst | 2 | 0.6 | [74] | |||
| Fluoxetine | 1 | NIH | 3 | 6.4 | 1.2 | [76] | ||
| Fluoxetine | 1 | Borst | 5.2 | [79] | ||||
| Fluoxetine | 1 | NIH | 5 | 8.08 | 21.74 | 2.7 | [77] | |
| Fluoxetine | 1 | Borst | 5 | 19.1 | 12 | 0.6 | [82] | |
| Fluvoxamine | 1 | Borst | 10 | 31.7 | 38 | 1.2 | N | [78] |
| Fluvoxamine | 1 | Borst | 2 | 0.7 | [74] | |||
| Fluvoxamine | 1 | Borst | 3.1 | [79] | ||||
| Imipramine | 1 | Borst | 10 | 39.3 | 41.4 | 1.1 | N | [80] |
| Imipramine | 1 | Borst | 5 | 15.6 | 21.1 | 1.4 | [82] | |
| Imipramine | 1 | Borst | 1 | 14 | 22.8 | 1.6 | [82] | |
| Maprotiline | 1 | Borst | 10 | 45.5 | 48 | 1.1 | N | [78] |
| Maprotiline | 1 | NIH | 3 | 5.9 | 4.0 | [76] | ||
| Mirtazapine | 1 | NIH | 3 | 32.4 | 1.3 | N | [76] | |
| Mirtazapine | 1 | Borst | 1.2 | [79] | ||||
| Mirtazapine | 1 | Borst | 5 | 19.6 | 22.9 | 1.2 | [82] | |
| Nortriptyline | 1 | Borst | 10 | 33.7 | 46.8 | 1.4 | N | [78] |
| Nortriptyline | 1 | Borst | 2 | 0.6 | [74] | |||
| Paroxetine | 1 | Borst | 2 | 0.7 | Y | [74] | ||
| Paroxetine | 1 | Borst | 5.5 | [79] | ||||
| Quetiapine | 1 | NIH | 3 | 33 | 1.5 | N | [76] | |
| Quetiapine | 1 | Borst | 1.8 | [79] | ||||
| Reboxetine | 1 | Borst | 1.4 | N | [79] | |||
| Selegiline | 1 | Borst | 10 | 70.3 | 53.5 | 0.8 | N | [78] |
| Selegiline | 1 | Borst | 2 | 0.8 | [74] | |||
| Selegiline | 1 | NIH | 3 | 48.6 | 0.8 | [76] | ||
| Sertraline | 1 | Borst | 2 | 3.6 | Y | [74] | ||
| Sertraline | 1 | NIH | 3 | 2.1 | 2.6 | [76] | ||
| Sertraline | 1 | Borst | 11.2 | [79] | ||||
| Trazodone | 2 | Borst | 10 | 74.7 | 69.8 | 0.9 | N | [78] |
| Trazodone | 2 | Borst | 2 | 0.8 | [74] | |||
| Trazodone | 2 | NIH | 3 | 37.7 | 1.1 | [76] | ||
| Trimipramine | 2 | Borst | 10 | 40.5 | 37.2 | 0.9 | N | [78] |
| Venlafaxine | 1 | Borst | 0.6 | N | [74] | |||
| Venlafaxine | 1 | NIH | 3 | 11.7 | 4.7 | [76] | ||
| Venlafaxine | 1 | Borst | 1.3 | [79] | ||||
Since the unbound brain to plasma ratio (Kp,uu,brain) is a key parameter that can be used to evaluate the extent of brain exposure and estimate pharmacologically relevant brain partition, by combining the unbound fractions in mouse plasma and brain [90–93] Kp,uu,brain was calculated and compared in knockout versus wild type mice in Table 4. The comparison of Kp,uu,brain between knockout versus wild type rodents exhibits a similar result to that seen for brain to plasma ratios. However, it is obvious that even in wild type mice, where P-gp may be highly expressed in brain, the Kp,uu,brain values of all antidepressants in the list are still higher than 0.1 and 0.33, ranging from 0.56 to 1.67. As drugs with Kp,uu,brain values greater than or equal to 0.33 [38, 40] and 0.1 [54] are assigned as BBB+, this indicates that all of the antidepressants listed in Table 4 can penetrate into mouse brain.
In Table 5, blood and brain samples in knockout mice were only taken at a single time point. In this situation, concentration, instead of AUC, is utilized to calculate the B/P ratio and evaluate the extent of brain penetration. For amitriptyline, doxepin and mirtazapine, there was no significant change of the B/P value in knockout versus wild type mice. For paroxetine, trimipramine and venlafaxine, there were slight increases of B/P in knockout mice, but less than 2 fold. Only citalopram had a KO/WT B/P value higher than 2. Interestingly, metabolites had higher KO/WT B/P values compared to the parent drugs; most of the metabolites (E-10 OH AMI, Z-10 OH-AMI, E-10 OH-NOR, Z-OH-NOR) have KO/WT B/P values higher than 2 reaching as high as 8. This may be explained by the more hydrophilic properties of metabolites, which are more characteristic of P-gp substrates and a lower passive permeability, leading to the metabolites being more difficult to penetrate into brain membrane. Since Kp,uu,brain values are not available for most metabolites, we cannot conclude if these metabolites have good brain penetration under the P-gp efflux impact.
Table 5.
The extent of brain penetration evaluated in Mdr1 knockout versus wild type model using AUC measurements
| Drug | BDDCS class | Unbound ratio in mice | Wild Type | abcb 1a/1b(−/−) | KO/WT | Ref. | |||||||||
|---|---|---|---|---|---|---|---|---|---|---|---|---|---|---|---|
|
| |||||||||||||||
| fubrainc | fupc | AUCbraind | AUCpd | AUCbrain/AUCp | Kp,uu,brain | AUCbrain | AUCp | AUCbrain/AUCp | Kp,uu,brain | plasma | brain | brain/plasma | |||
| Amitriptylinea | 1 | 0.0071 | 0.13 | 13413 | 1255 | 10.69 | 0.58 | 19422 | 1761 | 11.03 | 0.60 | 1.40 | 1.45 | 1.03 | [88] |
| Citalopram-1b | 2 | 0.0306 | 0.231 | 1540 | 300 | 5.13 | 0.68 | 4170 | 429 | 9.72 | 1.29 | 1.43 | 2.71 | 1.89 | [5] |
| Citalopram-2 | 2 | 0.0306 | 0.231 | 233 | 43 | 5.41 | 0.72 | 880 | 51 | 17.36 | 2.30 | 1.18 | 3.78 | 3.21 | [89] |
| Fluoxetineb | 1 | 0.0023 | 0.031 | 11700 | 994 | 11.77 | 0.87 | 17700 | 964 | 18.36 | 1.36 | 0.97 | 1.51 | 1.56 | [5] |
| Fluvoxamineb,e | 1 | 0.0084 | 0.0387 | 1490 | 243 | 6.13 | 1.33 | 4370 | 316 | 13.83 | 3.00 | 1.30 | 2.93 | 2.26 | [5] |
| Nortriptyline-1a | 1 | 0.0046 | 0.031 | 317 | 62 | 5.11 | 0.76 | 563 | 76 | 7.43 | 1.10 | 1.22 | 1.78 | 1.45 | [88] |
| Nortriptyline-2b | 1 | 0.0046 | 0.031 | 3520 | 312 | 11.28 | 1.67 | 8430 | 414 | 20.36 | 3.02 | 1.33 | 2.39 | 1.80 | [5] |
| Paroxetineb | 1 | 0.0039 | 0.015 | 3770 | 1140 | 3.31 | 0.86 | 9170 | 1300 | 7.05 | 1.83 | 1.14 | 2.43 | 2.13 | [5] |
| Selegilineb | 1 | 0.056 | 0.16 | 247 | 66 | 3.74 | 1.31 | 357 | 87 | 4.12 | 1.44 | 1.31 | 1.45 | 1.10 | [5] |
| Sertralineb | 1 | 0.00066 | 0.011 | 7770 | 324 | 23.98 | 1.44 | 8020 | 301 | 26.64 | 1.60 | 0.93 | 1.03 | 1.11 | [5] |
| Trazodoneb | 2 | 0.047 | 0.051 | 225 | 372 | 0.60 | 0.56 | 253 | 467 | 0.54 | 0.50 | 1.26 | 1.12 | 0.90 | [5] |
| Venlafaxineb | 1 | 0.21 | 0.9 | 1860 | 448 | 4.15 | 0.97 | 4470 | 579 | 7.72 | 1.80 | 1.29 | 2.40 | 1.86 | [5] |
Amitriptyline and Nortriptyline-1 were dosed at 10mg/kg s.c. and sampled at 0.5, 1, 2, 4h
All drugs in Ref.5 were dosed 3mg/kg s.c. and sampled at 0.5, 1, 2.5, 5h
fubrain and fup were taken from references 87–93.
AUCplasma and AUCbrain are in units of ng*h/ml
For fluvoxamine, according to the author’s results and related caculations, there seems to be an error in the data recording. The brain AUC in KO mice should be 4370 not 43700
Since antidepressants are administered chronically, the extent of penetration and P-gp impairment in long-term animal studies may provide guidance for human clinical studies. In Table 5 long term and acute administration may be compared. For the 4 drugs investigated (amitriptyline, venlafaxine, mirtazapine and citalopram), there is no significant difference in the KO/WT B/P ratios between chronic dosing and acute administration. However, the amitriptyline metabolites (nortriptyline, E-10 OH-N02, 2-OH-NOR) are observed to have much higher KO/WT B/P ratios following chronic administration, which indicates that there is brain accumulation of some antidepressant metabolites following chronic treatment in knockout mice.
Here, P-gp effects on antidepressant brain penetration in knockout models, which have been investigated previously, were reanalyzed by calculating KO/WT B/P ratio and Kp,uu,brain. Sertraline (BDDCS class 1) was identified as a P-gp substrate in the MDCK-MDR1 cell model and has a minor P-gp effect in the knockout model (with a KO/WT B/P value of 1.11 and Kp,uu,brain value of 1.60 (Table 4)). Interestingly, fluvoxamine, which is reported not to be a P-gp substrate in MDCK-MDR1 cell lines in two out of three studies in Table 3, has an observed KO/WT B/P value of 2.26, which indicates a marked P-gp impact. Paroxetine and citalopram show discrepancies of KO/WT B/P in different studies as listed in Tables 4 and 5. This could be caused by a functional change of endogenous factors in knockout rodents compared to wild type. Besides these, other antidepressants show minor KO/WT B/P ratio differences in knockout versus wild type mice. Meanwhile, as shown in Tables 4 and 5, all Kp,uu,brain values obtained here are higher than 0.33 (and thus 0.1) for both knockout and wild type mice, which implies that all antidepressants previously investigated in knockout model have good penetration into mouse brain.
Limitations in the use of the P-gp knockout mice have been discussed. O’Brien et al. suggested that up-regulation of BCRP in the P-gp knockout mice may potentially affect drug distribution in the brain, since there is an overlap between P-gp and BCRP substrates [4]. Though the amount of BCRP mRNA in the brain microvessels of abcb1a(−/−) mice was reported to be increased 3 fold relative to wild type animals [94], no change of BCRP at the protein expression level was observed [95]. It has also been suggested that complete knockout of P-gp may result in changes in the expression of metabolic enzymes and thus antidepressants may be metabolized differently [88,96]. In these studies, plasma concentrations are compared between wild type and knockout mice. However, no pronounced increases or decreases of plasma concentrations for the antidepressants in knockout versus wild type mice have been reported. Therefore changes of brain exposure caused by enzyme or other non-cerebral factors do not appear to be material.
4.5 In vivo rat model with P-gp inhibition
Chemical inhibition of P-gp in rats has been routinely used to predict the potential for drug-drug interactions related to human P-gp efflux at the BBB with the development of noninvasive positron emission topography (PET) imaging methods. Studies in rats with a P-gp inhibitor, rather than P-gp knockout mice, can provide a useful tool to investigate the role of efflux transporters in terms of drug brain penetration [98,99].
Several studies have been conducted in wild type rats with antidepressants co-administered with P-gp inhibitors. Clarke et al. examined the influence of inhibition of P-gp on the brain penetration of imipramine and its metabolite, desipramine [100]. Rats were pretreated with verapamil (20 mg/kg) as a P-gp inhibitor, followed by an i.p. dose of 15mg/kg imipramine, and diverse brain region samples were taken to examine P-gp effects in the brain. Our reanalysis of the studies in Table 6 showed that the presence of verapamil resulted in increased concentrations of imipramine and its metabolite desipramine both in the brain and in the plasma. However, increases of B/P in most brain regions are less than 2 for imipramine, except in the frontal cortex (2.13). This analysis suggests that there was no significant efflux of imipramine and its metabolite desipramine in rat brain. Interestingly, in another experiment conducted by the same group, where imipramine was administered intravenously and animals were pretreated with the same dose of verapamil, a converse decrease of imipramine plasma concentrations was observed, indicating that the effect of verapamil is complicated in vivo [16].
Table 6.
The extent of brain penetration evaluated in Mdr1 knockout versus wild type model using single time point measurements
| Drug | BDDCS class | Sample taken | Unbound ratio in mice | Wild type mice | abcb 1a/1b(−/−) mice | KO/WT Ratio | Ref. | |||||||||
|---|---|---|---|---|---|---|---|---|---|---|---|---|---|---|---|---|
|
| ||||||||||||||||
| fubrain | fuP | Cbraing | Cpg | Cbrain/Cp | Kp,u,u,b | Cbraing | Cpg | Cbrain/Cp | Kp,u,u,b | brain | plasma | brain/plasma | ||||
| Amitriptyline-1a | 1 | 0.5h | 0.0071 | 0.13 | 5865 | 725 | 8.09 | 0.44 | 7447 | 931 | 8.00 | 0.44 | 1.27 | 1.28 | 0.99 | [88] |
| 1h | 0.0071 | 0.13 | 6121 | 530 | 11.55 | 0.63 | 7433 | 836 | 8.89 | 0.49 | 1.21 | 1.58 | 0.77 | [88] | ||
| 2h | 0.0071 | 0.13 | 3148 | 269 | 11.70 | 0.64 | 5582 | 348 | 16.04 | 0.88 | 1.77 | 1.29 | 1.37 | [88] | ||
| 4h | 0.0071 | 0.13 | 1168 | 91 | 12.84 | 0.70 | 1746 | 146 | 11.96 | 0.65 | 1.49 | 1.60 | 0.93 | [88] | ||
| Nortriptylinea | 1 | 0.5h | 0.0046 | 0.031 | 25 | 9 | 2.78 | 0.41 | 46 | 18 | 2.56 | 0.38 | 1.84 | 2.00 | 0.92 | [88] |
| 1h | 0.0046 | 0.031 | 44 | 14 | 3.14 | 0.47 | 94 | 19 | 4.95 | 0.73 | 2.14 | 1.36 | 1.57 | [88] | ||
| 2h | 0.0046 | 0.031 | 105 | 22 | 4.77 | 0.71 | 153 | 21 | 7.29 | 1.08 | 1.46 | 0.95 | 1.53 | [88] | ||
| 4h | 0.0046 | 0.031 | 114 | 14 | 8.14 | 1.21 | 240 | 21 | 11.43 | 1.70 | 2.11 | 1.50 | 1.40 | [88] | ||
| E-10 OH-AMIa | 0.5h | 135 | 95 | 1.42 | 340 | 90 | 3.78 | 2.52 | 0.95 | 2.66 | [88] | |||||
| 1h | 229 | 128 | 1.79 | 540 | 128 | 4.22 | 2.36 | 1.00 | 2.36 | [88] | ||||||
| 2h | 299 | 144 | 2.08 | 728 | 144 | 5.06 | 2.43 | 1.00 | 2.43 | [88] | ||||||
| 4h | 171 | 92 | 1.86 | 561 | 113 | 4.96 | 3.28 | 1.23 | 2.67 | [88] | ||||||
| Z-10 OH-AMIa | 0.5h | 19 | 15 | 1.27 | 61 | 17 | 3.59 | 3.21 | 1.13 | 2.83 | [88] | |||||
| 1h | 37 | 23 | 1.61 | 104 | 31 | 3.35 | 2.81 | 1.35 | 2.09 | [88] | ||||||
| 2h | 66 | 44 | 1.50 | 186 | 38 | 4.89 | 2.82 | 0.86 | 3.26 | [88] | ||||||
| 4h | 42 | 29 | 1.45 | 203 | 30 | 6.77 | 4.83 | 1.03 | 4.67 | [88] | ||||||
| E-10 OH-NORa | 0.5h | — | 32 | — | 18 | 40 | 0.45 | — | 1.25 | — | [88] | |||||
| 1h | — | 51 | — | 29 | 52 | 0.56 | — | 1.02 | — | [88] | ||||||
| 2h | 33 | 72 | 0.46 | 68 | 66 | 1.03 | 2.06 | 0.92 | 2.25 | [88] | ||||||
| 4h | 34 | 58 | 0.59 | 148 | 79 | 1.87 | 4.35 | 1.36 | 3.20 | [88] | ||||||
| Z-OH-NORa | 0.5h | — | 24 | — | 7 | 42 | 0.17 | — | 1.75 | — | [88] | |||||
| 1h | — | 37 | — | 7 | 38 | 0.18 | — | 1.03 | — | [88] | ||||||
| 2h | 13 | 69 | 0.19 | 27 | 57 | 0.47 | 2.08 | 0.83 | 2.51 | [88] | ||||||
| 4h | 16 | 49 | 0.33 | 57 | 62 | 0.92 | 3.56 | 1.27 | 2.82 | [88] | ||||||
|
| ||||||||||||||||
| Amitriptyline-2b | 1 | 4h after last injection | 0.0071 | 0.13 | 1555 | 150 | 10.35 | 0.57 | 1643 | 123 | 13.34 | 0.73 | 1.06 | 0.82 | 1.29 | [86] |
| Nortriptylineb | 1 | 4h after last injection | 0.0046 | 0.031 | 922 | 135 | 6.85 | 1.02 | 2425 | 166 | 14.63 | 2.17 | 2.63 | 1.23 | 2.14 | [86] |
| E-10 OH-AMIb | 4h after last injection | 34.3 | 21 | 1.63 | 69.8 | 32 | 2.18 | 2.03 | 1.52 | 1.34 | [86] | |||||
| Z-10 OH-AMIb | 4h after last injection | 28.5 | 19 | 1.51 | 137 | 18 | 7.42 | 4.81 | 0.98 | 4.93 | [86] | |||||
| E-10 OH-NORb | 4h after last injection | 33.8 | 73 | 0.46 | 339 | 92 | 3.67 | 10.04 | 1.26 | 7.96 | [86] | |||||
| Z-OH-NORb | 4h after last injection | 37.9 | 87 | 0.44 | 262 | 105 | 2.50 | 6.89 | 1.20 | 5.73 | [86] | |||||
|
| ||||||||||||||||
| Citalopram-1a | 2 | 1h post dose | 0.0306 | 0.231 | 154 | 33 | 4.62 | 0.61 | 455 | 29 | 15.75 | 2.09 | 2.96 | 0.87 | 3.41 | [3] |
|
| ||||||||||||||||
| Citalopram-2c | 2 | 0h after 11 days | 0.0306 | 0.231 | 158 | 107 | 1.48 | 0.20 | 481 | 89 | 5.38 | 0.71 | 3.04 | 0.84 | 3.63 | [87] |
|
| ||||||||||||||||
| Doxepina | 1 | 1h post dose | 0.025 | 0.18 | 2609 | 365 | 7.14 | 0.99 | 3140 | 414 | 7.58 | 1.05 | 1.20 | 1.13 | 1.06 | [85] |
| D-Doxepina | 18.3 | 9.5 | 1.93 | 27 | 11 | 2.43 | 1.48 | 1.17 | 1.26 | [85] | ||||||
|
| ||||||||||||||||
| Mirtazapine-1d | 1 | 1h post dose | 0.08 | 0.15 | 128 | 41 | 3.10 | 1.66 | 163 | 55 | 2.99 | 1.59 | 1.28 | 1.33 | 0.96 | [85] |
|
| ||||||||||||||||
| Mirtazapine-2c | 1 | 0h after 11 days | 0.08 | 0.15 | 34.9 | 7.7 | 4.56 | 2.43 | 51.3 | 11 | 4.59 | 2.45 | 1.47 | 1.46 | 1.01 | [87] |
|
| ||||||||||||||||
| Paroxetined | 1 | 1h post dose | 0.0039 | 0.015 | 213 | 111 | 1.93 | 0.50 | 455 | 150 | 3.03 | 0.79 | 2.14 | 1.36 | 1.57 | [85] |
|
| ||||||||||||||||
| Trimipraminea | 2 | 1h post dose | 0.007 | 0.05 | 1389 | 198 | 7.00 | 0.98 | 1666 | 171 | 9.75 | 1.36 | 1.20 | 0.86 | 1.39 | [3] |
| D-Trimipraminea | 1h post dose | 33 | 12 | 2.75 | 48.4 | 15 | 3.34 | 1.47 | 1.21 | 1.21 | [3] | |||||
|
| ||||||||||||||||
| Venlafaxinee | 1 | 1h post dose | 0.21 | 0.9 | 878 | 178 | 4.92 | 1.15 | 2014 | 228 | 8.85 | 2.06 | 2.29 | 1.28 | 1.80 | [85] |
| D-Venlafaxinee | 59.4 | 43 | 1.39 | 111 | 47 | 2.34 | 1.87 | 1.11 | 1.68 | [85] | ||||||
|
| ||||||||||||||||
| Venlafaxine-2f | 1 | 0h after 11 days | 0.21 | 0.9 | 261 | 71 | 3.66 | 0.85 | 456 | 71 | 6.47 | 1.51 | 1.75 | 0.99 | 1.77 | [87] |
| D-Venlafaxinef | 0h after 11 days | 8.97 | 5.5 | 1.63 | 37 | 6 | 6.19 | 4.12 | 1.09 | 3.79 | [87] | |||||
All parent drugs were dosed at 10mg/kg s.c.
Amitriptyline-2 was dosed at 10mg/kg s.c.for 10days.
Citalopram-2 and mirtazapine-2 were dosed at 60μg/d s.c. for 11days
Mirtazapine-1 and paroxetine were dosed at 1mg/kg s.c.
Venlafaxine-1 were dosed at 5mg/kg s.c.
Venlafaxine-2 were dosed at 300μg/d s.c. for 11days
Cplasma and Cbrain are in units of ng/ml
Inhibition studies were also conducted with different doses of nortriptyline, using cyclosporin A (CSA) as an inhibitor (Table 6) [101]. A high dose of CSA (200 mg/kg) did not change the nortriptyline B/P more than 2 fold following either i.p. or oral dosing. When both nortriptyline and CSA are given orally both the plasma and brain concentrations of nortriptyline and the measured metabolite decrease, as compared to when both the drug and the inhibitor are given i.p., suggesting a gut effect of CSA, as we have shown previously [62]. However, little changes are observed for the brain to plasma P-gp inhibition to control ratios for nortriptyline, although following oral dosing of the parent drug and CSA, the E-10-OH NT metabolite ratio in the brain did exceed 2, although little change was found following i.p. dosing.
In the case of escitalopram, there was a region-dependent efflux inhibition in the presence of inhibitor CSA in different regions of brain. An intra arterial dose of 25 mg/kg CSA resulted in a remarkable increase of the B/P ratio both in prefrontal cortex (3.23 fold) and hippocampus (2.67 fold), although plasma concentrations were unchanged. The authors proposed that the increase in brain concentrations was due to the inhibition of P-gp at the BBB [82].
Kp,uu,brain of antidepressants was further evaluated in rats. Imipramine, desipramine and nortriptyline show Kp,uu,brain values in Table 6 much higher than 0.33 (except for i.v. imipramine dosing where dialysate samples from brain extracellular fluid (ECF) were taken), implying good penetration into the brain. In studies that utilized brain extracellular fluid, i.e., dialysate values in Table 6, instead of the brain concentration to investigate the P-gp effect in the brain, Kp,uu,brain of imipramine is lower than 0.1 both in the presence and absence of the P-gp inhibitors, verapamil [16]. Kp,uu,brain of escitalopram is also lower than 0.1 without pretreatment of CSA, yet increase, (but below 0.33) with P-gp inhibition [86]. These microdialysis studies [16,81] suggest that for Kp,uu,brain values determined by this method, the cut-off between BBB+ and BBB− may be even lower than 0.1.
The wild type rat model allows one to evaluate the interplay of various transporters and enzymes in one system. However, some P-gp inhibitors can also inhibit metabolic enzymes. For example, verapamil is an inhibitor of CYP3A and CSA (20μM) can inhibit CYP2D6 activity by 30%, as well as CYP3A. Since most marketed antidepressants are BDDCS class 1 and 2 drugs, which are highly permeable and extensively metabolized, the specificity of P-gp inhibitors is of vital importance in evaluating the chemical inhibition studies in vivo in rats.
5. Extrapolation from Preclinical to Clinical
5.1 Species differences between humans and rodents
The inconsistent reports between in vitro MDCK-MDR1 and in vivo rodents has been noted [82], with the potential reason claimed to be the species differences of P-gp transport activity between humans and rodents. However, based on the analysis of 3300 Pfizer compounds by Feng et al., the efflux ratio of human MDR1 correlated well with mouse Mdr1a using highly expressed MDCK cell lines, reflecting an extensive substrate overlap between humans and mice [74].
Differences in expression levels between species have also been cited. Evidence showed that the P-gp expression level in mouse brain microvessels [102] is 14.1 fmol/μg protein, By contrast, a 2.33 fold smaller level in human brain microvessels (6.06 fmol/μg protein) than that of mdr1a in mice was observed [103].
In terms of species differences, other factors related to brain penetration have also been investigated. According to Di et al., no species differences in the brain unbound fraction between human, mice and rats were found [104]. However, cross species differences in the inhibitory effect of typical P-gp inhibitors have been reported both in vitro and in vivo, suggesting a careful extrapolation of animal data to human data should be made when predicting the potential human P-gp effect [105, 106].
5.2 Does P-gp efflux at the BBB extrapolate to poor human brain penetration?
Since some rodent studies report that P-gp limits access of various antidepressants into brain (Tables 4–6), there is a concern that P-gp may restrict the brain exposure of antidepressants in humans and contribute to the high clinical treatment failure rates [4, 16, 89]. Yet, equivocal results have been reported for the association between functional SNPs in ABCB1 and antidepressant treatment response [6, 87,107].
Here, in on our extensive literature review and data collection, most antidepressants show insignificant P-gp efflux and good penetration at the BBB, with minimal changes in genetic knockouts or chemical inhibition rodent studies, which is consistent with the observations in MDCK-MDR1 cell lines that most antidepressants are not P-gp substrates in bidirectional transport cell systems.
Some antidepressants yield conflicting P-gp effects between in vitro cell system and in vivo rodent studies. For fluvoxamine and citalopram, which were identified as non P-gp substrates in cell systems (Table 3), significant efflux in knockouts (Tables 4 and 5) was observed. This probably can be explained by the distinct P-gp expression levels in different systems [111], causing dissimilar sensitivity in terms of P-gp efflux. Specifically, it was shown that the P-gp expression levels in Borst MDR1-MDCK cell lines [112] and mouse brain microvessels [102] are 1.91 and 14.1 fmol/μg protein, respectively; whereas in knockout mice, the P-gp expression level could be treated as zero. Another potential reason that should be considered is that the identification of P-gp substrates in the NIH cell line is based on an efflux ratio of 8.5, which was a roughly statistical cutoff based on 153 drugs and may cause inaccurate results. For example, the transport study of zidovudine conducted in the NIH MDCK-MDR1 cell line, reported that the efflux could be inhibited by the P-gp inhibitor GG918 with the efflux ratio decreasing from 5.79 to 4.25 [113]. This study suggested that zidovudine was a P-gp substrate even though the efflux ratio was lower than 8.5 and the ratio change was minimal. Integrating the data from both in vitro cell lines and in vivo rodents, probably suggests that the antidepressants fluvoxamine (BDDCS class 1) and citalopram (BDDCS class 2) are P-gp substrates.
For escitalopram and paroxetine (BDDCS class 1), which were identified as P-gp substrates in in vitro cell systems (Table 3), P-gp efflux in vivo rodents was observed (for paroxetine yes in AUC measurements, Table 4; no in the single time point study, Table 5; for escitalopram yes in the intraarterial inhibitor study, Table 6). However, so far there is no direct evidence showing that efflux transporters could clinically prevent these drugs from penetration into the brain thereby decreasing efficacy at the site of action.
In addition, from the data analysis above, we can see that no matter whether the transport of antidepressants are mediated by P-gp or not, all of them have good brain penetration in rodents with all Kp,uu,brain values higher than the BBB+ cut-off value 0.33 that was proposed by Kalvass and coworkers [38, 40] and 0.1 that was proposed by Broccatelli et al. [54]. The only exception is the Kp,uu,brain values obtained in microdialysis methods that possibly represent a methodological difference in brain penetration measurements. These findings are in accordance with our BDDCS prediction in terms of brain penetration that transporter effects will be clinically insignificant for BDDCS class 1 drugs.
5.3 Preclinical P-gp efflux inhibition at BBB: an effective strategy for human therapy?
According to our observations above, most antidepressants are not P-gp substrates. Among the 6 antidepressants that may be P-gp substrates, 5 of them belong to BDDCS class 1, which were validated to have a low chance to be affected by P-gp transport in the brain. We believe that P-gp efflux does not exert a significant impact on most antidepressants at the BBB, and that it is unrelated to treatment-resistant depression. However, for the BDDCS class 2 antidepressant citalopram, which is probably a P-gp substrate, the P-gp transporter effect at BBB is complicated, with a greater chance to be affected. In this case, whether coadministration of a P-gp inhibitor with citalopram is a good strategy could be considered.
Based on a study reported by Bart et al., there is a 770% increase of verapamil B/P ratio in the Mdr1a/b knockout mice compared with wild type mice [114]. In wild type mice with 50mg/kg CSA as a P-gp inhibitor, the B/P ratio of verapamil increased 5.3 fold [115]. In contrast, Sasongko only observed a B/P ratio increase of 88% in the presence of high dose CSA in a human PET study [56].
It is difficult to extrapolate rodent data to evaluate the potential of clinical drug-drug interactions at the BBB in human clinical studies. Feng et al. recommended a B/P AUC ratio cutoff of 4 between P-gp knockout and wild type mice if one were to expect a P-gp effect in vivo at the BBB [74]. However, based on current clinical data, there are no consistent examples that inhibition of P-gp in the blood–brain barrier results in higher brain concentrations leading to adverse drug effects [96,116]. The International Transporter Consortium noted “Despite the large increases in CNS exposure observed in animals and the clinical availability of very potent P-gp inhibitors, appreciable enhancement of CNS drug exposure as a result of P-gp inhibition has not been demonstrated in humans. The limited success in inhibiting BBB efflux is primarily explained by the inability to achieve unbound systemic inhibitor concentrations that are sufficient to elicit appreciable inhibition … Significant clinical DDIs at the BBB are thus not anticipated with currently marketed drugs under clinically relevant dosing conditions.” [116]. Therefore, the large differences observed in comparing rodents to human can be explained by the inability to achieve inhibitor unbound plasma concentrations higher than Ki in humans, but not in rodents [117].
The relationship between the extent of efflux inhibition and increase in brain exposure can be depicted as:
| (2) |
Equation 2 shows that when a 50% inhibition is achieved by a P-gp inhibitor, the increase of CNS exposure is 2 fold, compared to the untreated group. However, most P-gp inhibitors cannot reach an unbound concentration higher than Ki at conventional doses [116]. Based on this, for antidepressants, with limited P-gp efflux at the BBB, it appears to us that co-administration of P-gp inhibitors together with citalopram to enhance brain penetration is not a reliable strategy.
5.4 Good brain penetration: Incorporating passive permeability, P-gp efflux and unbound fractions in the brain and blood
Some publications report that a high P-gp efflux ratio in an in vitro cell system is a reflection of a high P-gp efflux in vivo and low penetration of compound into brain [40]. Although P-gp limits CNS penetration, it does not always preclude it entirely. We should take a balanced view on the roles of passive diffusion and active efflux in drug transport. Low passive permeability rate and high efflux ratio drugs are more likely to translate to poor CNS penetration; whereas high passive permeability rate and high efflux ratio drugs are likely to have good CNS penetration. One possible reason of this discrepancy between in vitro and in vivo studies is that passive transcellular transport could be rapid enough to overcome carrier mediated efflux [118]. To our knowledge, the efflux ratio does not seem to be a strong predictor of in vivo CNS penetration. Supporting this hypothesis is a study conducted by Doran and his colleagues. They have investigated the P-gp effects of 32 CNS drugs in Mdr1a/1b knockout mice and demonstrated that the impact of P-gp is minor for the majority of CNS drugs, although most of them demonstrated significantly greater B/P ratios in knockout mice compared to wild type mice. Using the CNS drug, risperidone (BDDCS Class 1) as an example, they showed that risperidone is a good substrate of P-gp but it is still clinically effective [5].
By looking at the in vivo data collected in Tables 4, 5 and 6, some antidepressants are affected by P-gp in wild type mice or rat, but they exhibit good brain penetration with Kp,uu,brain values higher than 0.33. In addition, even when P-gp is knocked out or inhibited, Kp,uu,brain values are not markedly increased. This indicates that P-gp efflux is not the only factor that impacts drug brain penetration.
In some situations, even low permeability rates and high efflux ratios may not translate into poor brain penetration. Based on a study of Summerfield et al., compounds (GSK 2 and GSK3) that fell into these criteria exhibited in vivo unbound brain to blood concentration ratios of 0.5 and 1, respectively, thus highlighting the role of brain and plasma unbound fractions in determining the CNS penetration [119]. Unbound fractions and nonspecific tissue binding can act as compensating forces for the free drug.
6. Conclusions
Our investigation summarized the advantages and limitations of different models, and the consistency found in evaluating brain penetration among different models. The belief that antidepressants are substrates of P-gp and antidepressants treatment-resistant depression may be related to P-gp effects are based primarily on the results in P-gp knockout animals. Our reanalysis showed that only very few antidepressants are P-gp substrates in MDCK-MDR1 bidirectional transport models and most antidepressants have B/P ratios lower than 2 in P-gp knockout versus wild type animals. In addition, these antidepressants exhibit high permeability in PAMPA and other cell systems, and the Kp,uu,brain for the investigated antidepressants is greater than 0.1. Thus even high P-gp efflux ratio does not necessarily translate into poor brain penetration. The involvement of P-gp effect in BBB is more closely associated with poor permeability drugs. Consequently, there appears to be little possibility that treatment-resistant depression is due to the P-gp efflux liability for these antidepressants. Other factors, such as enzyme induction may be considered since most antidepressants are BDDCS class 1 and 2 drugs. This analysis could also been applied to other CNS drugs, such as antiepileptic drugs, antipsychotics, for which the discrepancy have been proposed.
Table 7.
The extent of brain penetration evaluated in vivo rat model with P-gp inhibition
| Drug | BDDC S class |
Dose | Sample taken | Inhibitor Dose | fu braina | fu pa | specific brain regionb |
Control | P-gp inhibition | fold change(P-gp inhibition/Control) | Ref. | ||||||||
|---|---|---|---|---|---|---|---|---|---|---|---|---|---|---|---|---|---|---|---|
|
| |||||||||||||||||||
| Cbrain | Cp | Cbrain/Cp | Kp,uu,b | Cbrain | Cp | Cbrain/Cp | Kp,uu,b | brain | plasma | brain/plasma | |||||||||
| Escitalopram | 1 | iv bolus and infusionc | microdialysis samples, collected at 20min interval. | 25mg/kg CSA intra arterially | 0.003 | 0.5 | prefrontal cortex | 7074 | 709 | 9.98 | 0.06 | 21827 | 678 | 32.19 | 0.19 | 3.09 | 0.96 | 3.23 | [81] |
| 0.003 | 0.5 | hippocampus | 7999 | 709 | 11.28 | 0.07 | 20432 | 678 | 30.14 | 0.18 | 2.55 | 0.96 | 2.67 | [81] | |||||
|
| |||||||||||||||||||
| Imipramine | 1 | 15mg/kg i.p.
|
2h after dose | 20mg/kg verapamil i.p. | 0.035 | 0.29 | hypothalamus | 2155 | 104 | 20.72 | 2.50 | 3189 | 140 | 22.78 | 2.75 | 1.48 | 1.35 | 1.10 | [100] |
| Desipramine | 1 | metabolites | 0.008 | 0.15 | hypothalamus | 3949 | 137.8 | 28.66 | 1.53 | 4953 | 179 | 27.75 | 1.48 | 1.25 | 1.30 | 0.97 | [100] | ||
|
| |||||||||||||||||||
| Imipramine | 1 | 15mg/kg i.p.
|
2h after dose | 20mg/kg verapamil i.p. | 0.035 | 0.29 | hippocampus | 1863 | 104 | 17.91 | 2.16 | 3574 | 140 | 25.53 | 3.08 | 1.92 | 1.35 | 1.43 | [100] |
| Desipramine | 1 | metabolites | 0.008 | 0.15 | hippocampus | 1801 | 137.8 | 13.07 | 0.70 | 2628 | 179 | 14.72 | 0.79 | 1.46 | 1.30 | 1.13 | [100] | ||
|
| |||||||||||||||||||
| Imipramine | 1 | 15mg/kg i.p.
|
2h after dose | 20mg/kg verapamil i.p. | 0.035 | 0.29 | frontal cortex | 1593 | 104 | 15.32 | 1.85 | 4577 | 140 | 32.69 | 3.95 | 2.87 | 1.35 | 2.13 | [100] |
| Desipramine | 1 | metabolites | 0.008 | 0.15 | frontal cortex | 1588 | 137.8 | 11.52 | 0.61 | 3539 | 179 | 19.83 | 1.06 | 2.23 | 1.30 | 1.72 | [100] | ||
|
| |||||||||||||||||||
| Imipramine | 1 | 15mg/kg i.p.
|
2h after dose | 20mg/kg verapamil i.p. | 0.035 | 0.29 | brainstem | 1299 | 104 | 12.49 | 1.51 | 3473 | 140 | 24.81 | 2.99 | 2.67 | 1.35 | 1.99 | [100] |
| Desipramine | 1 | metabolites | 0.008 | 0.15 | brainstem | 1335 | 137.8 | 9.69 | 0.52 | 2315 | 179 | 12.97 | 0.69 | 1.73 | 1.30 | 1.34 | [100] | ||
|
| |||||||||||||||||||
| Imipramine | 1 | 5mg/kg i.v.
|
microdialysis samples, collected at 20min interval. | 20mg/kg verapamil i.p.
|
0.035 | 0.29 | dialysate AUC | 1322 | 1E+05 | 0.01 | 0.04 | 1802 | 88002 | 0.02 | 0.07 | 1.36 | 0.87 | 1.57 | [16] |
| Imipramine | 1 | 5mg/kg i.v.
|
25mg/kg CSA i.v. | 0.035 | 0.29 | 1322 | 1E+05 | 0.01 | 0.04 | 2108 | 81041 | 0.03 | 0.09 | 1.59 | 0.80 | 2.00 | [16] | ||
|
| |||||||||||||||||||
| Nortriptyline | 1 | 25mg/kg p.o.
|
1h after dose | 200mg/kg CSA p.o. | 0.005 | 0.08 | whole brain | 1515 | 87 | 17.41 | 1.09 | 974 | 47 | 20.72 | 1.30 | 0.64 | 0.54 | 1.19 | [101] |
| E-10-OH-NT | metabolite | 250 | 310 | 0.81 | — | 195 | 113 | 1.73 | — | 0.78 | 0.36 | 2.14 | [101] | ||||||
|
| |||||||||||||||||||
| Nortriptyline | 1 | 10mg/kg i.p.
|
1h after dose | 200mg/kg CSA i.p. | 0.005 | 0.08 | whole brain | 6860 | 338 | 20.30 | 1.27 | 13750 | 541 | 25.42 | 1.59 | 2.00 | 1.60 | 1.25 | [101] |
| E-10-OH-NT | metabolite | 192 | 127 | 1.51 | — | 589 | 336 | 1.75 | — | 3.07 | 2.65 | 1.16 | [101] | ||||||
|
| |||||||||||||||||||
| Nortriptyline | 1 | 25mg/kg i.p.
|
1h after dose | 200mg/kg CSA i.p. | 0.005 | 0.08 | whole brain | 29134 | 1321 | 22.05 | 1.38 | 32219 | 1218 | 26.45 | 1.65 | 1.11 | 0.92 | 1.20 | [101] |
| E-10-OH-NT | metabolite | 765 | 994 | 0.77 | — | 1664 | 1583 | 1.05 | — | 2.18 | 1.59 | 1.37 | [101] | ||||||
fubrain and fup were taken from references 90–93.
For imipramine microdialysis samples,plasma and dialysate AUC(ng × min/ml) were caculated to compare P-gp inhibition effect.
For other samples, concentration in plasma(ng/ml) and brain(ng/g) were caculated.
6mg/kg iv bolus and continuous 4mg/kg/h infusion to achive steady state at 2h
Key Points.
The contradictory observations of P-gp effect on antidepressants brain penetration in different in vitro and in vivo methods were reanalyzed by evaluating the rate of brain uptake and extent of brain uptake.
A Kp,uu,brain cut-off value of 0.1 to differentiate BBB+ and BBB− drugs appears to be most appropriate for antidepressants.
The reliability of in silico, in vitro and in vivo methods was elucidated.
Our current investigation suggests that coadministration of a P-gp inhibitor with antidepressants is not a good clinical strategy for treatment resistant depression therapy.
Acknowledgments
We thank the Chinese Scholarship Council for providing financial support for Yi Zheng to carry out these analyses in Dr. Benet’s laboratory at the University of California San Francisco. The work in Dr. Benet’s laboratory was funded in part by NIH Grants RR031474 and GM061390.
References
- 1.Levav I, Rutz W. The WHO World Health Report 2001 new understanding–new hope. Isr J Psychiatry Relat Sci. 2002;39:50–6. [PubMed] [Google Scholar]
- 2.Banks WA. Developing drugs that can cross the blood-brain barrier: applications to Alzheimer’s disease. BMC Neurosci. 2008 doi: 10.1186/1471-2202-9-S3-S2. [DOI] [PMC free article] [PubMed] [Google Scholar]
- 3.Uhr M, Grauer MT. abcb1ab P-glycoprotein is involved in the uptake of citalopram and trimipramine into the brain of mice. J Psychiatr Res. 2003;37:179–85. doi: 10.1016/s0022-3956(03)00022-0. [DOI] [PubMed] [Google Scholar]
- 4.O’Brien FE, Dinan TG, Griffin BT, Cryan JF. Interactions between antidepressants and P-glycoprotein at the blood-brain barrier: clinical significance of in vitro and in vivo findings. Br J Pharmacol. 2012;165:289–312. doi: 10.1111/j.1476-5381.2011.01557.x. [DOI] [PMC free article] [PubMed] [Google Scholar]
- 5.Doran A, Obach RS, Smith BJ, Hosea NA, Becker S, Callegari E, et al. The impact of P-glycoprotein on the disposition of drugs targeted for indications of the central nervous system: evaluation using the MDR1A/1B knockout mouse model. Drug Metab Dispos. 2005;33:165–74. doi: 10.1124/dmd.104.001230. [DOI] [PubMed] [Google Scholar]
- 6.Peters EJ, Reus V, Hamilton SP. The ABCB1 transporter gene and antidepressant response. F1000 Biol Rep. 2009;1:23. doi: 10.3410/B1-23. [DOI] [PMC free article] [PubMed] [Google Scholar]
- 7.Nestler EJ, Barrot M, DiLeone RJ, Eisch AJ, Gold SJ, Monteggia LM. Neurobiology of depression. Neuron. 2002;34:13–25. doi: 10.1016/s0896-6273(02)00653-0. [DOI] [PubMed] [Google Scholar]
- 8.Faron-Gorecka A, Kusmider M, Solich J, Kolasa M, Szafran K, Zurawek D, et al. Involvement of prolactin and somatostatin in depression and the mechanism of action of antidepressant drugs. Pharmacol Rep. 2013;65:1640–6. doi: 10.1016/s1734-1140(13)71525-1. [DOI] [PubMed] [Google Scholar]
- 9.Huot KL, Lutfiyya MN, Akers MF, Amaro ML, Swanoski MT, Schweiss SK. A population-based cross-sectional study of health service deficits among U.S. adults with depressive symptoms. BMC Health Serv Res. 2013;13:160. doi: 10.1186/1472-6963-13-160. [DOI] [PMC free article] [PubMed] [Google Scholar]
- 10.Yıldız A, Gonul AS, Tamam L. Mechanism of actions of antidepressants: beyond the receptors. Bull Clin Psychopharmacog. 2002;12:194–200. [Google Scholar]
- 11.Fava M. Diagnosis and definition of treatment-resistant depression. Biol Psychiatry. 2003;53:649–59. doi: 10.1016/s0006-3223(03)00231-2. [DOI] [PubMed] [Google Scholar]
- 12.Nemeroff CB, Mayberg HS, Krahl SE, McNamara J, Frazer A, Henry TR, et al. VNS therapy in treatment-resistant depression: clinical evidence and putative neurobiological mechanisms. Neuropsychopharmacology. 2006;31:1345–55. doi: 10.1038/sj.npp.1301082. [DOI] [PubMed] [Google Scholar]
- 13.Shelton RC, Osuntokun O, Heinloth AN, Corya SA. Therapeutic options for treatment-resistant depression. CNS drugs. 2010;24:131–61. doi: 10.2165/11530280-000000000-00000. [DOI] [PubMed] [Google Scholar]
- 14.Rouillon F, Serrurier D, Miller HD, Gerard MJ. Prophylactic efficacy of maprotiline on unipolar depression relapse. J Clin Psychiatry. 1991;52:423–31. [PubMed] [Google Scholar]
- 15.Reynolds CF, 3rd, Perel JM, Frank E, Cornes C, Miller MD, Houck PR, et al. Three-year outcomes of maintenance nortriptyline treatment in late-life depression: a study of two fixed plasma levels. Am J Psychiatry. 1999;156:1177–81. doi: 10.1176/ajp.156.8.1177. [DOI] [PubMed] [Google Scholar]
- 16.O’Brien FE, Clarke G, Fitzgerald P, Dinan TG, Griffin BT, Cryan JF. Inhibition of P-glycoprotein enhances transport of imipramine across the blood-brain barrier: microdialysis studies in conscious freely moving rats. Br J Pharmacol. 2012;166:1333–43. doi: 10.1111/j.1476-5381.2012.01858.x. [DOI] [PMC free article] [PubMed] [Google Scholar]
- 17.Hiemke C, Hartter S. Pharmacokinetics of selective serotonin reuptake inhibitors. Pharmacol Ther. 2000;85:11–28. doi: 10.1016/s0163-7258(99)00048-0. [DOI] [PubMed] [Google Scholar]
- 18.Spina E, Trifiro G, Caraci F. Clinically significant drug interactions with newer antidepressants. CNS drugs. 2012;26:39–67. doi: 10.2165/11594710-000000000-00000. [DOI] [PubMed] [Google Scholar]
- 19.Atkinson JH, Patel SM, Meyer JM, Slater MA, Zisook S, Capparelli E. Is there a therapeutic window with some antidepressants for analgesic response? Curr Pain Headache Rep. 2009;13:93–9. doi: 10.1007/s11916-009-0018-9. [DOI] [PubMed] [Google Scholar]
- 20.Ballabh P, Braun A, Nedergaard M. The blood-brain barrier: an overview: structure, regulation, and clinical implications. Neurobiol Dis. 2004;16:1–13. doi: 10.1016/j.nbd.2003.12.016. [DOI] [PubMed] [Google Scholar]
- 21.Abbott NJ, Patabendige AA, Dolman DE, Yusof SR, Begley DJ. Structure and function of the blood-brain barrier. Neurobiol Dis. 2010;37:13–25. doi: 10.1016/j.nbd.2009.07.030. [DOI] [PubMed] [Google Scholar]
- 22.Luissint AC, Artus C, Glacial F, Ganeshamoorthy K, Couraud PO. Tight junctions at the blood brain barrier: physiological architecture and disease-associated dysregulation. Fluids Barriers CNS. 2012;9:23. doi: 10.1186/2045-8118-9-23. [DOI] [PMC free article] [PubMed] [Google Scholar]
- 23.Wong AD, Ye M, Levy AF, Rothstein JD, Bergles DE, Searson PC. The blood-brain barrier: an engineering perspective. Front Neuroeng. 2013;6:7. doi: 10.3389/fneng.2013.00007. [DOI] [PMC free article] [PubMed] [Google Scholar]
- 24.Fishman JB, Rubin JB, Handrahan JV, Connor JR, Fine RE. Receptor-mediated transcytosis of transferrin across the blood-brain barrier. J Neurosci Res. 1987;18:299–304. doi: 10.1002/jnr.490180206. [DOI] [PubMed] [Google Scholar]
- 25.King GL, Johnson SM. Receptor-mediated transport of insulin across endothelial cells. Science. 1985;227:1583–6. doi: 10.1126/science.3883490. [DOI] [PubMed] [Google Scholar]
- 26.Chen Y, Liu L. Modern methods for delivery of drugs across the blood-brain barrier. Adv Drug Deliv Rev. 2012;64:640–65. doi: 10.1016/j.addr.2011.11.010. [DOI] [PubMed] [Google Scholar]
- 27.Scherrmann JM. Drug delivery to brain via the blood-brain barrier. Vascul Pharmacol. 2002;38:349–54. doi: 10.1016/s1537-1891(02)00202-1. [DOI] [PubMed] [Google Scholar]
- 28.Pardridge WM. The blood-brain barrier: bottleneck in brain drug development. NeuroRx. 2005;2:3–14. doi: 10.1602/neurorx.2.1.3. [DOI] [PMC free article] [PubMed] [Google Scholar]
- 29.Mikitsh JL, Chacko AM. Pathways for small molecule delivery to the central nervous system across the blood-brain barrier. Perspect Medicin Chem. 2014;6:11–24. doi: 10.4137/PMC.S13384. [DOI] [PMC free article] [PubMed] [Google Scholar]
- 30.Shimomura K, Okura T, Kato S, Couraud PO, Schermann JM, Terasaki T, et al. Functional expression of a proton-coupled organic cation (H+/OC) antiporter in human brain capillary endothelial cell line hCMEC/D3, a human blood-brain barrier model. Fluids Barriers CNS. 2013;10:8. doi: 10.1186/2045-8118-10-8. [DOI] [PMC free article] [PubMed] [Google Scholar]
- 31.Levin VA. Relationship of octanol/water partition coefficient and molecular weight to rat brain capillary permeability. J Med Chem. 1980;23:682–4. doi: 10.1021/jm00180a022. [DOI] [PubMed] [Google Scholar]
- 32.Begley DJ. Delivery of therapeutic agents to the central nervous system: the problems and the possibilities. Pharmacol Ther. 2004;104:29–45. doi: 10.1016/j.pharmthera.2004.08.001. [DOI] [PubMed] [Google Scholar]
- 33.Tsuji A, Tamai II. Carrier-mediated or specialized transport of drugs across the blood-brain barrier. Adv Drug Deliv Rev. 1999;36:277–90. doi: 10.1016/s0169-409x(98)00084-2. [DOI] [PubMed] [Google Scholar]
- 34.Di L, Kerns EH, Carter GT. Strategies to assess blood-brain barrier penetration. Expert Opin Drug Discov. 2008;3:677–87. doi: 10.1517/17460441.3.6.677. [DOI] [PubMed] [Google Scholar]
- 35.Pardridge WM. Log(BB), PS products and in silico models of drug brain penetration. Drug Discov Today. 2004;9:392–3. doi: 10.1016/S1359-6446(04)03065-X. [DOI] [PubMed] [Google Scholar]
- 36.Di L, Kerns EH, Bezar IF, Petusky SL, Huang Y. Comparison of blood-brain barrier permeability assays: in situ brain perfusion, MDR1-MDCKII and PAMPA-BBB. J Pharm Sci. 2009;98:1980–91. doi: 10.1002/jps.21580. [DOI] [PubMed] [Google Scholar]
- 37.Gillette JR. Factors affecting drug metabolism. Ann N Y Acad Sci. 1971;179:43–66. doi: 10.1111/j.1749-6632.1971.tb46890.x. [DOI] [PubMed] [Google Scholar]
- 38.Kalvass JC, Maurer TS, Pollack GM. Use of plasma and brain unbound fractions to assess the extent of brain distribution of 34 drugs: comparison of unbound concentration ratios to in vivo p-glycoprotein efflux ratios. Drug Metab Dispos. 2007;35:660–6. doi: 10.1124/dmd.106.012294. [DOI] [PubMed] [Google Scholar]
- 39.Smith DA, Di L, Kerns EH. The effect of plasma protein binding on in vivo efficacy: misconceptions in drug discovery. Nat Rev Drug Discov. 2010;9:929–39. doi: 10.1038/nrd3287. [DOI] [PubMed] [Google Scholar]
- 40.Kikuchi R, de Morais SM, Kalvass JC. In vitro P-glycoprotein efflux ratio can predict the in vivo brain penetration regardless of biopharmaceutics drug disposition classification system class. Drug Metab Dispos. 2013;41:2012–7. doi: 10.1124/dmd.113.053868. [DOI] [PubMed] [Google Scholar]
- 41.Tunblad K, Hammarlund-Udenaes M, Jonsson EN. An integrated model for the analysis of pharmacokinetic data from microdialysis experiments. Pharm Res. 2004;21:1698–707. doi: 10.1023/b:pham.0000041468.00587.c6. [DOI] [PubMed] [Google Scholar]
- 42.Friden M, Gupta A, Antonsson M, Bredberg U, Hammarlund-Udenaes M. In vitro methods for estimating unbound drug concentrations in the brain interstitial and intracellular fluids. Drug Metab Dispos. 2007;35:1711–9. doi: 10.1124/dmd.107.015222. [DOI] [PubMed] [Google Scholar]
- 43.Kalvass JC, Maurer TS. Influence of nonspecific brain and plasma binding on CNS exposure: implications for rational drug discovery. Biopharm Drug Dispos. 2002;23:327–38. doi: 10.1002/bdd.325. [DOI] [PubMed] [Google Scholar]
- 44.Friden M, Ducrozet F, Middleton B, Antonsson M, Bredberg U, Hammarlund-Udenaes M. Development of a high-throughput brain slice method for studying drug distribution in the central nervous system. Drug Metab Dispos. 2009;37:1226–33. doi: 10.1124/dmd.108.026377. [DOI] [PubMed] [Google Scholar]
- 45.Rowland LP. Blood-brain barrier, cerebrospinal fluid, brain edema, and hydrocephalus. In: Kandel ER, Schwartz JH, editors. Principles of Neural Science. 2nd. New York: Elsevier Science Publishing; 1985. pp. 837–844. [Google Scholar]
- 46.Westerhout J, Smeets J, Danhof M, de Lange EC. The impact of P-gp functionality on non-steady state relationships between CSF and brain extracellular fluid. J Pharmacokinet Pharmacodyn. 2013;40:327–42. doi: 10.1007/s10928-013-9314-4. [DOI] [PMC free article] [PubMed] [Google Scholar]
- 47.Pardridge WM. Drug transport across the blood-brain barrier. J Cereb Blood Flow Metab. 2012;32:1959–72. doi: 10.1038/jcbfm.2012.126. [DOI] [PMC free article] [PubMed] [Google Scholar]
- 48.de Lange EC, Danhof M. Considerations in the use of cerebrospinal fluid pharmacokinetics to predict brain target concentrations in the clinical setting: implications of the barriers between blood and brain. Clin Pharmacokinet. 2002;41:691–703. doi: 10.2165/00003088-200241100-00001. [DOI] [PubMed] [Google Scholar]
- 49.Shen DD, Artru AA, Adkison KK. Principles and applicability of CSF sampling for the assessment of CNS drug delivery and pharmacodynamics. Adv Drug Deliv Rev. 2004;56:1825–57. doi: 10.1016/j.addr.2004.07.011. [DOI] [PubMed] [Google Scholar]
- 50.Friden M, Winiwarter S, Jerndal G, Bengtsson O, Wan H, Bredberg U, et al. Structure-brain exposure relationships in rat and human using a novel data set of unbound drug concentrations in brain interstitial and cerebrospinal fluids. J Med Chem. 2009;52:6233–43. doi: 10.1021/jm901036q. [DOI] [PubMed] [Google Scholar]
- 51.Wu CY, Benet LZ. Predicting drug disposition via application of BCS: transport/absorption/elimination interplay and development of a biopharmaceutics drug disposition classification system. Pharm Res. 2005;22:11–23. doi: 10.1007/s11095-004-9004-4. [DOI] [PubMed] [Google Scholar]
- 52.Custodio JM, Wu CY, Benet LZ. Predicting drug disposition, absorption/elimination/transporter interplay and the role of food on drug absorption. Adv Drug Deliv Rev. 2008;60:717–33. doi: 10.1016/j.addr.2007.08.043. [DOI] [PMC free article] [PubMed] [Google Scholar]
- 53.Benet LZ. Predicting drug disposition via application of a Biopharmaceutics Drug Disposition Classification System. Basic Clin Pharmacol Toxicol. 2010;106:162–7. doi: 10.1111/j.1742-7843.2009.00498.x. [DOI] [PMC free article] [PubMed] [Google Scholar]
- 54.Broccatelli F, Larregieu CA, Cruciani G, Oprea TI, Benet LZ. Improving the prediction of the brain disposition for orally administered drugs using BDDCS. Adv Drug Deliv Rev. 2012;64:95–109. doi: 10.1016/j.addr.2011.12.008. [DOI] [PMC free article] [PubMed] [Google Scholar]
- 55.Cummins CL, Jacobsen W, Benet LZ. Unmasking the dynamic interplay between intestinal P-glycoprotein and CYP3A4. J Pharmacol Exp Ther. 2002;300:1036–45. doi: 10.1124/jpet.300.3.1036. [DOI] [PubMed] [Google Scholar]
- 56.Sasongko L, Link JM, Muzi M, Mankoff DA, Yang X, Collier AC, et al. Imaging P-glycoprotein transport activity at the human blood-brain barrier with positron emission tomography. Clin Pharmacol Ther. 2005;77:503–14. doi: 10.1016/j.clpt.2005.01.022. [DOI] [PubMed] [Google Scholar]
- 57.Li H, Yap CW, Ung CY, Xue Y, Cao ZW, Chen YZ. Effect of selection of molecular descriptors on the prediction of blood-brain barrier penetrating and nonpenetrating agents by statistical learning methods. J Chem Inf Model. 2005;45:1376–84. doi: 10.1021/ci050135u. [DOI] [PubMed] [Google Scholar]
- 58.Benet LZ, Broccatelli F, Oprea TI. BDDCS applied to over 900 drugs. AAPS J. 2011;13:519–47. doi: 10.1208/s12248-011-9290-9. [DOI] [PMC free article] [PubMed] [Google Scholar]
- 59.Poirier A, Cascais AC, Bader U, Portmann R, Brun ME, Walter I, et al. Calibration of in vitro MDR1 substrate and inhibition assays as a basis to support the prediction of clinically relevant interactions in vivo. Drug Metab Dispos. 2014;42:1411–22. doi: 10.1124/dmd.114.057943. [DOI] [PubMed] [Google Scholar]
- 60.Shugarts S, Benet LZ. The role of transporters in the pharmacokinetics of orally administered drugs. Pharm Res. 2009;26:2039–54. doi: 10.1007/s11095-009-9924-0. [DOI] [PMC free article] [PubMed] [Google Scholar]
- 61.Letendre SL, Capparelli EV, Ellis RJ, McCutchan JA. Indinavir population pharmacokinetics in plasma and cerebrospinal fluid. The HIV Neurobehavioral Research Center Group. Antimicrob Agents Chemother. 2000;44:2173–5. doi: 10.1128/aac.44.8.2173-2175.2000. [DOI] [PMC free article] [PubMed] [Google Scholar]
- 62.Benet LZ, Cummins CL, Wu CY. Unmasking the dynamic interplay between efflux transporters and metabolic enzymes. Int J Pharm. 2004;277:3–9. doi: 10.1016/j.ijpharm.2002.12.002. [DOI] [PubMed] [Google Scholar]
- 63.Dutheil F, Beaune P, Loriot MA. Xenobiotic metabolizing enzymes in the central nervous system: Contribution of cytochrome P450 enzymes in normal and pathological human brain. Biochimie. 2008;90:426–36. doi: 10.1016/j.biochi.2007.10.007. [DOI] [PubMed] [Google Scholar]
- 64.Young RC, Mitchell RC, Brown TH, Ganellin CR, Griffiths R, Jones M, et al. Development of a new physicochemical model for brain penetration and its application to the design of centrally acting H2 receptor histamine antagonists. J Med Chem. 1988;31:656–71. doi: 10.1021/jm00398a028. [DOI] [PubMed] [Google Scholar]
- 65.Calder JA, Ganellin CR. Predicting the brain-penetrating capability of histaminergic compounds. Drug Des Discov. 1994;11:259–68. [PubMed] [Google Scholar]
- 66.Norinder U, Haeberlein M. Computational approaches to the prediction of the blood-brain distribution. Adv Drug Deliv Rev. 2002;54:291–313. doi: 10.1016/s0169-409x(02)00005-4. [DOI] [PubMed] [Google Scholar]
- 67.Liu X, Tu M, Kelly RS, Chen C, Smith BJ. Development of a computational approach to predict blood-brain barrier permeability. Drug Metab Dispos. 2004;32:132–9. doi: 10.1124/dmd.32.1.132. [DOI] [PubMed] [Google Scholar]
- 68.Pajouhesh H, Lenz GR. Medicinal chemical properties of successful central nervous system drugs. NeuroRx. 2005;2:541–53. doi: 10.1602/neurorx.2.4.541. [DOI] [PMC free article] [PubMed] [Google Scholar]
- 69.Broccatelli F, Cruciani G, Benet LZ, Oprea TI. BDDCS class prediction for new molecular entities. Mol Pharm. 2012;9:570–80. doi: 10.1021/mp2004302. [DOI] [PMC free article] [PubMed] [Google Scholar]
- 70.Nicolazzo JA, Charman SA, Charman WN. Methods to assess drug permeability across the blood-brain barrier. J Pharm Pharmacol. 2006;58:281–93. doi: 10.1211/jpp.58.3.0001. [DOI] [PubMed] [Google Scholar]
- 71.Kansy M, Senner F, Gubernator K. Physicochemical high throughput screening: parallel artificial membrane permeation assay in the description of passive absorption processes. J Med Chem. 1998;41:1007–10. doi: 10.1021/jm970530e. [DOI] [PubMed] [Google Scholar]
- 72.Di L, Kerns EH, Fan K, McConnell OJ, Carter GT. High throughput artificial membrane permeability assay for blood-brain barrier. Eur J Med Chem. 2003;38:223–32. doi: 10.1016/s0223-5234(03)00012-6. [DOI] [PubMed] [Google Scholar]
- 73.Mensch J, Jaroskova L, Sanderson W, Melis A, Mackie C, Verreck G, et al. Application of PAMPA-models to predict BBB permeability including efflux ratio, plasma protein binding and physicochemical parameters. Int J Pharm. 2010;395:182–97. [PubMed] [Google Scholar]
- 74.Feng B, Mills JB, Davidson RE, Mireles RJ, Janiszewski JS, Troutman MD, et al. In vitro P-glycoprotein assays to predict the in vivo interactions of P-glycoprotein with drugs in the central nervous system. Drug Metab Dispos. 2008;36:268–75. doi: 10.1124/dmd.107.017434. [DOI] [PubMed] [Google Scholar]
- 75.Jhala DD, Chettiar SS, Singh JK. Optimization and validation of an in vitro blood brain barrier permeability assay using artiicial lipid membrane. Journal of Bioequivalence & Bioavailability. 2012 doi: 10.4172/jbb.S14-009. [DOI] [Google Scholar]
- 76.Summerfield SG, Read K, Begley DJ, Obradovic T, Hidalgo IJ, Coggon S, et al. Central nervous system drug disposition: the relationship between in situ brain permeability and brain free fraction. J Pharmacol Exp Ther. 2007;322:205–13. doi: 10.1124/jpet.107.121525. [DOI] [PubMed] [Google Scholar]
- 77.Wang Q, Rager JD, Weinstein K, Kardos PS, Dobson GL, Li J, et al. Evaluation of the MDR-MDCK cell line as a permeability screen for the blood-brain barrier. Int J Pharm. 2005;288:349–59. doi: 10.1016/j.ijpharm.2004.10.007. [DOI] [PubMed] [Google Scholar]
- 78.Mahar Doan KM, Humphreys JE, Webster LO, Wring SA, Shampine LJ, Serabjit-Singh CJ, et al. Passive permeability and P-glycoprotein-mediated efflux differentiate central nervous system (CNS) and non-CNS marketed drugs. J Pharmacol Exp Ther. 2002;303:1029–37. doi: 10.1124/jpet.102.039255. [DOI] [PubMed] [Google Scholar]
- 79.Wager TT, Chandrasekaran RY, Hou X, Troutman MD, Verhoest PR, Villalobos A, et al. Defining desirable central nervous system drug space through the alignment of molecular properties, in vitro ADME, and safety attributes. ACS Chem Neurosci. 2010;1:420–34. doi: 10.1021/cn100007x. [DOI] [PMC free article] [PubMed] [Google Scholar]
- 80.Carrara S, Reali V, Misiano P, Dondio G, Bigogno C. Evaluation of in vitro brain penetration: optimized PAMPA and MDCKII-MDR1 assay comparison. Int J Pharm. 2007;345:125–33. doi: 10.1016/j.ijpharm.2007.05.057. [DOI] [PubMed] [Google Scholar]
- 81.O’Brien FE, O’Connor RM, Clarke G, Dinan TG, Griffin BT, Cryan JF. P-glycoprotein inhibition increases the brain distribution and antidepressant-like activity of escitalopram in rodents. Neuropsychopharmacology. 2013;38:2209–19. doi: 10.1038/npp.2013.120. [DOI] [PMC free article] [PubMed] [Google Scholar]
- 82.O’Brien FE, Clarke G, Dinan TG, Cryan JF, Griffin BT. Human P-glycoprotein differentially affects antidepressant drug transport: relevance to blood-brain barrier permeability. Int J Neuropsychopharmacol. 2013;16:2259–72. doi: 10.1017/S1461145713000692. [DOI] [PubMed] [Google Scholar]
- 83.Polli JW, Wring SA, Humphreys JE, Huang L, Morgan JB, Webster LO, et al. Rational use of in vitro P-glycoprotein assays in drug discovery. J Pharmacol Exp Ther. 2001;299:620–8. [PubMed] [Google Scholar]
- 84.Schinkel AH, Smit JJ, van Tellingen O, Beijnen JH, Wagenaar E, van Deemter L, et al. Disruption of the mouse mdr1a P-glycoprotein gene leads to a deficiency in the blood-brain barrier and to increased sensitivity to drugs. Cell. 1994;77:491–502. doi: 10.1016/0092-8674(94)90212-7. [DOI] [PubMed] [Google Scholar]
- 85.Uhr M, Grauer MT, Holsboer F. Differential enhancement of antidepressant penetration into the brain in mice with abcb1ab (mdr1ab) P-glycoprotein gene disruption. Biol Psychiatry. 2003;54(8):840–6. doi: 10.1016/s0006-3223(03)00074-x. [DOI] [PubMed] [Google Scholar]
- 86.Grauer MT, Uhr M. P-glycoprotein reduces the ability of amitriptyline metabolites to cross the blood brain barrier in mice after a 10-day administration of amitriptyline. J Psychopharmacol. 2004;18:66–74. doi: 10.1177/0269881104042831. [DOI] [PubMed] [Google Scholar]
- 87.Uhr M, Tontsch A, Namendorf C, Ripke S, Lucae S, Ising M, et al. Polymorphisms in the drug transporter gene ABCB1 predict antidepressant treatment response in depression. Neuron. 2008;57:203–9. doi: 10.1016/j.neuron.2007.11.017. [DOI] [PubMed] [Google Scholar]
- 88.Uhr M, Grauer MT, Yassouridis A, Ebinger M. Blood-brain barrier penetration and pharmacokinetics of amitriptyline and its metabolites in p-glycoprotein (abcb1ab) knock-out mice and controls. J Psychiatr Res. 2007;41:179–88. doi: 10.1016/j.jpsychires.2005.10.005. [DOI] [PubMed] [Google Scholar]
- 89.Liu X, Cheong J, Ding X, Deshmukh G. Use of cassette dosing approach to examine the effects of P-glycoprotein on the brain and cerebrospinal fluid concentrations in wild-type and P-glycoprotein knockout rats. Drug Metab Dispos. 2014;42:482–91. doi: 10.1124/dmd.113.055590. [DOI] [PubMed] [Google Scholar]
- 90.Lombardo F, Obach RS, Shalaeva MY, Gao F. Prediction of human volume of distribution values for neutral and basic drugs. 2. Extended data set and leave-class-out statistics. J Med Chem. 2004;47:1242–50. doi: 10.1021/jm030408h. [DOI] [PubMed] [Google Scholar]
- 91.Mateus A, Matsson P, Artursson P. A high-throughput cell-based method to predict the unbound drug fraction in the brain. J Med Chem. 2014;57:3005–10. doi: 10.1021/jm401963n. [DOI] [PMC free article] [PubMed] [Google Scholar]
- 92.Maurer TS, Debartolo DB, Tess DA, Scott DO. Relationship between exposure and nonspecific binding of thirty-three central nervous system drugs in mice. Drug Metab Dispos. 2005;33:175–81. doi: 10.1124/dmd.104.001222. [DOI] [PubMed] [Google Scholar]
- 93.Potter WZ, Muscettola G, Goodwin FK. Binding of imipramine to plasma protein and to brain tissue: relationship to CSF tricyclic levels in man. Psychopharmacology. 1979;63:187–92. doi: 10.1007/BF00429700. [DOI] [PubMed] [Google Scholar]
- 94.Cisternino S, Mercier C, Bourasset F, Roux F, Scherrmann JM. Expression, up-regulation, and transport activity of the multidrug-resistance protein Abcg2 at the mouse blood-brain barrier. Cancer Res. 2004;64:3296–301. doi: 10.1158/0008-5472.can-03-2033. [DOI] [PubMed] [Google Scholar]
- 95.Agarwal S, Uchida Y, Mittapalli RK, Sane R, Terasaki T, Elmquist WF. Quantitative proteomics of transporter expression in brain capillary endothelial cells isolated from P-glycoprotein (P-gp), breast cancer resistance protein (Bcrp), and P-gp/Bcrp knockout mice. Drug Metab Dispos. 2012;40:1164–9. doi: 10.1124/dmd.112.044719. [DOI] [PMC free article] [PubMed] [Google Scholar]
- 96.Giacomini KM, Huang SM, Tweedie DJ, Benet LZ, Brouwer KL, et al. Membrane transporters in drug development. Nat Rev Drug Discov. 2010;9:215–36. doi: 10.1038/nrd3028. [DOI] [PMC free article] [PubMed] [Google Scholar]
- 97.Lee JY, Lee SY, Lee K, Oh SJ, Kim SK. Determination of species-difference in microsomal metabolism of amitriptyline using a predictive MRM-IDA-EPI method. Chem Biol Interact. 2015;229:109–18. doi: 10.1016/j.cbi.2015.01.024. [DOI] [PubMed] [Google Scholar]
- 98.Hsiao P, Sasongko L, Link JM, Mankoff DA, Muzi M, Collier AC, et al. Verapamil P-glycoprotein transport across the rat blood-brain barrier: cyclosporine, a concentration inhibition analysis, and comparison with human data. J Pharmacol Exp Ther. 2006;317:704–10. doi: 10.1124/jpet.105.097931. [DOI] [PubMed] [Google Scholar]
- 99.Wulkersdorfer B, Wanek T, Bauer M, Zeitlinger M, Muller M, Langer O. Using positron emission tomography to study transporter-mediated drug-drug interactions in tissues. Clin Pharmacol Ther. 2014;96:206–13. doi: 10.1038/clpt.2014.70. [DOI] [PMC free article] [PubMed] [Google Scholar]
- 100.Clarke G, O’Mahony SM, Cryan JF, Dinan TG. Verapamil in treatment resistant depression: a role for the P-glycoprotein transporter? Hum Psychopharmacol. 2009;24:217–23. doi: 10.1002/hup.1008. [DOI] [PubMed] [Google Scholar]
- 101.Ejsing TB, Linnet K. Influence of P-glycoprotein inhibition on the distribution of the tricyclic antidepressant nortriptyline over the blood-brain barrier. Hum Psychopharmacol. 2005;20:149–53. doi: 10.1002/hup.667. [DOI] [PubMed] [Google Scholar]
- 102.Kamiie J, Ohtsuki S, Iwase R, Ohmine K, Katsukura Y, Yanai K, et al. Quantitative atlas of membrane transporter proteins: development and application of a highly sensitive simultaneous LC/MS/MS method combined with novel in-silico peptide selection criteria. Pharm Res. 2008;25:1469–83. doi: 10.1007/s11095-008-9532-4. [DOI] [PubMed] [Google Scholar]
- 103.Uchida Y, Ohtsuki S, Kamiie J, Terasaki T. Blood-brain barrier (BBB) pharmacoproteomics: reconstruction of in vivo brain distribution of 11 P-glycoprotein substrates based on the BBB transporter protein concentration, in vitro intrinsic transport activity, and unbound fraction in plasma and brain in mice. J Pharmacol Exp Ther. 2011;339:579–88. doi: 10.1124/jpet.111.184200. [DOI] [PubMed] [Google Scholar]
- 104.Di L, Umland JP, Chang G, Huang Y, Lin Z, Scott DO, et al. Species independence in brain tissue binding using brain homogenates. Drug Metab Dispos. 2011;39:1270–7. doi: 10.1124/dmd.111.038778. [DOI] [PubMed] [Google Scholar]
- 105.Cutler L, Howes C, Deeks NJ, Buck TL, Jeffrey P. Development of a P-glycoprotein knockout model in rodents to define species differences in its functional effect at the blood-brain barrier. J Pharm Sci. 2006;95:1944–53. doi: 10.1002/jps.20658. [DOI] [PubMed] [Google Scholar]
- 106.Suzuyama N, Katoh M, Takeuchi T, Yoshitomi S, Higuchi T, Asashi S, et al. Species differences of inhibitory effects on P-glycoprotein-mediated drug transport. J Pharm Sci. 2007;96:1609–18. doi: 10.1002/jps.20787. [DOI] [PubMed] [Google Scholar]
- 107.Karlsson L, Green H, Zackrisson AL, Bengtsson F, Jakobsen Falk I, Carlsson B, et al. ABCB1 gene polymorphisms are associated with fatal intoxications involving venlafaxine but not citalopram. Int J Legal Med. 2013;127:579–86. doi: 10.1007/s00414-013-0849-0. [DOI] [PubMed] [Google Scholar]
- 108.Kato M, Fukuda T, Serretti A, Wakeno M, Okugawa G, Ikenaga Y, et al. ABCB1 (MDR1) gene polymorphisms are associated with the clinical response to paroxetine in patients with major depressive disorder. Prog Neuropsychopharmacol Biol Psychiatry. 2008;32:398–404. doi: 10.1016/j.pnpbp.2007.09.003. [DOI] [PubMed] [Google Scholar]
- 109.Gex-Fabry M, Eap CB, Oneda B, Gervasoni N, Aubry JM, Bondolfi G, et al. CYP2D6 and ABCB1 genetic variability: influence on paroxetine plasma level and therapeutic response. Ther Drug Monit. 2008;30:474–482. doi: 10.1097/FTD.0b013e31817d6f5d. [DOI] [PubMed] [Google Scholar]
- 110.Roberts RL, Joyce PR, Mulder RT, Begg EJ, Kennedy MA. A common P-glycoprotein polymorphism is associated with nortriptyline-induced postural hypotension in patients treated formajor depression. Pharmacogenomics J. 2002;2:191–6. doi: 10.1038/sj.tpj.6500099. [DOI] [PubMed] [Google Scholar]
- 111.Sjostedt N, Kortejarvi H, Kidron H, Vellonen KS, Urtti A, Yliperttula M. Challenges of using in vitro data for modeling P-glycoprotein efflux in the blood-brain barrier. Pharm Res. 2014;31:1–19. doi: 10.1007/s11095-013-1124-2. [DOI] [PubMed] [Google Scholar]
- 112.Di L, Whitney-Pickett C, Umland JP, Zhang H, Zhang X, Gebhard DF, et al. Development of a new permeability assay using low-efflux MDCKII cells. J Pharm Sci. 2011;100:4974–85. doi: 10.1002/jps.22674. [DOI] [PubMed] [Google Scholar]
- 113.de Souza J, Benet LZ, Huang Y, Storpirtis S. Comparison of bidirectional lamivudine and zidovudine transport using MDCK, MDCK-MDR1, and Caco-2 cell monolayers. J Pharm Sci. 2009;98:4413–9. doi: 10.1002/jps.21744. [DOI] [PubMed] [Google Scholar]
- 114.Bart J, Willemsen AT, Groen HJ, van der Graaf WT, Wegman TD, Vaalburg W, et al. Quantitative assessment of P-glycoprotein function in the rat blood-brain barrier by distribution volume of [11C]verapamil measured with PET. NeuroImage. 2003;20:1775–82. doi: 10.1016/s1053-8119(03)00405-1. [DOI] [PubMed] [Google Scholar]
- 115.Hendrikse NH, Schinkel AH, de Vries EG, Fluks E, Van der Graaf WT, Willemsen AT, et al. Complete in vivo reversal of P-glycoprotein pump function in the blood-brain barrier visualized with positron emission tomography. Br J Pharmacol. 1998;124:1413–8. doi: 10.1038/sj.bjp.0701979. [DOI] [PMC free article] [PubMed] [Google Scholar]
- 116.Kalvass JC, Polli JW, Bourdet DL, Feng B, Huang SM, Liu X, et al. Why clinical modulation of efflux transport at the human blood-brain barrier is unlikely: the ITC evidence-based position. Clin Pharmacol Ther. 2013;94:80–94. doi: 10.1038/clpt.2013.34. [DOI] [PubMed] [Google Scholar]
- 117.Sugimoto H, Matsumoto S, Tachibana M, Niwa S, Hirabayashi H, Amano N, et al. Establishment of in vitro P-glycoprotein inhibition assay and its exclusion criteria to assess the risk of drug-drug interaction at the drug discovery stage. J Pharm Sci. 2011;100:4013–23. doi: 10.1002/jps.22652. [DOI] [PubMed] [Google Scholar]
- 118.Sugano K, Kansy M, Artursson P, Avdeef A, Bendels S, Di L, et al. Coexistence of passive and carrier-mediated processes in drug transport. Nat Rev Drug Discov. 2010;9:597–614. doi: 10.1038/nrd3187. [DOI] [PubMed] [Google Scholar]
- 119.Summerfield SG, Stevens AJ, Cutler L, del Carmen Osuna M, Hammond B, Tang SP, et al. Improving the in vitro prediction of in vivo central nervous system penetration: integrating permeability, P-glycoprotein efflux, and free fractions in blood and brain. J Pharmacol Exp Ther. 2006;316:1282–90. doi: 10.1124/jpet.105.092916. [DOI] [PubMed] [Google Scholar]