

Abstract
Single-molecule measurements of rotation catalyzed by the F1-ATPase or the FoF1 ATP synthase have provided new insights into the molecular mechanisms of the F1 and Fo molecular motors. We recently developed a method to record ATPase-driven rotation of F1 or FoF1 in a manner that solves several technical limitations of earlier approaches that were significantly hampered by time and angular resolution, and restricted the duration of data collection. With our approach it is possible to collect data for hours and obtain statistically significant quantities of data on each molecule examined with a time resolution of up to 5 μs at unprecedented signal-to-noise.
Keywords: F1-ATPase, FoF1 ATP synthase, Nanodiscs, Gold nanorods, Plasmon resonance, Molecular motors, Dark field microscopy, Single molecule
1. Introduction
The FoF1 ATP synthase is composed of two opposed rotary molecular motors connected by a common axle of γε-subunits (1). The integral membrane Fo motor, which has a subunit stoichiometry of ab2c10 in E. coli (2), uses the electrochemical potential-driven flux of protons across a membrane (proton-motive force or PMF) to drive clockwise rotation of the ring of ten c-subunits as viewed from the periplasm (3). The c-ring is docked to the γε-subunits that extend into the hexameric ring of α and β subunits in the F1 peripheral membrane motor. Rotation of this axle drives conformational changes in each of the three catalytic αβ heterodimers resulting in ATP synthesis (4). The F1 motor can also hydrolyze ATP resulting in counterclockwise γε-subunit rotation and proton translocation via Fo (3). When solubilized away from Fo and the membrane, E. coli F1-ATPase-driven rotation at saturating ATP concentrations occurs in three 120° power strokes (5–7), separated by 8.3 ms dwells comparable to the turnover time of the rate-limiting step of ATP hydrolysis (6, 8).
The sequential dwell positions of single molecules of F1 or FoF1 can be tracked as a function of time through the use of single molecule FRET, or by attaching either micrometer-long actin filaments or nanoscale spheres to the rotor. However, these studies have been significantly hampered by the limited time and angular resolution of the measurements as well as the sampling duration. Consequently, the ability to obtain statistically significant measurements of rotational velocity and position has been severely limited. We recently developed a method to record ATPase-driven rotation of F1 or FoF1 in a manner that solves these problems. With this approach it is possible to collect data for hours and obtain statistically significant quantities of data on each molecule examined with a time resolution of up to 5 μs at unprecedented signal-to-noise.
This rotation assay exploits the optical properties of gold nanorods to make sensitive measurements of rotational position. When viewed using dark-field microscopy, a 75 × 35 nm nanorod resonantly scatters red and green light from the long and short axis of the rod, respectively (9). Since the sample is illuminated at an oblique angle, only light scattered from the nanorod is observed. When viewed through a polarizing filter, the intensity of scattered light from a nanorod changes as a function of the relative angle between the nanorod axis and the polarizing filter (10). The intensity of scattered red light from a nanorod is maximal and minimal when the long and short axes of the rod are parallel and orthonormal to the plane of polarization, respectively, because the intensity of scattered light changes as a sinusoidal function relative to the orientation of the polarizer (Fig. 1).
Fig. 1.
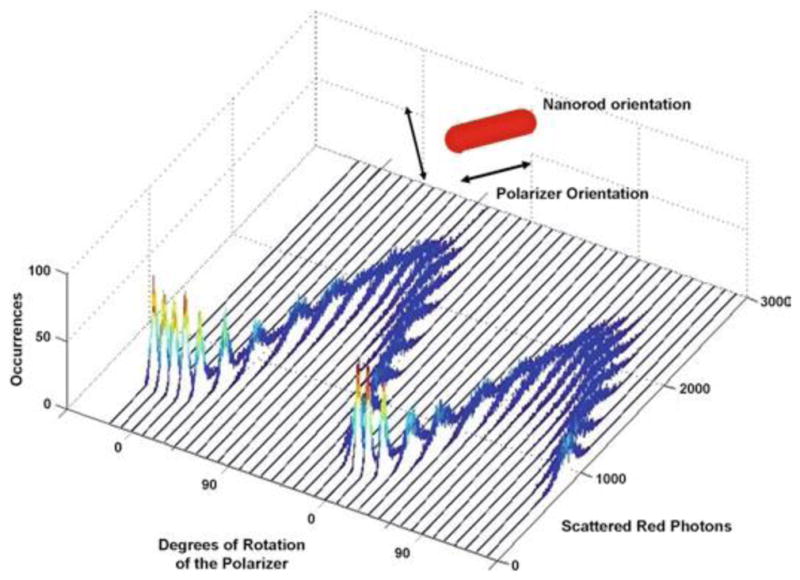
Histograms of the intensity of red light scattered from a single nonrotating nanorod fixed to a slide as a function of the rotational position of the polarizer. Each histogram contains 3,520 measurements at each position of the polarizer obtained with the data acquisition speeds used to collect data points for c-ring rotation. The polarizer was then rotated counterclockwise by 10° and data collection was repeated.
The converse is true for the intensity of scattered green light such that a nanorod attached to the rotating shaft of the molecular motor appears to blink red and green when viewed through a polarizing filter. Using this approach to measure rotation of E. coli F1-ATPase, we determined that the velocity of the power stroke is ~0.5°μs−1 (6). We have also been able to resolve the formation of 50–200 μs transient dwells that form as the result of an interaction of the Fo rotor and stator in FoF1, which had been incorporated into lipid nanodiscs for stabilization (11). The behavior of these transient dwells is consistent with a role in the Fo Brownian ratchet mechanism where c-ring rotation is limited to 36°.
2. Materials
2.1. Preparation of F1 and FOF1 -Nanodiscs (n-FOF1)
Buffer A: 100 mM KCl, 5 mM MgCl2, 0.1 mM EDTA, 2.5% (v/v) glycerol, and 200 mM Tris–HCl, pH 8.0.
Buffer B: 5.0 mM TES, pH 7, 40 mM ε-amino-caproic acid, 1 mM EDTA, 1 mM DTT, 5.0% (v/v) glycerol.
Buffer C: 1 M KCl, 300 mM imidazole, 50 mM MgCl2, and 0.5 M Tris–HCl, pH 8.0.
Buffer D: 100 mM KCl, 30 mM imidazole, 5 mM MgCl2,15% (v/v) glycerol, and 50 mM Tris–HCl, pH 8.0.
Buffer E: 100 mM NaCl, 40 mM ε-aminocaproic acid, 15 mM p-aminobenzamidine, 5 mM MgCl2, 0.03% (w/v) phosphatidylcholine, 1.0% (w/v) octyl glucopyranoside, 0.5% (w/v) sodium deoxycholate, 0.5% (w/v) sodium cholate, 6% (v/v) glycerol, 30 mM imidazole, and 50 mM Tris–HCl, pH 8.0.
Buffer F: 100 mM NaCl, 4 mM 4-aminobenzamidine, 5 mM MgCl2, 5% (v/v) glycerol, and 50 mM Tris–HCl, pH 8.0.
Ni-NTA column packing material.
Biotin maleimide for covalent modification of the target sulfydryl on F1 and FoF1.
Membrane scaffold protein construct MSP1E3D1. Prof. Steven Sligar at UIUC has made a strain available upon request that expresses MSP1E3D1 containing a cleavable his-tag (see Note 1).
TEV protease to cleave the his-tag from MSP1E3D1.
2.2. Preparation of Gold Nanorods
Gold nanorods are commercially available from Nanopartz (USA).
Cetyltrimethylammonium bromide (CTAB).
Neutravidin.
Modified bovine serum albumin (BSA-c).
2.3. Assembly of Components on a Microscope Slide and Single Molecule Assays
Assembly Buffer: 10 mM KCl and 50 mM Tris–HCl, pH 8.0.
Rotation Buffer: 1 mM MgCl2 and 2 mM ATP, 10 mM KCl, and 50 mM Tris–HCl, pH 8.0 that sometimes contains a specified amount of PEG400.
2.4. Microscopy, Data Acquisition, and Analysis
Ni-NTA-coated glass microscope slides and glass cover slips.
An inverted dark-field microscope mounted on an optical bench. A Sutter LB-17 Xenon light with a custom Chroma cold mirror coupled with a series 2000 Lumatec light guide to deliver 400–925 nm, collimated light to the sample through the dark-field condenser.
An iris in the 63× variable aperture objective to block light not scattered by a gold nanorod. A digital color camera with a refresh rate of ~53 fps mounted to a port of the microscope that contains a polarizing filter to detect the fluctuation of red and green light scattered from the gold nanorods.
A motorized microscope stage with 0.002 μm/microstep resolution on which the slide is mounted.
A 100-μm pinhole mounted on an optical bench via an xyz translation stage at an alternate port from the microscope from that to which the color camera is mounted. Light passing through the pinhole is directed through a high-pass filter with a 600-nm cutoff as well as a polarizing filter mounted on a rotational stage, and is focused by a lens onto a single photon counting avalanche photodiode detector. The detector has a dark count of ~50 photons/s with a temporal resolution of 50 ns, equivalent to 20 million frames/s. The optics of the microscope are aligned so that the light from the sample that is incident upon the detector and the color camera are confocal. Output from the detector is fed directly into a counter/timer board in a computer with sufficient memory and processing speed to handle the large data files that are rapidly generated during data acquisition.
In an optional configuration (Fig. 2), a nonpolarizing beam splitter is inserted between the high-pass filter and the polarizer. A second polarizer is mounted on a rotational stage between the split beam and a second single photon counter. The polarization angle of the second polarizer is offset by a known amount from the first polarizer.
Fig. 2.

Schematic of the dark-field microscope used to make the measurements. In this configuration, the scattered light from a single rotating gold nanorod (dashed line) passes through a beam splitter for measurement by two single photon counting avalanche photodiode detectors when the orientation of the polarizer for detector 1 is offset from that of detector 2.
3. Methods
3.1. Preparation of F1 Protein
The F1-ATPase containing a His6-tag on the N terminus of the β-subunit and γS193C was expressed and purified from E. coli XL-10 strain (12, 13). Cells were grown with shaking at 37°C in 1 L of LB medium with 50 μg/ml of ampicillin. About 4–5 g wet weight of bacteria was harvested by centrifugation at 7,700 × g for 15 min at 4°C and stored as cell pellets at −80°C. Cell pellets, thawed at 25°C, were immediately resuspended in Buffer A, and the cells were broken using a French press at 16,000 psi. Unbroken cells were collected as a pellet at 7,700 × g for 15 min at 4°C and discarded.
Membranes were resuspended in Buffer B, and centrifuged at 180,000 × g for 1 h at 4°C. All subsequent steps were performed at 23°C. The supernatant was mixed with Buffer C at a 10:1 (v/v) ratio. Glycerol was added to 15% (v/v), and the mixture was put on a Ni-NTA column (0.8 cm diameter, 1.5 ml of resin) washed initially with water and equilibrated with Buffer D to bind F1-ATPase to the column, and the column was washed with 20 ml of Buffer D. An excess of biotin maleimide was dissolved in 3 ml of Buffer D, which was used to wash the Ni-NTA column containing bound F1-ATPase. After a wash with 10 ml of Buffer D, biotinylated F1-ATPase was eluted with 3 ml of Buffer D containing 180 mM imidazole, then stored at 0.1 mg/ml at 80°C prior to use.
3.2. Preparation of FOF1 Protein Incorporated into Nanodiscs (n-FOF1)
Purified FoF1 that was cysteine-free except for the cysteine resulting from the c2∇C insertion was expressed and purified using the DK8 unc operon deletion strain of E. coli (14) containing the plasmid pNCcys. Cells were grown with shaking at 37°C in 6 L of LB medium with 50 μg/ml of ampicillin. About 25 g wet weight of bacteria was harvested by centrifugation at 7,700 × g for 15 min at 4°C and stored as cell pellets at 80°C. Cell pellets thawed at 25°C were immediately resuspended in Buffer A, and the cells were broken using a French press at 16,000 psi. Unbroken cells were collected as a pellet at 7,700 × g for 15 min at 4°C and discarded.
All subsequent steps were performed at 4°C. The supernatant fraction containing membrane vesicles was centrifuged at 184,000 × g for 2–3 h. The pellet of membranes containing FOF1 was resuspended in Buffer E. About 5 ml of Buffer E was added to 1 g of membranes, which was shaken for 90 min at 4°C, then centrifuged at 184,000 × g for 2 h. The supernatant was applied to a Ni-NTA column containing 1.5 ml of resin equilibrated with Buffer E. The resin containing bound FoF1 was washed with about 20 ml of Buffer E, and FoF1 was eluted with 3 ml of Buffer E containing 180 mM imidazole. After determination of protein concentration, the solubilized FoF1 was immediately incorporated into nanodiscs (11).
-
The His-tag of the purified membrane scaffold protein MSP-1E3D1 was cleaved by overnight incubation with TEV protease (at 25:1 ratio, w/w) at 25°C and passed through a Ni-NTA column. To assemble n-FoF1, MSP was mixed in Buffer F with 10% sodium cholate in Buffer F, and FoF1 in Buffer E to achieve a 1:5.3 molar ratio of FoF1:MSP in 1% sodium cholate with afinal volume not exceeding 1 ml, and adjusted with Buffer F.
To make biotinylated n-FoF1 a tenfold molar excess of biotin maleimide was added to this mixture. The mixture was incubated at 4°C for 15 min with gentle shaking, then passed through a 2-ml Sephadex G-50 column equilibrated with Buffer F from which 2.5 ml of effluent were collected. The effluent was diluted with Buffer F to 6.5 ml to decrease the imidazole concentration to <30 mM, and passed through a 1.5-ml Ni-NTA column. The column was washed with 15 ml of Buffer F and eluted with Buffer F, containing 150 mM imidazole (see Notes 1 and 2).
3.3. Gold Nanorod Preparation
Gold nanorods can be prepared by the reduction of HAuCl4 to form 4-nm seeds (15), but are also commercially available from Nanopartz Inc.
Nanorods are coated with Neutravidin by exchanging the gold rod buffer (100 mM CTAB) with 1 mM CTAB. Neutravidin is added directly to the nanorod/CTAB solution to a final concentration of 40 μg/ml. The mixture is shaken at room temperature for 1 h and is best if prepared daily. Avidinated gold nanorods were further diluted in Assembly Buffer containing BSA-c (see Notes 3–5).
A variety of protocols are now available to make gold nanorods. These methods have primarily optimized factors that give rise to a high yield of nanorods with a narrow distribution of size and aspect ratio. However, to date, optimization of the dynamic range of polarized light scattering has not been a priority. Although the presence of Ag during the synthesis of the gold nanorods improves the yield and uniformity of the nanorods, it has been our experience that Ag decreases the dynamic range significantly.
Because the synthesis of nanorods is not precise, we routinely examine all Nanorod preparations that we make or purchase by electron microscopy to confirm size and shape before use in single molecule experiments. We have found that the drag on the motors can be determined precisely based on their dimensions, with the minor caveat that the drag is sensitive to the shape of the nanorods (16).
3.4. Assembly of Components on the Microscope Slide
Draw a small circle on the bottom surface of a clean Ni-NTA-coated glass microscope slide with a permanent marker in order to identify the location on which the enzyme and nanorods will be assembled. On the opposite side of the slide, apply 5 μl of 100 μg/ml of the ATPase enzyme within the circle to immobilize the enzyme on the surface via the His-tags. After 5 min wash the slide for 30 s with Assembly Buffer and wick excess liquid from the surface using the tip of a Kim wipe.
While the spot containing immobilized ATPase is still damp, apply 100 μl of avidinated gold nanorods to the same spot and incubate for 5 min. Wash with Assembly Buffer for 30 s to remove unbound gold nanorods, and wick excess liquid from the surface as before. While the surface remains damp, add Rotation Buffer containing the desired amount of PEG400 and apply a glass cover slip (Fig. 3a) (see Note 6).
Silicone masks are commercially available that, when applied to a microscope slide, reversibly adhere and create wells. Assembly of the enzyme with the nanorods using these temporary wells eliminates the accumulation of a large amount of enzyme-bound nanorods that otherwise assemble on the slide at the edge of the droplet used to apply them to the surface. After assembly on the slide, the silicone mask is replaced by the cover slip.
Fig. 3.

(a) Assemby of FOF1nanodiscs (n-F F) with a gold nanorod on a microscope slide for single molecule studies. Microscope slide bound n-F Fattached via β-subunit N terminus 6xHis tags attached to an avidin-coated 77 × 39 nm nanorod via a biotinylated subunit-c cys that was inserted as the second residue in the sequence. Integral membrane protein subunits of F are incorporated into a nanodisc comprised of the membrane scaffold protein (MSP) that forms a 13-nm diameter ring of a-helices around a bilayer of a few hundred phospholipid molecules, and has been shown to provide a good model for lipid bilayers. Rotation catalyzed by purified F -ATPase is measured by assembling F on the microscope slide in the same manner, but the Avidin-coated gold Nanorod is attached to a biotinylated cys on the γ-subunit not shown). (b) Dwell duration and positions for ATPase-driven F rotation using data acquired at 1 kHz. Horizontal lines indicate the catalytic dwells.
3.5. Microscopy to Measure Rotation
As a control, apply the Avidin/BSA-c coated nanorods to a microscope slide that lacks the ATPase enzyme, incubate 5 min, and wash slide for 30 s with Assembly Buffer to remove unbound nanorods. If the nanorods are properly coated, very few (typically <10) nanorods/field of view will have become bound to the slide as observed by dark-field microscopy.
Mount a microscope slide on which the ATPase enzyme was assembled with the nanorods. Focus the microscope to view the light scattered from the gold nanorods bound to the surface of the slide with the color camera. Using the recommended concentration of protein (F1 or FoF1) applied to the microscope slide, ~250 nanorods should be visible in an average field of view (see Note 7).
Examine the field of view to identify spots of scattered light emitted from the nanorods in which the intensity oscillates between red and green as an initial indication of ATPase-dependent rotation (see Note 8).
Use the stage to align a nanorod that appears to be flashing with the pinhole.
Adjust the data binning acquired from the single photon counter to obtain the desired speed of time resolution during data acquisition.
Divert the light from the color camera to the single photon detector, and monitor changes in the intensity of the scattered light as a function of time. Note that only one single photon counting avalanche photodiode detector is required for these measurements unless the objective is to determine the direction of rotation. The use of a single detector will increase the photons that reach the detector and thus the signal-to-noise of the measurements.
Maximize the dynamic range of the scattered light intensity at a data acquisition speed of 1 kHz by making minor adjustments to the position of the microscope stage and/or by rotating the polarizing filter by small increments. The scattered light intensity from a nanorod that is rotating will easily vary between maximum and minimum values of 2,500 and 500, resulting in a dynamic range of 3,000 photons. If the dynamic range of the nanorod examined meets or exceeds this value, collect data for a chosen interval. A data acquisition speed of 100–200 kHz provides a minimal time resolution of 20–10 μs, respectively, which is sufficient to resolve the power stroke of ATPase-driven rotation. We typically collect data for a 50-s period, and monitor the intensity changes throughout to insure that the molecule rotated throughout the entire period examined (see Note 9).
Custom software written in LabView 7.1 simplifies pinhole alignment, and the ability to select options for data acquisition and storage. We also included a feature that shuts off power to the single photon counters should the photon flux on the camera exceed 10,000. Exceeding the allowable maximum light intensity incident upon these detectors can damage them irreversibly. Occasionally, a Nanorod preparation will have a dynamic range that approaches this flux at its maximum. In an application to observe catalytic dwells, which average 8 ms in duration, we collect data at 1 kHz. At this data acquisition speed the power strokes are not resolved, and the data appear to move from one dwell to the next as a discontinuous function (Fig. 3b), and under these conditions, it is easy to damage a photon counter.
The optional use of two photon counters to acquire rotation data (Fig. 2) provides the ability to determine the direction of rotation. Once a nanorod is aligned with the pinhole, rotate the polarizer for detector 1 to give a minimum signal during one of the three catalytic dwells. Then rotate the polarizer for detector 2 so to be offset from that of the first detector by a known amount.
3.6. Data Analysis
For a nanorod immobilized directly to surface of the slide (Fig. 1), the distribution of scattered red light intensities as a function of the rotational position of the polarizing filter determines the variation in the intensity of scattered light from the immobile nanorod as detected by the single photon counter. Based on the data of Fig. 1, the standard error in the measurement varied between 0.02° and 0.12° as the scattered light intensity varied between minimum and maximum values (11).
Since minimum and maximum intensity values of red light scattered from the nanorod occur when the rod is perpendicular and parallel to the plane of polarization, respectively, these minimum and maximum intensity values provide the most sensitive measure of the rotation rate. Thus, the most sensitive measure of a 120° rotational power stroke driven by ATP hydrolysis at saturating Mg2+-ATP will occur in the subset of data that includes the 90° of rotation between these maximum and minimum values. We refer to these 90° rotational events in the data set as transitions.
The single-molecule rotation data is analyzed to identify and measure transitions using custom software written in Mat Lab 6.5 (6). The program first establishes the minimum and maximum intensity values for each data set. Rotational events are then identified as a consecutive group of a minimum of three data points in which the intensity changes from within 5% of the minimum intensity of scattered light to >95% of the maximum or vice versa that also have a linear regression R2 value of 0.95 or greater. Each group of data points in a transition are stored for use in determining the rotational velocity of each, and collated in a spread sheet. They can be accessed and plotted individually or as a group. The software allows the min/max intensity percentage cut-offs and R2 values to be varied to examine the variation in the calculation of the rotational velocity. Information concerning the total number of rotational events, average velocity, and distribution of events in a given data acquisition is also tabulated (see Note 10).
A schematic of scattered light intensity during three consecutive power strokes (one complete revolution) is shown in Fig. 4 when the nanorod was initially aligned nearly, but not exactly, perpendicular to the polarizer. Since the stochastic nature of the enzyme results in a variation in the rotational position of each catalytic dwell (17), the alignment of the nanorod with the polarizer will show small variations during the data collection period. If the nanorod is initially aligned perpendicular to the polarizer and the three consecutive power strokes are exactly 120° during a single revolution such that the nanorod is also perpendicular during catalytic dwell 3, the algorithm will analyze transitions from power strokes one and three. In practice, the number of consecutive power strokes analyzed is randomized by the stochastic nature of the molecular motor. Due to the randomization, there is an equal probability that the 90° increments of rotation measured as transitions represents the beginning, the middle, and the end of each 120° power stroke such that the entire power stroke is sampled in the course of the ~3,520 power stroke events monitored on average for each molecule during the 50 s of data acquisition at 100 kHz.
-
Since the intensity of scattered light changes as a sinusoidal function of the rotational position of the nanorod, the degrees of rotation during a transition are derived from the arcsine of the fractional intensity of light scattered from the nanorod by Eq. 1:
(1) where q is degrees of rotation, and I is the fractional intensity of scattered light.
Example transitions are shown in Fig. 5 (11). The ATPase-driven power strokes catalyzed by F1 at saturating Mg-ATP appear as uninterrupted rotation throughout the 90° of data analyzed. Similar continuous power stroke events are also observed with ATPase-driven n-FoF1 rotation in the absence of PEG400. However, when the drag induced by the presence of PEG400 is sufficient to slow n-FoF1 rotation below a threshold, transient dwells clearly resolved an average of every 36°. These transient dwells correspond to an interaction between the Fo stator and rotor subunits that can be measured to last from 200 to 50 μs in the presence of 15 and 35% PEG400, respectively. The incorporation of FoF1 into nanodiscs provides a lipid environment that stabilizes the integral membrane protein interactions. The size of a nanodisc is ideal for use in single molecule experiments.
-
The load imposed on the motor can be varied by changing the size of the nanorod and/or by increasing the viscosity of the medium (Fig. 6). We vary the viscosity by the inclusion of PEG400 in the solution because we determined that PEG400 molecules behave as a Newtonian fluid (8). As such, they are too small to be pulled along by the rotating nanorod, and thus do not make secondary nonlinear contributions to the drag. The increased drag on the gold nanorod due to the viscosity of the PEG400 solution exerts a load on the motor that slows the power stroke velocity, which can be used to determine the torque (8). For a given size of nanorod, the angular velocity is determined by the rotational distance (arc distance) divided by time. In the absence of the transient dwell, the average angular velocity is calculated using the arc distance of the rod moving 90° divided by the transition time. In the presence of the transient dwell, the average angular velocity is the arc distance of the rod moving 36° divided by the average time between transient dwells. Torque is calculated from the drag and the velocity by Eq. 2:
(2) where Γ is the drag force and ω is the angular velocity of the power stroke.
-
Comparison of direct measurements of the drag on the nanorod (8) showed that the propeller model provided a close approximation of the drag force as a function of PEG400 concentration (see Note 11). Based on this model, the drag force is approximated by Eq. 3:
(3) where L1 and L2 are the lengths of the propeller extending from the rotational axis, r is the radius of the rod, μ is the viscosity of the medium, and h is the height of the cylinder axis relative to the surface. Values for the viscosity of a solution of PEG400 in the buffer used for these rotation measurements are provided in ref. 8. The drag generated by a 77 × 39 nm gold nanorod will vary depending on whether the axis of rotation is at the end or in the middle of the nanorod.
The optional use of two photon counters to acquire rotation data (Fig. 2) provides the ability to determine the direction of rotation. The exact number of degrees of offset between the two polarizers is not important, but it must be sufficient to distinguish the time that a power stroke is detected by the two single photon counters (Fig. 7a). Simply, CCW rotation is indicated when photon counter 1 detects a power stroke before photon counter 2 and vice versa for CW rotation. By tracking the changes in intensity with a known polarization phase shift between the detectors, an algorithm can calculate the exact angular position of the Nanorod and the direction of rotation throughout during the entire data set. An example is shown in Fig. 7b and 7c.
Fig. 4.

Relationship between a 120° power stroke and a 90° measured rotational transition. Theoretical plot of the intensity of scattered red light from a nanorod during one complete revolution that involves three consecutive power strokes and three consecutive catalytic dwells separated by exactly 120°. The nanorod is initially positioned almost, but not exactly perpendicular to the orientation of the polarizer such that the scattered light intensity goes through a minimum than a maximum prior to catalytic dwell 1. A transition includes the data between the minimum and maximum intensities representing 90° of the 120° of rotation for analysis. When initial alignment of the nanorod is exactly at the minimum and each of the successive power strokes is exactly 120° the algorithm selects transitions for power strokes 1 (min to max) and 3 (max to min).
Fig. 5.

Power stroke events with and without transient dwells due to ATPase-driven rotation of single molecules. Example transitions for F1 (filled circle), as well as for n-FoF1 with (filled square) and without (open square) transient dwells. Arrows indicate transient dwells. Nanorod attachment occurred via the γ-subunit for F1 or via the c-ring for n-FoF1. Data were acquired at 100 kHz in the presence of 15% PEG400 (v/v) and 1 mM MgATP, and were converted from scattered light intensity to degrees of rotation by Eq. 1.
Fig. 6.

Transition times of F1-dependent γ-subunit rotation as a function of PEG-400 concentration and nano-rod size at 1 mM MgCl2 and 2 mM ATP. (a) Average transition times as a function of PEG400 concentration measured using 75 × 35 nm (triangle), 87 × 36 nm (open circle), 90 × 46 nm (square) and 91 × 45 nm (diamond) nanorods. (Inset) Expansion of data between 0 and 20% PEG400 shows that the transition times for the three smallest nanorods converge to a single value of ~250 μs. (b) Transition times plotted as a function of increasing nanorod size at fixed PEG400 concentrations. Lines are the linear best fit for 30, 45, and 60% PEG400.
Fig. 7.

(a) Theoretical plot of changes in intensity of red scattered light observed from two single rotating nanorod by two photon counters when the orientation of the polarizer for detector 1 is offset from that of detector 2. (b) Experimental time course of rotational position of the γ subunit in a single F1 molecule determined from data acquired at 10 kHz with two photon counters in which the orientation of the polarizer for detector 1 was offset from that of detector 2. The substrate concentration was 1 mM MgCl and 2 mM ATP. (c) Detail of the rotational stepping of the boxed region of (b). Horizontal lines indicate the 120° catalytic dwell positions.
Acknowledgments
This work was supported by grants from National Institutes of Health (GM50202), DARPA, and AFOSR (FA9550-05-1-0424) to W.D.F.
Footnotes
The membrane scaffold protein construct MSP1E3D1 used is composed of scaffold protein that contains three 22-mer amphipathic helices and a cleavable his-tag as the result of an introduced TEV protease site to facilitate purification (18, 19). Nanodiscs formed from this construct contain a lipid bilayer that is about 13 nm in diameter surrounded by a double belt of the MSP helices.
The yield of n-FoF1 was ~60–70% of the amount of FoF1 starting material as measured with the BCA protein assay.
Removal of the CTAB is important since it was found to be a potent inhibitor of F1 activity, though when the avidinated gold was mixed with the F1 on the slide, there was no inhibition. The abundance of rotating molecules is also reduced if the bottles of Avidin and/or BSA-c have passed the expiration date on the bottles. This can sometimes cause the nanorods to clump on the slide, which is apparent as yellow spots by microscopy.
Coating the gold nanorods with avidin can be verified by spectro-photometry through a 4–10-nm red shift in the spectrum. This red shift is attributed to a change in the dielectric environment of the gold nanorod surface (20).
Coating with BSA-c decreased the nonspecific binding of the gold nanorods to the surface of the microscope slide.
Allowing the surface to dry completely causes a drastic reduction in the abundance of molecules that will be observed to rotate. The surface can dry out extremely quickly with some slides and/or some nanorod preparations.
The Mg–ATP concentration in the Rotation Buffer results in rates of ATP hydrolysis rates that approximate Vmax, and this ratio of Mg to ATP in this buffer minimizes the occurrence of entrapped Mg–ADP in a catalytic site that results in extremely long catalytic dwells. Under these conditions, rotation is observed as discrete 120° events separated by the rate-limiting product release dwell.
Typically, about 30% of the rods in a given field of view will rotate on an average microscope slide, compared to less than 1% observed by Noji et al. (21). We have occasionally observed the abundance of rotating molecules to approach 85%, but as stated in notes above, several factors can adversely affect the abundance. The abundance also decreases in the presence of 35–40% PEG400, since the load exceeds the torque of the motor (see Note 11).
Single F1 molecules can be observed to rotate for several hours using this method. The average velocity of rotation measured using this method was about 0.5°μs 1 (6). Minimal data acquisition speeds of ~50 kHz are required to obtain an accurate measure of the velocity of rotation.
References
- 1.Stock D, Leslie AG, Walker JE. Molecular architecture of the rotary motor in ATP synthase. Science. 1999;286:1700–1705. doi: 10.1126/science.286.5445.1700. [DOI] [PubMed] [Google Scholar]
- 2.Jiang WP, Hermolin J, Fillingame RH. The preferred stoichiometry of c sub-units in the rotary motor sector of Escherichia coli ATP synthase is 10. Proc Nat Acad Sci USA. 2001;98:4966–4971. doi: 10.1073/pnas.081424898. [DOI] [PMC free article] [PubMed] [Google Scholar]
- 3.Börsch M, Diez M, Zimmermann B, Reuter R, Gräber P. Stepwise rotation of the gamma-subunit of EFoF1-ATP synthase observed by intramolecular single-molecule fluorescence resonance energy transfer. FEBS Lett. 2002;527:147–152. doi: 10.1016/s0014-5793(02)03198-8. [DOI] [PubMed] [Google Scholar]
- 4.Boyer PD. The ATP synthase-a splendid molecular machine. Annu Rev Biochem. 1997;66:717–749. doi: 10.1146/annurev.biochem.66.1.717. [DOI] [PubMed] [Google Scholar]
- 5.Sabbert D, Engelbrecht S, Junge W. Intersubunit rotation in active F-ATPase. Nature. 1996;381:623–625. doi: 10.1038/381623a0. [DOI] [PubMed] [Google Scholar]
- 6.Spetzler D, York J, Daniel D, Fromme R, Lowry D, Frasch W. Microsecond Time Scale Rotation Measurements of Single F1-ATPase Molecules. Biochemistry. 2006;45:3117–3124. doi: 10.1021/bi052363n. [DOI] [PMC free article] [PubMed] [Google Scholar]
- 7.Noji H, Hasler K, Junge W, Kinosita K, Jr, Yoshida M, Engelbrecht S. Rotation of Escherichia coli F1-ATPase. Biochem Biophys Res Commun. 1999;260:597–599. doi: 10.1006/bbrc.1999.0885. [DOI] [PubMed] [Google Scholar]
- 8.Hornung T, Ishmukhametov R, Spetzler D, Martin J, Frasch WD. Determination of torque generation from the power stroke of Escherichia coli F1-ATPase. Biochim Biophys Acta. 2008;1777:579–582. doi: 10.1016/j.bbabio.2008.04.016. [DOI] [PMC free article] [PubMed] [Google Scholar]
- 9.Moskovits M. Surface-Enhanced Spectroscopy. Rev Mod Phys. 1985;57:783–826. [Google Scholar]
- 10.Sönnichsen C, Alivisatos AP. Gold nanorods as novel nonbleaching plasmon-based orientation sensors for polarized single-particle microscopy. Nano Lett. 2005;5:301–304. doi: 10.1021/nl048089k. [DOI] [PubMed] [Google Scholar]
- 11.Ishmukhametov R, Hornung T, Spetzler D, Frasch WD. Direct Observation of Stepped proteolipid ring rotation in E. coli FoF1 ATP Synthase. EMBO J. 2010;29:3911–3923. doi: 10.1038/emboj.2010.259. [DOI] [PMC free article] [PubMed] [Google Scholar]
- 12.York J, Spetzler D, Hornung T, Ishmukhametov R, Martin J, Frasch WD. Abundance of Escherichia coli F1-ATPase molecules observed to rotate via single-molecule microscopy with gold nanorod probes. J Bioenerg Biomembr. 2007;39:435–439. doi: 10.1007/s10863-007-9114-x. [DOI] [PubMed] [Google Scholar]
- 13.Greene MD, Frasch WD. Interactions among gamma R268, gamma Q269, and the beta subunit catch loop of Escherichia coli F -ATPase are important for catalytic activity. J Biol Chem. 2003;278:51594–51598. doi: 10.1074/jbc.M309948200. [DOI] [PubMed] [Google Scholar]
- 14.Klionsky DJ, Brusilow WS, Simoni RD. In vivo evidence for the role of the epsilon subunit as an inhibitor of the proton-translocating ATPase of Escherichia coli. J Bacteriol. 1984;160:1055–1060. doi: 10.1128/jb.160.3.1055-1060.1984. [DOI] [PMC free article] [PubMed] [Google Scholar]
- 15.Jana NR, Gearheart L, Murphy CJ. Wet Chemical Synthesis of high aspect ratio cylindrical gold nanorods. Phys Chem. 2001;105:4065–4067. [Google Scholar]
- 16.Spetzler D, Ishmukhametov R, Hornung T, Day LJ, Martin J, Frasch WD. Single molecule measurements of F1-ATPase reveal an interdependence between the power stroke and the dwell duration. Biochemistry. 2009;48:7979–7985. doi: 10.1021/bi9008215. [DOI] [PMC free article] [PubMed] [Google Scholar]
- 17.Yasuda R, Noji H, Yoshida M, Kinosita K, Itoh H. Resolution of distinct rotational substeps by submillisecond kinetic analysis of F1-ATPase. Nature. 2001;410:898–904. doi: 10.1038/35073513. [DOI] [PubMed] [Google Scholar]
- 18.Bayburt TH, Leitz AJ, Xie G, Oprian DD, Sligar SG. Transducin activation by nanoscale lipid bilayers containing one and two rhodopsins. J Biol Chem. 2007;282:14875–14881. doi: 10.1074/jbc.M701433200. [DOI] [PubMed] [Google Scholar]
- 19.Denisov IG, Grinkova YV, Lazarides AA, Sligar SG. Directed self-assembly of monodisperse phospholipid bilayer Nanodiscs with controlled size. J Am Chem Soc. 2004;126:3477–3487. doi: 10.1021/ja0393574. [DOI] [PubMed] [Google Scholar]
- 20.Raschke G, Kowarik S, Franzl T, Sönnichsen C, Klar TA, Feldmann J, Nichtl A, Kurzinger K. Biomolecular recognition based on single gold nanoparticle light scattering. Nano Lett. 2003;3:935–938. [Google Scholar]
- 21.Noji H, Yasuda R, Yoshida M, Kinosita K., Jr Direct observation of the rotation of F1-ATPase. Nature. 1997;386:299–302. doi: 10.1038/386299a0. [DOI] [PubMed] [Google Scholar]