

Abstract
The human cortical folding is intriguingly complex in its variability and regularity across individuals. Exploring the principal patterns of cortical folding is of great importance for neuroimaging research. The term-born neonates with minimum exposure to the complicated environments are the ideal candidates to mine the postnatal origins of principal cortical folding patterns. In this work, we propose a novel framework to study the gyral patterns of neonatal cortical folding. Specifically, first, we leverage multi-view curvature-derived features to comprehensively characterize the complex and multi-scale nature of cortical folding. Second, for each feature, we build a dissimilarity matrix for measuring the difference of cortical folding between any pair of subjects. Then, we convert these dissimilarity matrices as similarity matrices, and nonlinearly fuse them into a single matrix via a similarity network fusion method. Finally, we apply a hierarchical affinity propagation clustering approach to group subjects into several clusters based on the fused similarity matrix. The proposed framework is generic and can be applied to any cortical region, or even the whole cortical surface. Experiments are carried out on a large dataset with 600+ term-born neonates to mine the principal folding patterns of three representative gyral regions.
Keywords: Infant Cortical Folding, Gyral Pattern, Curvature Information
1 Introduction
The highly-convoluted human cerebral cortex, composed by the convex gyri and concave sulci, is intriguingly complex in both its variability and regularity across individuals. Cortical folding patterns are essentially determined by the underlying cortical cytoarchitecture and their connectivity, although the exact mechanisms of prenatal brain development are still unclear [1]. Exploring the underlying representative patterns of cortical folding is of great importance in neuroimaging research. It will allow us to: 1) understand the inter-individual variability of cortical folding and their relations with behavior/cognitive functions; 2) detect abnormal folding patterns that could be the biomarkers of brain disorders, since many neural disorders are associated with abnormal cortical folding; and 3) build multiple cortical atlases based on the folding patterns for better spatial normalization of subjects, in contrast to the conventional simple averaging of heterogeneous folding patterns that typically leads to fuzzy appearance in atlases and thus degraded accuracy in spatial normalization and subsequent analysis.
Currently, the most comprehensive description of cortical folding patterns is the classic text “Atlas of Sulci” [2] that is based on visual examination of autopsy specimen of 25 adult brains, and has been extensively referenced in neuroimaging studies. To subjectively and automatically study sulcal folding patterns from non-invasive in vivo MR images, several clustering and graph matching based methods have been recently proposed to group individuals’ cortical folds into sub-populations based on the folding descriptors, and revealed some interesting patterns [3–5]. However, existing studies of cortical folding patterns have several limitations. 1) Their sample sizes are typically not large, thus inevitably missing many typical folding patterns. 2) Existing studies are largely performed in adults or older children, hence, it is still unclear on the postnatal origins of cortical folding patterns. 3) Existing studies either rely on subjective, tedious, error-prone visual categorization, or utilize relatively simple geometric features to infer folding patterns, thus are unable to fully capture the huge complexity and variability of cortical folding patterns. 4) Existing studies mainly focus on sulcal patterns, thus ignoring the importance of gyral folding patterns. Indeed, sulci and gyri have distinct cortical properties, structural/functional connections, and developmental mechanisms.
To address these limitations, we propose to discover the postnatal origins of cortical gyral folding patterns using a large-scale neonatal dataset, by developing a novel framework that can comprehensively characterize cortical folding based on the multi-view curvatures. Specifically, first, we leverage two types of curvature-derived features, i.e., 1) the decomposed curvature information at multiple spatial-frequency scales using over-complete spherical wavelets, and 2) the extracted gyral crest curves on the cortical surface based on the curvature map. Thus, we can obtain the complementary multi-view curvature information to comprehensively characterize the cortical folding. Second, for each feature, we build a dissimilarity matrix for measuring the difference of cortical folding in one aspect between any pair of subjects. Then, we convert these dissimilarity matrices as similarity matrices, and nonlinearly fuse them into a single matrix via a similarity network fusion method. By doing this, we can retain both shared and complementary information of multi-view metrics of cortical folding within a single fused similarity matrix. Finally, we apply a hierarchical affinity propagation clustering approach to group subjects into several clusters based on the fused similarity matrix, and obtain the final most representative gyral patterns of infant cortical folding.
2 Materials and Methods
2.1 Dataset and Image Processing
The T1w and T2w brain MR images were acquired from 677 term-born neonates on a 3T Siemens Tim Trio scanner. T1w images were obtained by using 3D magnetization-prepared rapid gradient echo sequence with the parameters: TR, 1820 ms; TE, 4.38 ms; resolution, 1×1×1 mm3. T2w images were acquired by using a turbo spin-echo sequence with the parameters: TR, 7380 ms; TE, 119 ms; resolution, 1.25×1.25×1.95 mm3.
Cortical surfaces were reconstructed and aligned using an infant-specific pipeline [6]. The preprocessing included: skull stripping and cerebellum removing, intensity inhomogeneity correction, tissue segmentation, hemisphere separation, and topology correction. The inner and outer cortical surfaces were reconstructed by using a deformable surface method. The inner surface was further smoothed, inflated, and mapped to a standard sphere. Inter-subject vertex-to-vertex cortical correspondences were established by group-wise surface registration using Spherical Demons [7], and all cortical surfaces were accordingly resampled to the same standard mesh tessellation.
2.2 Computing Multi-view Curvature-based Features
To explore gyral folding patterns, we need to quantitatively compare the similarity of gyral folding across subjects. Of note, cortical folding is essentially a multi-scale concept and can be characterized on many different scales. Although curvature and sulcal depth have been extensively adopted for studying the relatively fine scale and coarse scale of cortical folding, respectively, they only can describe cortical folding to some extent and have unclear intrinsic relationships, thus are not able to fully characterize the complex and multi-scale nature of cortical folding. To this end, we decompose the mean curvature map of the cortical surface into multiple spatial-frequency scales using over-complete spherical wavelets. Meanwhile, to characterize high-level characteristics of gyral folding, we extract gyral crest curves based on the curvature information.
Computing Multi-scale Curvature using Spherical Wavelets
Given the mean curvature map on the inner cortical surface with a spherical topology (Fig. 1 (a)), we decomposed this map into multiple spatial-frequency scales via over-complete spherical wavelet transform [8]. Note that the conventional orthogonal/bi-orthogonal wavelets would not work well for our purpose, because they suffer from sampling aliasing and thus are not invariant under rotation of the underlying surface parameterization. To resolve this issue, the over-complete spherical wavelets ensure sufficiently sampling at each scale, and thus are more robust and sensitive in capturing cortical folding patterns.
Fig. 1.
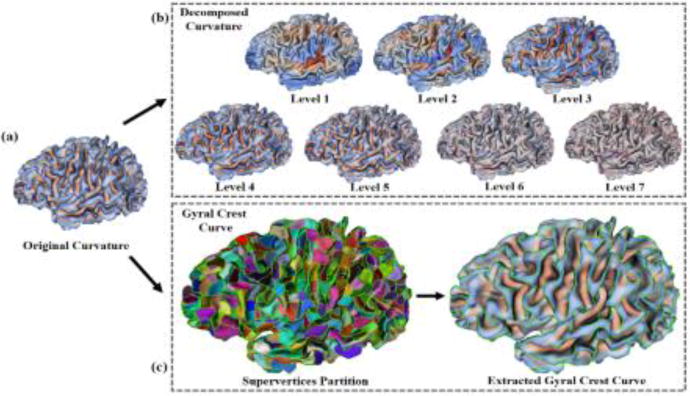
An illustration of multi-view curvature based features. (a) The original mean curvature map on an inner cortical surface. (b) Decomposed curvature maps at multi-scales (1–7 levels) using spherical wavelets. (c) Extracted gyral crest curves (in green) based on supervertices.
Given an input cortical spherical curvature map I and spherical analysis filters at N frequency levels, we can compute a set of wavelet coefficients ρn at multi-scales in spatial-frequency, by convolving them in the spherical domain as: . The analysis filter is defined as: , where n is the frequency level, ψ is the mother wavelet, and Qnψ represents the dilations of ψ. Herein, we used the Laplacian-of-Gaussian as the mother wavelet ψ as in [8]. For a rotation-invariant shape analysis, we over-sampled the estimated wavelet coefficients on the sphere with 163,842 vertices. Since the underlying wavelet basis functions have local supports in both space and frequency, the wavelet coefficients at different levels thus can characterize cortical folding at multiple spatial-frequency scales. An example of decomposing a curvature map into 7 levels is shown in Fig. 1 (b). As we can see, wavelet coefficients of the curvature map at coarser levels capture larger-scale folding information, while coefficients at finer levels encode smaller-scale folding information, thus leading to a natural multi-scale characterization of cortical folding. Hence, for each of the selected decomposed levels, we calculated the difference between any pair of subjects to form a dissimilarity matrix, where each element recorded the scale-specific cortical folding difference between any pair of subjects. Of note, we chose the decomposed curvature levels 2–6 to obtain five dissimilarity matrices, by excluding the level 1 and level 7. This is because the level 1, which captures the very large scale information of cortical folding, is very similar across subjects; while the level 7 mainly contains high frequency noises on the cortical surface. The difference between any pair of subjects a and b at a specific level n was calculated as:
| (1) |
where x denotes a vertex, and P is the total number of vertices. With Eq. (1), we calculated five dissimilarity matrices for levels 2 to 6 for the 677 subjects.
Extracting Gyral Crest Curves
For studying gyral folding patterns, a characterized feature is the gyral crest curves. Hence, we also extracted the gyral crest curves based on the curvature information. Note that, we didn’t adopt the popular skeletonization-based methods and curve-tracking-based methods, because skeletonization-based methods are sensitive to asymmetric gyral structures, while the curve-tracking-based methods require computing sensitive high-order curvature information. To this end, we first partitioned each cortical surface into surface patches, called supervertices, where their boundaries were aligned with sulcal fundi and gyral crest curves at highly bended cortical regions, by minimization of an energy function using graph cuts [9]. Then, we automatically and selectively linked these boundaries of supervertices as gyral crest curves. Specifically, the supervertices partition is considered as a labeling problem on the cortical surface, by first initializing 1280 uniformly distributed seeds as the initial centers of supervertices, and then assigning the supervertex label to each vertex based on the cortical geometric information. The energy function was formulated as:
| (2) |
where the first term was determined by the curvature-weighted geodesic distance between each vertex and each seed representing a supervertex label lx ∈ {0, …, L − 1}. was computed based on fast marching method on triangular meshes, with the marching speed setting as F(x) = e−β|c(x)|. Herein, α, β, and λ are all nonnegative parameters. The second term was determined by local geometric information of neighboring vertex pairs, with w(x, y) defined as:
| (3) |
where n indicates the normal direction, and c denotes the maximum principal curvature of a vertex. According to the above setting, if two neighboring vertices belong to two different sides of gyral crest curves or sulcal fundi, they will have large values in both the magnitudes of maximum principal curvatures and the angle between their normal directions, in contrast to the flat cortical regions. Hence, in these situations, the cost of discontinuous labeling of supervertices is set as a small value, and the boundaries of supervertices will align with sulcal fundi or gyral crest curves. After supervertices partition, the average maximum principal curvature in each boundary of supervertices was computed. All boundaries of supervertices with the average maximum principal curvature being smaller than a low negative threshold were labeled as segments of gyral crest curves and then linked as curves, as shown in Fig. 1 (c).
To measure the gyral crest difference between subjects a and b, given their gyral crest curves Ca and Cb, for a point i ∈ Ca, its corresponding closest point is denoted as i′ ∈ Cb. Also, for a point j ∈ Cb, its corresponding closest point is denoted as j′ ∈ Ca. The dissimilarity matrix of gyral crest curves was thus defined as:
| (4) |
where dist(·) is the geodesic distance of the two vertices on spherical surface after surface registration. And and represent the numbers of points on gyral crest curves Ca and Cb, respectively.
2.3 Fusing Similarity Matrices of Multi-view Features
To compare subjects using these multi-view features, the similarity network fusion method [10] was applied to fuse all matrices into a single one for capturing both shared and complementary information of gyral folding in multi-aspects. Given 6 dissimilarity matrices, i.e., DLn, n ∈ {2,3,4,5,6}, and DCrest, we first converted them as 6 similarity matrices using negative scaled exponential kernels [10]. Then, the similarity matrix of each view was respectively normalized and updated iteratively. For each element in the similarity matrix, only the similarity information of K nearest neighbors was propagated during the updating procedure. Finally, we obtained a single fused similarity matrix W by averaging the six convergent similarity matrices of all the views.
2.4 Clustering Gyral Folding Patterns
To discover the representative gyral folding patterns, based on the fused similarity matrix that encodes the inter-subject similarity, affinity propagation clustering (APC) [11] method was applied to group all subjects into several typical clusters. The APC regards all subjects as potential exemplars simultaneously in the beginning, and then transmits real-valued message “responsibility” and “availability” iteratively, until ideal exemplars and their corresponding clusters emerge. However, since cortical folding patterns are extremely variable across subjects, directly applying APC may lead to too many clusters, which is undesirable for discovering the most representative folding patterns. Hence, we performed a hierarchical APC to further group clusters, based on the identified exemplars, thus constraining the resulted cluster number in a moderate range (<5).
3 Results
The proposed framework was applied to a large-scale dataset with 677 term-born neonates. To validate our method, we explored three representative gyral regions, i.e., superior temporal gyrus, inferior frontal gyrus, and superior parietal gyrus. For each discovered pattern, we constructed its average cortical surface and also displayed its five representative individuals, to demonstrate that the discovered patterns are meaningful.
For the superior temporal gyrus, which is involved in auditory processing and social cognition, we discovered four representative patterns, as shown in Fig. 2. Specifically, in pattern (a), the gyrus is relatively straight. In pattern (b), the gyrus becomes rather bended in the posterior part, and meanwhile the transverse temporal cortex is very sharp. The pattern (c) is similar to pattern (b), but it shows an additional small buried branch in the inferior caudal part, as pointed by the arrow. Compared with pattern (c), the pattern (d) has an obvious gyral branch in the inferior caudal part. The percentage of each pattern in the 677 subjects is 30.9%, 19.9%, 19.7%, and 29.5%, respectively.
Fig. 2.
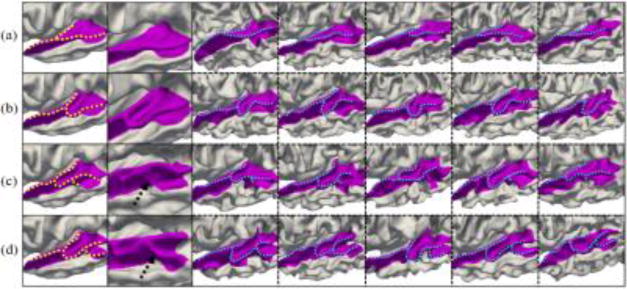
Representative patterns of the superior temporal gyrus (with dashed curves to highlight the gyrus shapes). Of note, the region herein also includes Heschl’s gyrus. Column 1 shows the four discovered patterns. Column 2 shows zooming views on the distinct part of different patterns. Columns 3–7 show five typical individuals for each pattern.
For the inferior frontal gyrus, which plays an important role in language comprehension and production, we also found four representative patterns, as shown in Fig. 3. In pattern (a), the anterior part is a large bended gyrus and its posterior part is interrupted by a sulcus, as pointed by the dashed arrow. In pattern (b), it shows up as a long continuous bended gyrus with three gradual turns. In pattern (c), it is a continuous gyrus with two gradual turns. In pattern (d), the gyrus has two turns and is interrupted by a sulcus in the middle, i.e., an “M” shape. The percentage of each pattern in the 677 subjects is 27.5%, 23.6%, 25.7% and 23.2%, respectively.
Fig. 3.
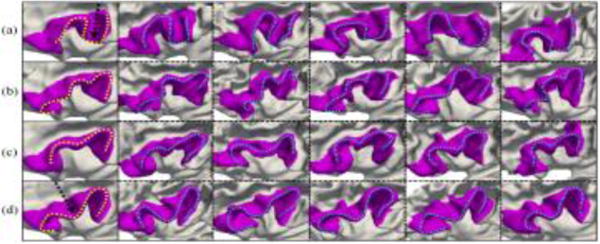
Representative patterns of the inferior frontal gyrus. Column 1 shows the four discovered patterns, and columns 2–6 show five typical individuals for each pattern.
For the superior parietal gyrus, which is related to spatial orientation, four representative patterns were also found as shown in Fig. 4. In pattern (a), the gyrus seems like a ‘W’ shape, with a small gyral branch near the middle. The pattern (b) seems like an ‘M’ shape, followed by a ‘U’ shape. In pattern (c), the gyrus has two reverse turns, seeming like an ‘N’ shape. As for pattern (d), it shows a small ‘U’ shape in the anterior part, which is unique compared with other patterns. The percentage of each pattern in the 677 subjects is 37.5%, 25.1%, 15.2% and 22.2%, respectively.
Fig. 4.
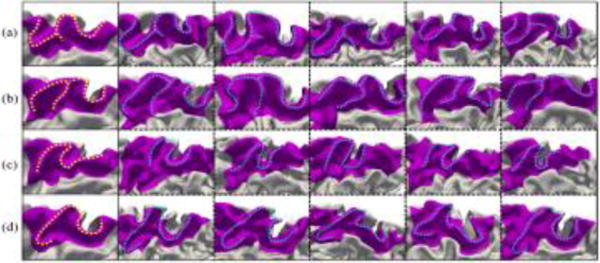
Representative patterns of the superior parietal gyrus. Column 1 shows the four discovered patterns, and columns 2–6 show five typical individuals for each pattern.
4 Conclusion
In this paper, we presented a novel framework to explore the representative gyral patterns of infant cortical folding in a large-scale dataset with 600+ neonates. The contribution of our work is mainly in three aspects. First, we proposed to leverage multi-view curvature-based features for comprehensively characterizing the folding patterns. Second, for the first time, we discovered several representative patterns in the superior temporal gyrus, inferior frontal gyrus, and superior parietal gyrus. Third, with the new multi-view features, the proposed framework can be easily extended to any cortical region or even the whole brain to mine the most representative patterns of cortical folding. Future work will include exploring the folding patterns of more regions and also studying their relationship with cognitive functions and brain disorders.
Acknowledgments
This work was supported in part by NIH grants (MH100217, MH108914, MH107815, MH109773, and MH110274), and National Key Research and Development Program of China (No. 2016YFC1306600).
References
- 1.Striedter GF, Srinivasan S, Monuki ES. Cortical folding: when, where, how, and why? Annu Rev Neurosci. 2015;38:291–307. doi: 10.1146/annurev-neuro-071714-034128. [DOI] [PubMed] [Google Scholar]
- 2.Ono M, Kubik S, Abernathey CD. Atlas of the cerebral sulci. Thieme; New York: 1990. [Google Scholar]
- 3.Sun ZY, Rivière D, Poupon F, et al. Automatic inference of sulcus patterns using 3D moment invariants. In: Ayache N, Ourselin S, Maeder A, editors. MICCAI 2007, Part I. LNCS. Vol. 4791. Springer; Heidelberg: 2007. pp. 515–522. [DOI] [PubMed] [Google Scholar]
- 4.Sun ZY, Perrot M, Tucholka A, et al. Constructing a dictionary of human brain folding patterns. In: Yang G-Z, Hawkes D, Rueckert D, Noble A, Taylor C, editors. MICCAI 2009, Part II. LNCS. Vol. 5762. Springer; Heidelberg: 2009. pp. 117–124. [DOI] [PubMed] [Google Scholar]
- 5.Im K, Raschle NM, Smith SA, et al. Atypical sulcal pattern in children with developmental dyslexia and at-risk kindergarteners. Cereb Cortex. 2015;26:1138–1148. doi: 10.1093/cercor/bhu305. [DOI] [PMC free article] [PubMed] [Google Scholar]
- 6.Li G, Wang L, Shi F, et al. Construction of 4D high-definition cortical surface atlases of infants: Methods and applications. Med Image Anal. 2015;25:22–36. doi: 10.1016/j.media.2015.04.005. [DOI] [PMC free article] [PubMed] [Google Scholar]
- 7.Yeo BT, Sabuncu MR, Vercauteren T, et al. Spherical demons: fast diffeomorphic landmark-free surface registration. IEEE Trans Med Imaging. 2010;29:650–668. doi: 10.1109/TMI.2009.2030797. [DOI] [PMC free article] [PubMed] [Google Scholar]
- 8.Yeo BT, Yu P, Grant PE, et al. Shape analysis with overcomplete spherical wavelets. In: Metaxas D, Axel L, Fichtinger G, Székely G, editors. MICCAI 2008, Part I. LNCS. Vol. 5241. Springer; Heidelberg: 2008. pp. 468–476. [DOI] [PMC free article] [PubMed] [Google Scholar]
- 9.Li G, Nie J, Shen D. Partition cortical surfaces into supervertices: Method and application. In: Levine JA, Paulsen RR, Zhang Y, editors. MeshMed 2012, LNCS. Vol. 7599. Springer; Heidelberg: 2012. pp. 112–121. [Google Scholar]
- 10.Wang B, Mezlini AM, Demir F, et al. Similarity network fusion for aggregating data types on a genomic scale. Nat Methods. 2014;11:333–337. doi: 10.1038/nmeth.2810. [DOI] [PubMed] [Google Scholar]
- 11.Frey BJ, Dueck D. Clustering by passing messages between data points. Science. 2007;315:972–976. doi: 10.1126/science.1136800. [DOI] [PubMed] [Google Scholar]