Abstract
Cells in healthy tissues acquire mutations with surprising frequency. Many of these mutations are associated with abnormal cellular behaviours such as differentiation defects and hyperproliferation, yet fail to produce macroscopically detectable phenotypes1–3. It is currently unclear how the tissue remains phenotypically normal, despite the presence of these mutant cells. Here we use intravital imaging to track the fate of mouse skin epithelium burdened with varying numbers of activated Wnt/β-catenin stem cells. We show that all resulting growths that deform the skin tissue architecture regress, irrespective of their size. Wild-type cells are required for the active elimination of mutant cells from the tissue, while utilizing both endogenous and ectopic cellular behaviours to dismantle the aberrant structures. After regression, the remaining structures are either completely eliminated or converted into functional skin appendages in a niche-dependent manner. Furthermore, tissue aberrancies generated from oncogenic Hras, and even mutation-independent deformations to the tissue, can also be corrected, indicating that this tolerance phenomenon reflects a conserved principle in the skin. This study reveals an unanticipated plasticity of the adult skin epithelium when faced with mutational and non-mutational insult, and elucidates the dynamic cellular behaviours used for its return to a homeostatic state.
Deep sequencing of aged yet phenotypically normal human skin has revealed oncogenic mutations in regulators of tissue growth and tumorigenesis2, suggesting that homeostatic tissue may tolerate drivers of abnormal cellular behaviours. However, it is unclear whether such tolerance is achieved through oncogene suppression, or whether tissue overcomes abnormal cellular behaviours through active mechanisms. To investigate the long-term fates of mutant cells and their tissue consequences, we used intravital imaging to track the same tissue over time4, 5. We first focused on the Wnt/β-catenin pathway, which is a critical regulator of growth across many tissues6–9. Sustained activation of β-catenin is known to promote tumorigenesis in a variety of epithelial tissues, yet fails to generate malignancies in the skin10–15. We have previously demonstrated that the activation of β-catenin within the hair follicle stem cell (HFSC) compartment generates deformities to the tissue architecture in the form of benign tumours, comprising both activated mutant β-catenin and wild-type cells16. While these studies reveal a dynamic interaction of mutant and wild-type cells, it remains unclear how the tissue tolerates the aberrant behaviours of the mutant cell population over time.
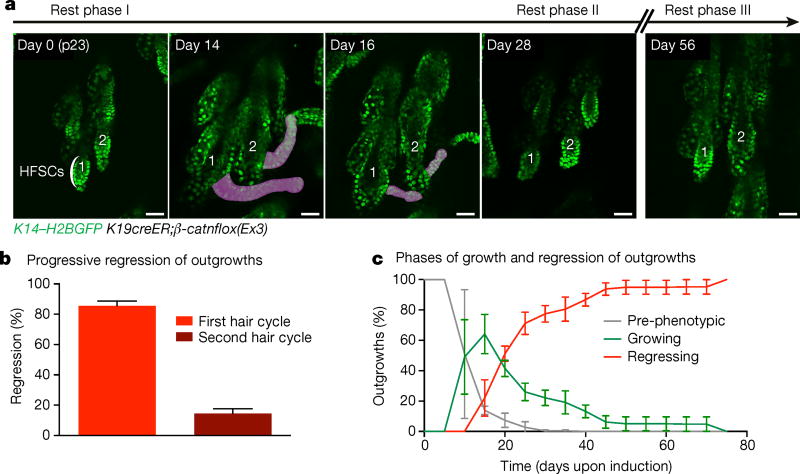
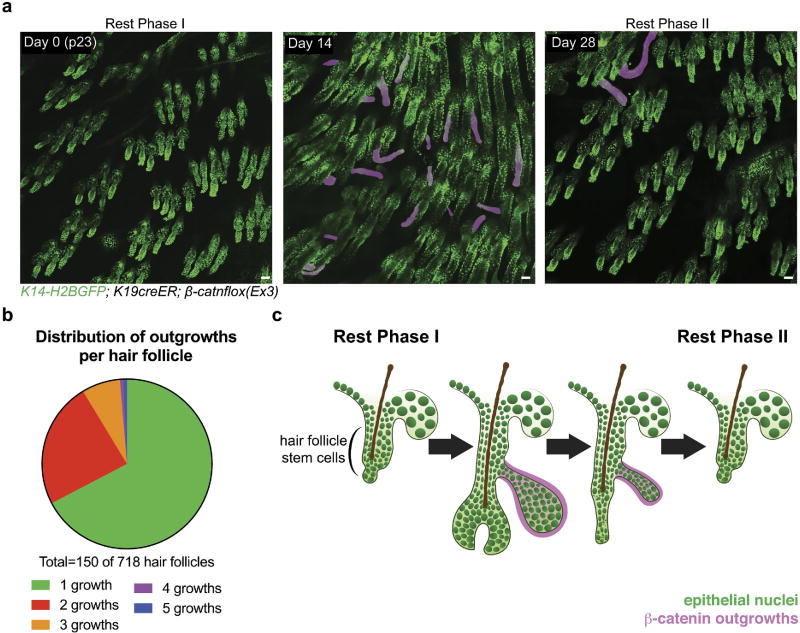
To address this question, we induced the Cre-dependent activated β-catnflox(Ex3) (also known as Ctnnb1flox(Ex3)) mutant allele in a low number of HFSCs (K19creER; Extended Data Fig. 1) at the beginning of the first hair follicle rest phase and tracked them using two-photon microscopy. One to two weeks after induction, new axes of growth emerged from the hair follicles (Extended Data Fig. 2). Surprisingly, ~80% of these outgrowths regressed within 4 weeks, with no incidence of recurrence (Fig. 1a and Extended Data Fig. 3a, b). Furthermore, the outgrowths that had not regressed in the first cycle regressed in subsequent weeks (Fig. 1). These results show that although the presence of mutant β-catenin cells can perturb the architecture of the tissue through the formation of aberrant growths, the skin is capable of returning to its homeostatic state (Extended Data Fig. 3c).
Figure 1. β-Catenin mutant cells generate aberrant growths that regress.
a, b, K14–H2BGFP labels epithelial nuclei (green). β-catenin-induced growths (200 µg tamoxifen) are pseudocoloured purple. a, Representative outgrowths in two hair follicles (1, 2) irreversibly regress over 4 weeks. b, Quantification of outgrowth regression over time (mean ± s.e.m.). Eighty-five per cent of outgrowths regress during the first 4 weeks, while the rest are eliminated within the next month (n = 286 outgrowths across three mice). c, Quantification of the growth and regression phases (mean ± s.e.m.). Pre-phenotypic plot accounts for quantified hair follicles before outgrowth development (n = 286 across three mice).
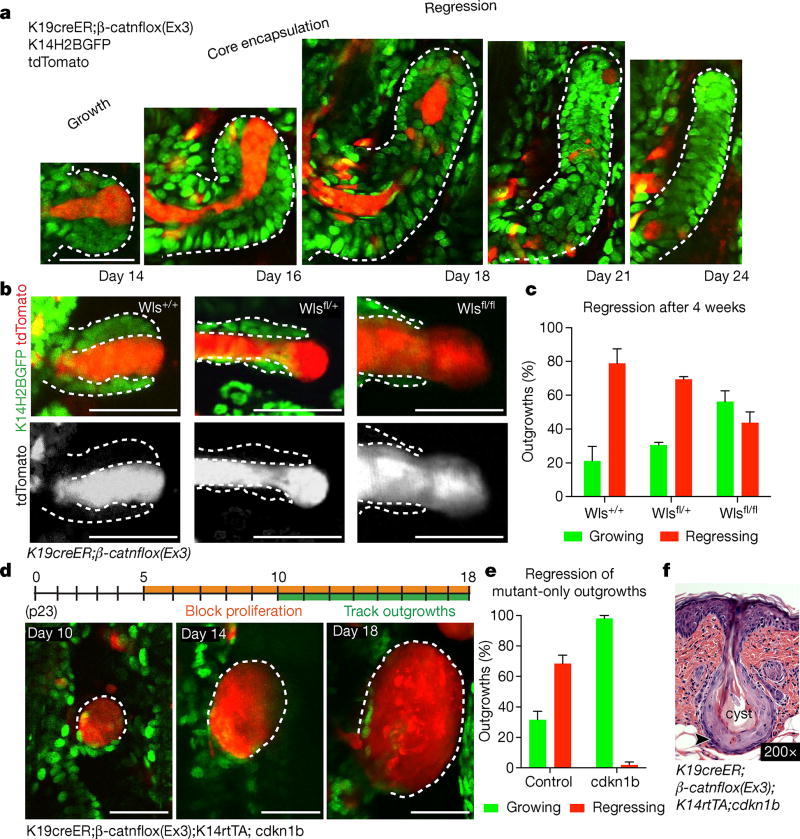
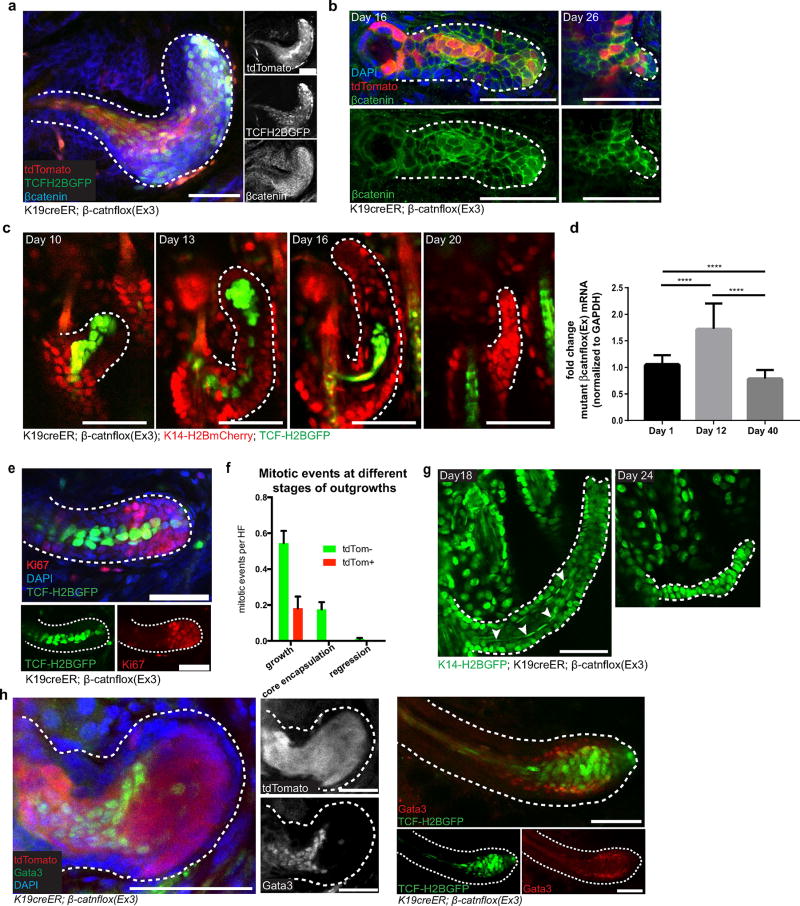
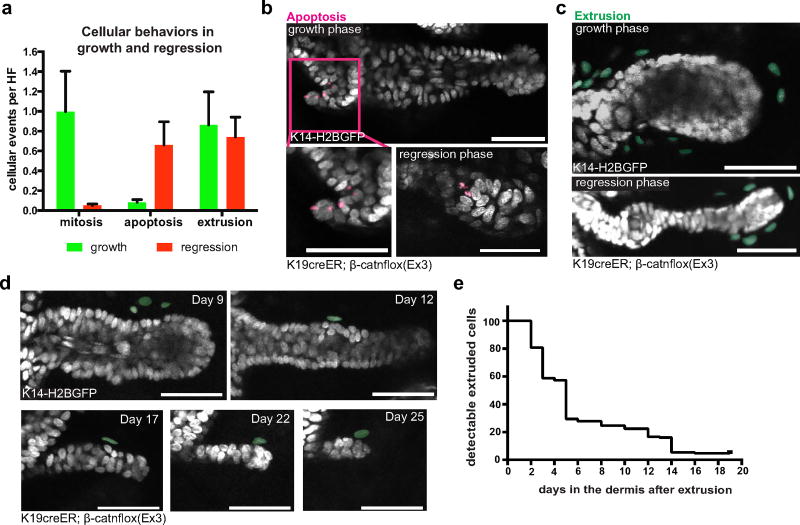
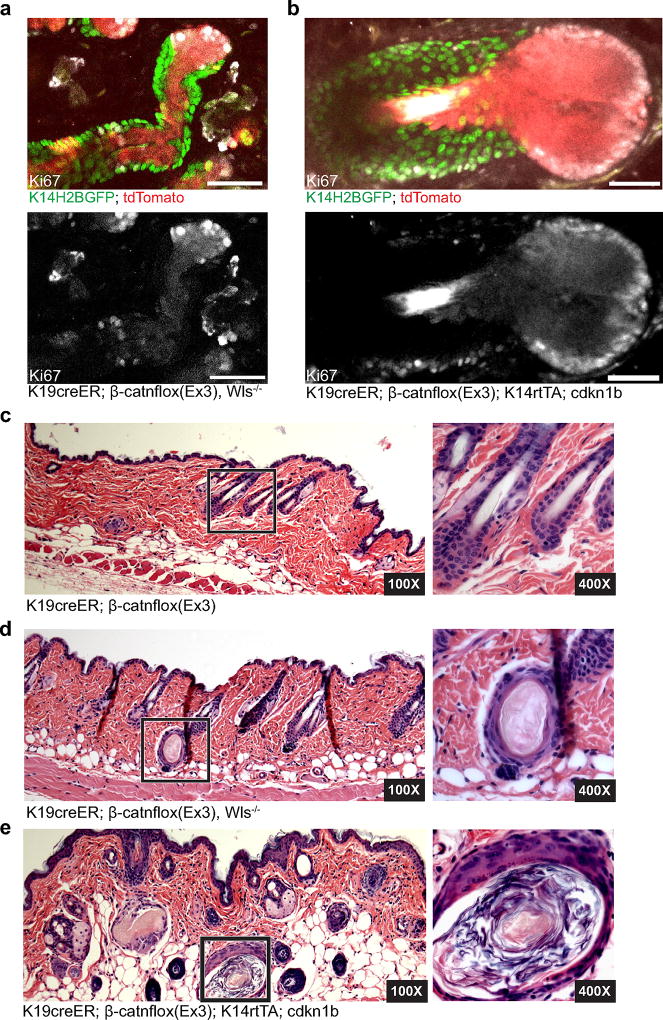
To understand how the tissue overcomes these aberrancies, we examined mutant cellular behaviours within the outgrowths during the phases of growth and regression, using β-catenin staining and two fluorescent reporters (tdTomato Cre-recombination reporter and TCF–H2BGFP Wnt reporter)16–18. We found that the mutant cells predominantly localized to the centre of the outgrowths (Fig. 2a, Extended Data Fig. 4a–c and Supplementary Video 1). Before regression, this core of mutant cells became fully enveloped by surrounding wild-type cells, and was subsequently expelled out of the tissue (Fig. 2a and Extended Data Fig. 4c, d). During the growth phase, mutant cells both proliferated and differentiated, generating hair shaft-like structures that extended out through the epidermis (Extended Data Fig. 4e–h and Supplementary Video 1). Additional homeostatic behaviours such as apoptosis, and ectopic cellular extrusion into the dermis, occurred with similar frequency during growth and regression phases (Extended Data Fig. 5 and Supplementary Videos 2–4). Encapsulation of the mutant core by wild-type cells consistently preceded its elimination from the tissue, prompting us to investigate the role of wild-type cells during outgrowth regression. Previous work has shown that wild-type cell expansion within these growths is enhanced by the ability of mutant cells to secrete Wnt ligands16, 19. Conditional removal of the Wntless gene20 (Wlsfl/fl), which regulates Wnt ligand production, limited the recruitment of wild-type cells into the growths and prevented wild-type cells from encapsulating the proliferative mutant cells along the leading edge of the outgrowths (Fig. 2b and Extended Data Fig. 6a). Interestingly, only 40% of mutant growths in Wls fl/fl mice regressed within the first 4 weeks, while many of the remaining outgrowths developed into small cysts (Fig. 2c and Extended Data Fig. 6c, d).
Figure 2. Wild-type cells are required for the active elimination of mutant cells.
a, Revisits of the same β-catenin outgrowth. b, c, β-Catenin/Wls outgrowth phenotypes (mean ± s.e.m., number of outgrowths = 168 Wls+/+ in three mice; n = 66 Wlsfl/+ in two mice; n = 233 Wlsfl/fl in four mice). d, Schematic of β-catenin and CDKN1b induction (top) and outgrowth revisits (bottom). e, Quantification of growth and regression (mean ± s.e.m., n = 70 outgrowths in four β-catenin/CDKN1b mice and n = 126 in four β-catenin mice). f, Dilated follicular cyst with stratified squamous epithelial lining (black arrow head) displaying keratinohyalin granules and dyskeratotic keratinocytes from β-catenin/CDKN1b. Scale bars, 50 µm.
To further limit wild-type cell contribution to the outgrowths, we blocked their proliferation via a tet-inducible p27 mutant (CDKN1b)21, which upon doxycycline administration inhibits proliferation of K14-expressing cells (K14rtTA)22. As the mutant β-catenin cells down-regulate K14, most are still able to proliferate, allowing us to specifically block proliferation of the wild-type population. Remarkably, under these conditions most of the outgrowths developed into large cysts, with less than 2% regressing within the timeframe during which 68% of control growths regressed (Fig. 2d–f, Extended Data Fig. 6c, e and Supplementary Video 5). Intriguingly, in the absence of wild-type cells, β-catenin cells seemed more proliferative, and despite being able to differentiate, were not observed to regress from the tissue (Extended Data Fig. 6b). Collectively, our results show that the wild-type cells are required for the active elimination of mutant cells from the tissue (Extended Data Fig. 7).
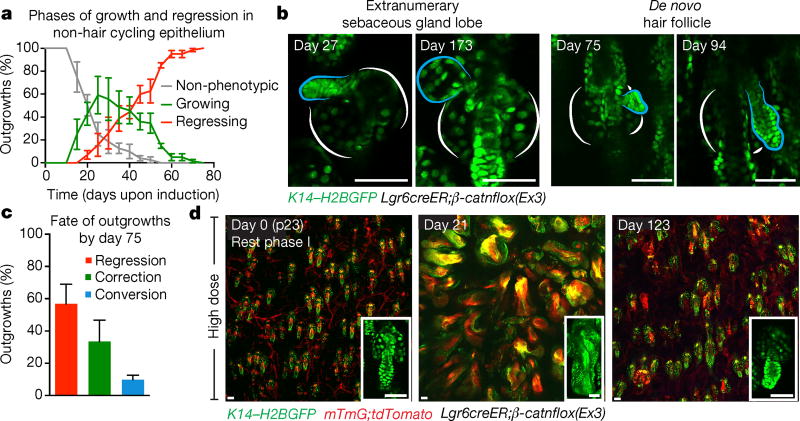
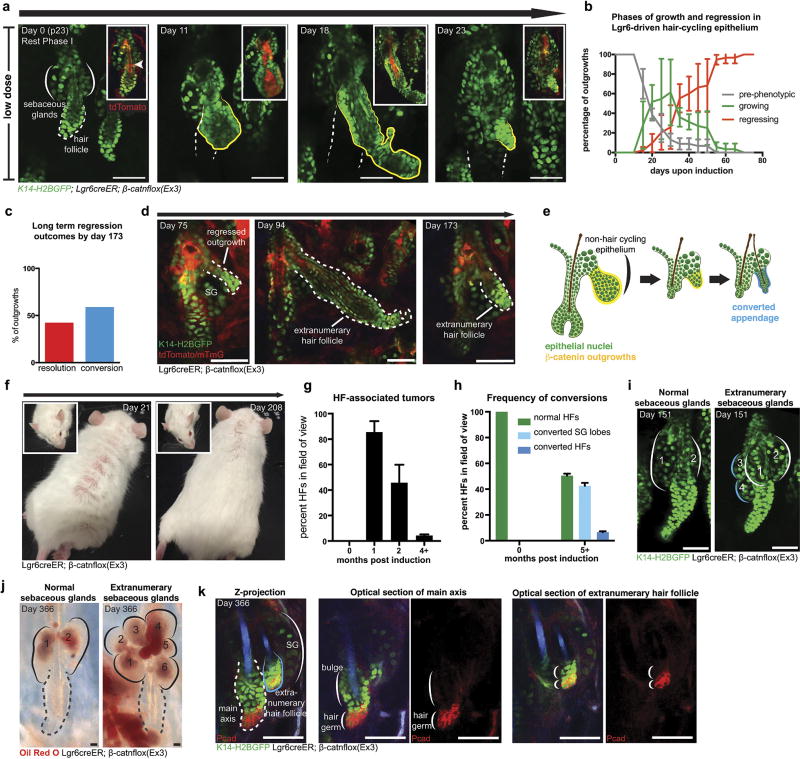
Outgrowth elimination appeared reminiscent of hair follicle regenerative programs, raising the question of whether regression is a specific feature of HFSCs. To address this, we induced the activated β-catnflox(Ex3) mutation in stem cells that contribute to the permanent structures of the upper epithelium (Lgr6creER)23, 24. Consistent with previous findings, clonal induction showed that most recombination occurred in non-hair-cycling regions of the epidermis, such as the sebaceous glands, junctional zone, and infundibulum, in addition to a lower incidence within HFSCs, thus providing an ideal internal control. β-Catenin-induced outgrowths regressed, independently of whether they emerged from hair-cycling or non-hair-cycling compartments (Fig. 3a and Extended Data Fig. 8a, b). Intriguingly, an increasing number of outgrowths from the upper compartment left behind nodules of tdTomato− cells, which were not observed in HFSC-derived outgrowths. We continued to track these remaining structures over subsequent weeks and, remarkably, observed them transition into extranumerary sebaceous gland lobes or functional hair follicles (Fig. 3b, c and Extended Data Fig. 8c–e). Previous reports using gain-of-function β-catenin have observed de novo hair follicle formation and suggested they were a product of β-catenin mutant cells12–14, 25. Our results show that none of the de novo skin appendages contained tdTomato+ cells, indicating that they predominantly comprise wild-type cells (n = 145 de novo appendages) and emerge from the remnant aberrant structures only after the mutant cores are eliminated. Altogether, while regression of β-catenin outgrowths occurs independently of the niche, whether outgrowths are completely eliminated or converted into functional skin appendages is niche-dependent.
Figure 3. Fate of regressing tissue is niche-dependent.
a, Quantification of growth and regression phases of outgrowths (mean ± s.e.m.). Pre-phenotypic plot (n = 73 outgrowths across three mice) accounts for hair follicles before outgrowth development. b, Outgrowth remaining cells are converted into extranumerary sebaceous gland lobe (left) or hair follicle (right). Extranumerary structures are outlined in blue. c, Quantification of the different fates of non-hair cycling epithelial outgrowths (mean ± s.e.m., n = 73 outgrowths). d, Representative images of distinct epidermal regions over time, after a high dose (2 mg) of tamoxifen (n = 4 mice). Insets show representative hair follicles and derived tumours at progressive time points. Scale bars, 50 µm.
We initially activated β-catenin in small groups of cells, to model a scenario of natural clonal occurrence of mutation. To test the extent of this tissue flexibility, we challenged the skin epithelium with a large population of mutant cells, a condition known to induce skin tumours10, 12, 16. Within 3 weeks of induction, the normal epithelium was transformed by large benign tumours (Fig. 3d). Remarkably, 4 months after induction the tumours were gone (Extended Data Fig. 8f, g). While the tissue appeared largely normal, there were several instances of conversion into extranumerary hair follicles and sebaceous gland lobes (Extended Data Fig. 8h–k). These data demonstrate that the skin epithelium is capable of eliminating aberrant structures, irrespective of their size, to re-establish normal tissue architecture and function.
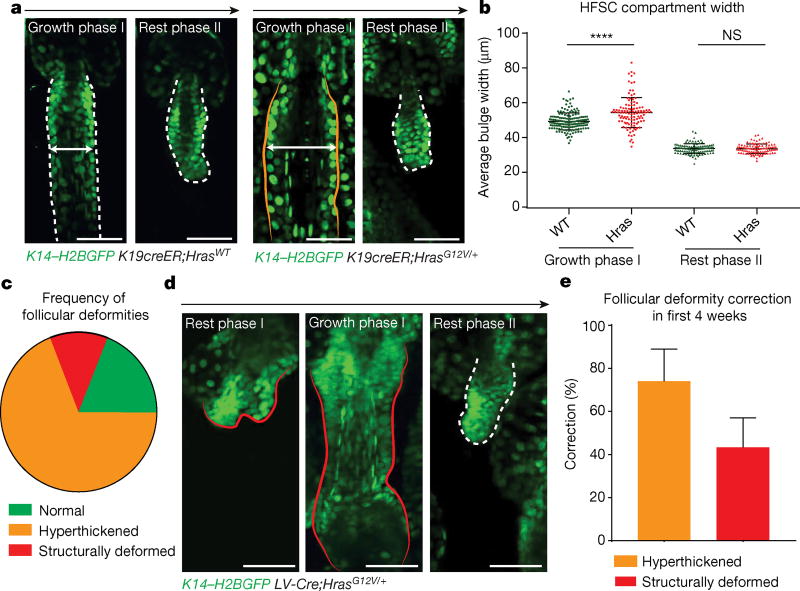
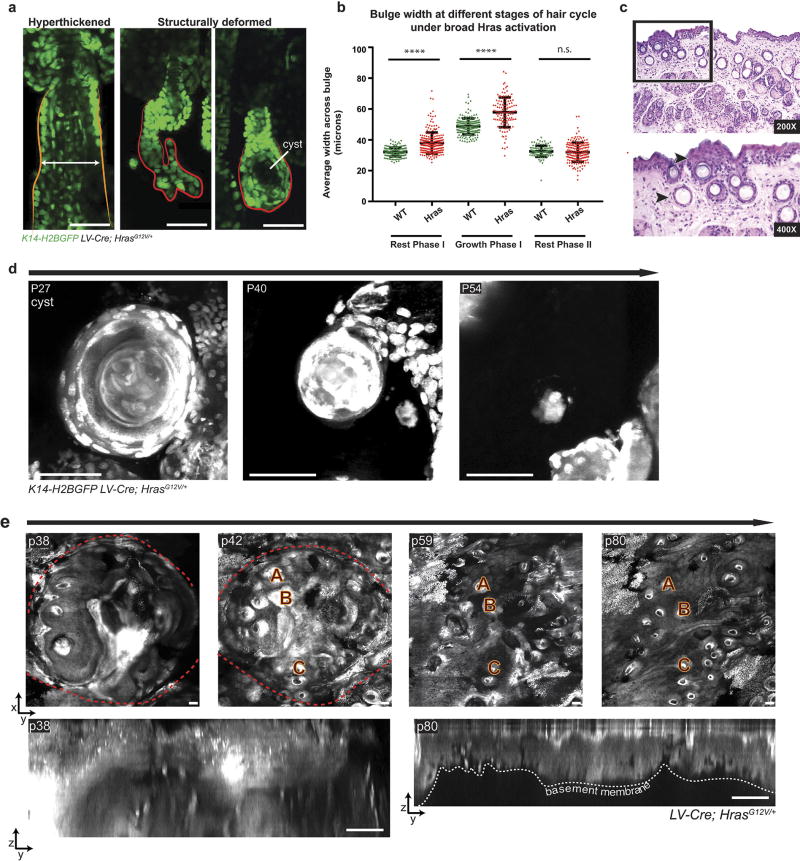
Overall, our results demonstrate the tissue’s surprisingly robust ability to actively correct disruptions to tissue architecture caused by stabilized β-catenin. This prompted us to ask whether this phenomenon is indicative of a general plasticity of the skin. To test this, we turned to a well-established hyperproliferative mutation, HrasG12V (ref. 26). Using the same system that produced ectopic growths within the Wnt/β-catenin system (K19CreER), we activated HrasG12V and tracked mutant follicles over time via intravital imaging. These follicles become significantly hyperthickened compared with wild-type follicles, owing to duplication of both differentiated and undifferentiated layers, yet were corrected over the course of a single 4-week hair cycle (Fig. 4a, b). Next, we delivered lentiviral-Cre through in utero injection27–29 to induce oncogenic Hras expression throughout the skin epithelium. Increased induction of Hras-mutant cells resulted in a range of deviations to the tissue architecture from hyperthickening and structural deformities to large macroscopic skin growths, all of which demonstrated the capacity to resolve over time (Fig. 4c–e and Extended Data Fig. 9).
Figure 4. Tissue correction occurs in mutant Hras model.
K14–H2BGFP labels epithelial nuclei (green). a, Representative hyperthickened K19creER;HrasG12V hair follicle. b, Quantification of HFSC compartment width during hair follicle growth and rest phases (mean ± s.e.m., number of hair follicles 267 wild type, 214 Hras, 3 mice per genotype, ****P < 0.0001). c, Phenotypes in LV-cre HrasG12V broad activation model (59% hyperthickened, 31% normal, and 10% structurally deformed (n = 264 follicles, three mice)). d, Representative Hras hair follicle lacking the lower stem-cell compartment corrects over time. e, Frequency of deformity correction in hyperthickened (n = 189, three mice) and structurally deformed (n = 38, three mice) follicles during a single hair cycle (mean ± s.e.m.).
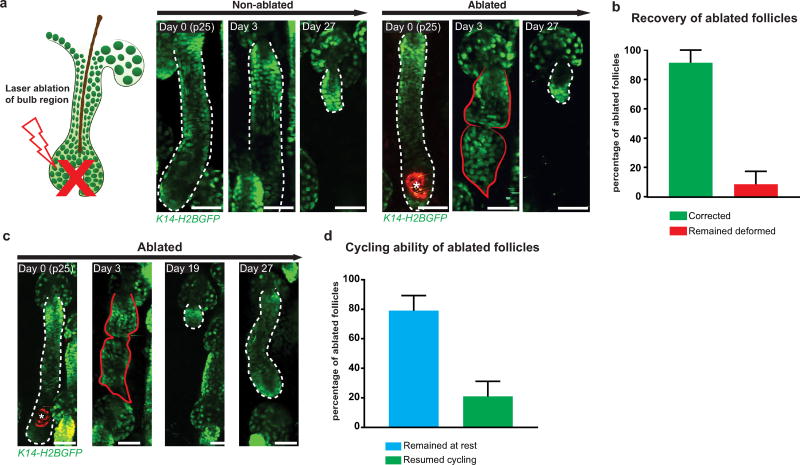
While these results show the phenomenon of correction is not specific to a single mutation, we took our understanding a step further by testing whether mutation-independent deformations to tissue architecture could also be corrected. To accomplish this, we disrupted the bulb region of the hair follicle, which has well-established roles in the establishment and maintenance of proper hair follicle architecture, using targeted two-photon laser ablation. Post-ablation, all ablated follicles adopted a deformed structure, which subsequently regressed. Overall, 92% of ablated follicles were able to return to a normal structure (Extended Data Fig. 10). Altogether, these data demonstrate that the remarkable ability of the skin to correct aberrancies to tissue architecture is conserved among different mutations as well as mutation-independent insults.
In summary, these results reveal an unanticipated plasticity of homeostasis in adult skin, causing us to reconsider how a tissue copes with aberrant behaviours of mutant cells. Such dynamic tolerance could be advantageous to highly regenerative tissues and/or those facing constant insults, raising the possibility that this plasticity could be used in tissues beyond the skin. Our findings further bring forth the exciting prospect that our tissues may have innate mechanisms for battling tumours in their earliest stages. Future mechanistic investigations may identify both the regulators of this described plasticity that are lost as tissues progress to malignancy, and the key genes and pathways that might be reactivated in tumours to promote innate resolution during therapeutic intervention.
Methods
No statistical methods were used to predetermine sample size. The experiments were not randomized. The investigators were not blinded to allocation during experiments and outcome assessment.
Mice
K19creER mice30 were bred to β-catnflox(Ex3)/+ mice9 and Hrasflox/G12V mice26 to generate K19creER;β-catnflox(Ex3)/+ and K19creER;Hrasflox/G12V mice respectively. Lgr6creER;β-catnflox(Ex3)/+ mice were bred to β-catnflox(Ex3)/+ mice9 to generate Lgr6creER;β-catnflox(Ex3)/+ mice. K14–H2BGFP31 and K14–H2BmCherry31 transgenic mice were used for visualization of epithelial cells with the two-photon microscope. Reporter lines used to visualize cre-recombination, Gt(ROSA)26Sortm14(CAG-tdTomato) (tdTomato reporter line)17, Gt(ROSA)26Sortm4(ACTB-tdTomato–eGFP)Luo/J (mTmG), and TcfLef–H2BGFP (Wnt reporter line)18, as well as Wlsfl/fl (ref. 20), tetO-Cdkn1b21, and K14-rtTA22 mice, were obtained from The Jackson Laboratory. Mice of either gender from experimental and control groups were randomly selected for live imaging experiments. No blinding was done. All procedures involving animal subjects were performed under the approval of the Institutional Animal Care and Use Committee of the Yale School of Medicine. The maximal tumour dimensions of 1 cm3 permitted by the Committee were not reached in any of the experiments.
Tamoxifen induction of mice
For low-dose experiments, K19creER; β-catnflox(Ex3)/+;tdTomato mice, Lgr6creER;β-catnflox(Ex3)/+;tdTomato;mTmG mice, K19creER;β-catnflox(Ex3)/+tdTomato;Wlsfl/fl mice, and K19creER;β-catnflox(Ex3)/+tdT omato;K14rtTA;tetO-Cdkn1b mice were given a single dose of 200 µg tamoxifen dissolved in corn oil (Sigma) at postnatal day 20 by intraperitoneal injection. For single-cell induction, mice were administered a single dose of 10 µg tamoxifen. For high-dose experiments, Lgr6creER;β-catnflox(3)/+;mTmG mice were administered a single dose of 2 mg tamoxifen. For K19creER;Hrasflox/G12V experiments, mice were administered a single dose of 2 mg tamoxifen. All time courses began 3 days upon induction (day 0).
Doxycycline administration to mice
For proliferation inhibition experiments, K19creER;β-catnflox(3)/+;tdTomato;K14–H2BGFP;K14rtTA;tetO-Cdkn1b mice were given doxycycline (2 mg ml−1) in water with 2% sucrose beginning at day 5 (post-tamoxifen induction) until the end of the time course.
Lentiviral production and in vivo viral transductions
Lentiviral-Cre production and concentration and in vivo viral transduction was performed as previously described27–29.
In vivo imaging
Imaging procedures followed those previously described4, 5, 16, 32. An LaVision TriM Scope II (LaVision Biotec) microscope equipped with a Chameleon Vision II (Coherent) two-photon laser (940 nm for live imaging of GFP, 880 nm for whole-mounts) and a Chameleon Discovery (Coherent) two-photon laser (1,120 nm for live imaging of tdTomato) was used to acquire z-stacks of about 90–200 µm (3 µm serial optical sections) using either a ×20 or ×40 water immersion lens (numerical aperture 1.0; Olympus), scanned with a field of view of 0.3–0.5 mm2 at 800 Hz. Mice were imaged at time points after tamoxifen treatment, viral transduction, or laser ablation as indicated. To revisit the same hair follicles over time, organizational clusters of hair follicles and vasculature were used as landmarks to identify the region using the ×4 objective, then switched to higher objectives for imaging.
Laser ablations
Targeted two-photon laser ablations were performed as previously described4, 32. Briefly, during imaging, a 900 nm laser beam was used to scan the target bulb region and 60–80% laser power was applied for ~1 s. Ablation parameters were adjusted accordingly depending on the depth of the targeted anagen follicle (120–180 µm).
Image analysis
Raw image stacks were imported into ImageJ (NIH Image) or IMARIS (BitPlane Scientific Software) for analysis. Optical planes from time-lapse acquisitions were aligned in IMARIS to compensate for minor tissue z-shift during the acquisition. Selected optical planes or z-projections of sequential optical sections were used to assemble time-lapse movies. To quantify follicular bulge width, the average of five measurements randomly taken across the bulge of each follicle was calculated using ImageJ.
Immunohistochemistry and whole-mount staining
Ear and tail whole-mount tissues were processed as previously described33, 34 with the following modifications. Ear tissue was incubated in primary and secondary antibodies for ~66 h each at room temperature. Primary antibodies used were as follows: rabbit anti-β-catenin (1/500, Abcam, ab6302), rabbit anti-Ki67 (1/300, Leica Novocastra, NCL-Ki67p; 1/200, Abcam, ab15580), rabbit anti-Gata3 (1/250, Abcam, ab199428), goat anti-Pcad (1/100, R&D Systems, AF761). Secondary antibodies used were as follows: anti-rabbit Alexa488, anti-rabbit Alexa568, and anti-rabbit Alexa633 (all 1/200, Life Technologies, A21206/A10042/A2071). Oil Red O (Sigma) staining was performed by conventional methods, with a working concentration of 0.18% and stained for 20 min.
Histology
Backskin was 10% formalin-fixed paraffin-embedded and used for histological analysis. Paraffin-embedded skin tissues were cut at 5 µm. To show skin morphology, sections were stained with haematoxylin and eosin using standard protocols.
RNA analyses
The RNA was prepared from total ear skin and isolated with an RNeasy Fibrous Tissue Mini Kit (74704, Qiagen) according to the manufacturer’s instructions. RNA was retrotranscribed into cDNA using a Superscript III First-Strand Synthesis System (18080-051, Life Technologies). Quantitative reverse transcribed PCR reactions were performed using a Viia7 Real-Time Machine System (Applied Biosystems). A total of 20 ng of cDNA was used for each reaction with Fast Start SYBR Green Master Mix (Roche). To detect the β-catnflox(Ex3) allele, the following primer set was used: forward, TGA AGC TCA GCG CAC AG; reverse, CAT GCC CTC ATC TAG CGT C. Gene expression analysis was conducted using the ΔΔCT method and glyceraldehyde-3-phosphate dehydrogenase (GAPDH) as a housekeeping gene. Each sample was run in triplicate per run across two runs.
Data availability statement
The authors declare that the main data supporting the findings of this study are available within the paper and its supplementary information. Any additional data are available from the corresponding authors upon request.
Extended Data
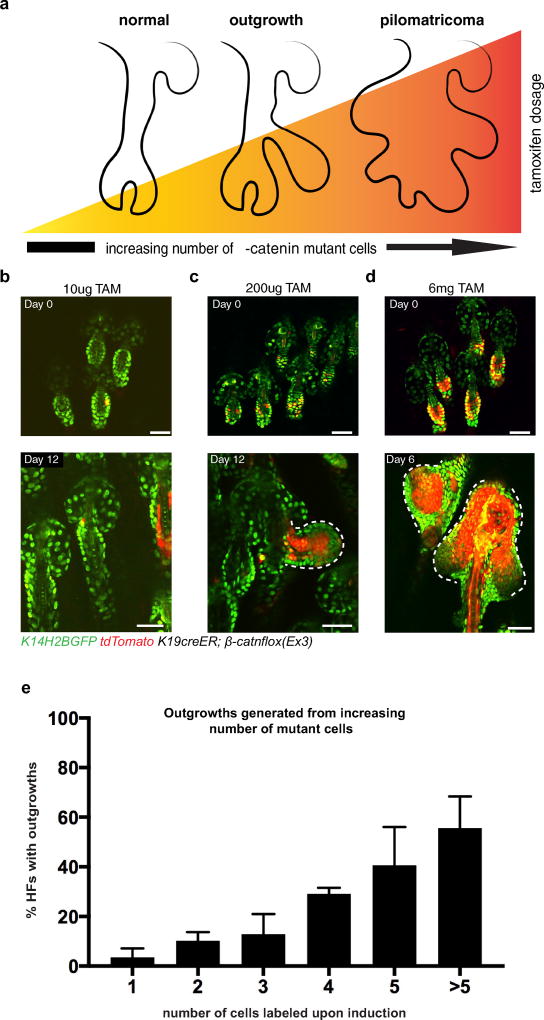
Extended Data Figure 1. Increasing the number of mutant cells increases the severity of aberrancies.
a, Diagram of the increasing severity of aberrancies that develop as the tamoxifen dosage (and number of mutant cells) increases. b–d, Representative hair follicles induced with increasing amounts of tamoxifen (TAM), upon induction (top), and their resulting phenotype (bottom): b, 10 µg of tamoxifen results in morphologically normal hair follicles with no outgrowths; c, 200 µg of tamoxifen induces about 3–15 recombined cells out of the roughly 80 HFSCs in the resting hair follicles, results in outgrowths; d, 6 mg of tamoxifen (1 mg of tamoxifen per day for 6 days) results in the formation of tumours. e, Quantification of outgrowths that arise from increasing number of labelled cells (mean ± s.e.m., n = 285 hair follicles in four mice). Scale bars, 50 µm.
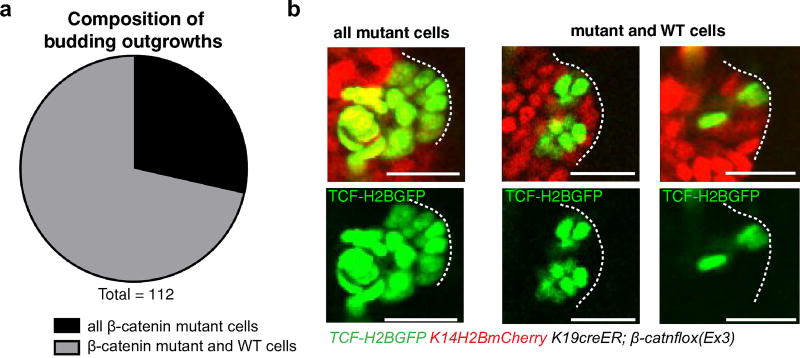
Extended Data Figure 2. Developing mutant outgrowths are largely composed of a mixture of mutant and wild-type cells.
a, Percentage distribution of new bud composition, with 71% of developing outgrowths made up of a mixture of mutant and wild-type cells (n = 112 new buds across three mice). b, Representative budding outgrowths in tamoxifen-treated (200 µg) K19creER;β-catnflox(ex3) mice. All epithelial nuclei are labelled with K14–H2BmCherry (red). Nuclei of mutant cells are labelled with TCF–H2BGFP (green). All scale bars, 50 µm.
Extended Data Figure 3. Small population of mutant cells can generate a varying number of outgrowths that regress.
a, Wide-field view of emerging outgrowths. b, Outgrowth frequency per hair follicle generated by a small population of mutant cells (n = 718 hair follicles across three mice). c, Diagram of outgrowth regression.
Extended Data Figure 4. Mutant β-catenin cells differentiate and are subsequently lost from the tissue.
a, Whole-mount β-catenin immunofluorescence staining (blue) showing increased nuclear β-catenin staining corresponds to the Cre and Wnt fluorescent reporters. b, β-Catenin whole-mounts. tdTom+ cells (red) along the core of the outgrowth express higher levels of β-catenin (green). c, Revisits of the same outgrowth, showing the progressive elimination of the mutant core (TCF–H2BGFP, green). Epithelial nuclei are labelled with K14–H2BmCherry (red). d, Reverse transcribed PCR quantification of mRNA expression of the floxed mutant β-cateninΔex3 allele, normalized to GAPDH, during the development and regression of outgrowths (mean ± s.e.m., n = 3 mice per time point, ****P < 0.0001). e, Whole-mount Ki67 staining. f, Mitotic events in tdTomato negative (tdTom−) and positive (tdTom+) cells, during different outgrowth stages (mean ± s.e.m., n = 150 outgrowths across three mice). g, Revisit of a single outgrowth showing the morphologically differentiated core (arrowheads, left) that is expelled from the tissue over time (right). h, Whole-mount staining of inner root sheath differentiation marker Gata3 (ref. 35) co-localizes with mutant core labelled with tdTomato (left) and TCFH2BGFP (right). Scale bars, 50 µm.
Extended Data Figure 5. Apoptosis and cell extrusion occurs during both growth and regression of aberrancies.
a, Quantifications of different cellular behaviours occurring during growth and regression (mean ± s.e.m.). b, Representative outgrowths during growth (top, lower left) and regression (lower right) showing nuclear fragmentation, a morphological hallmark of apoptosis, pseudocoloured pink. c, Examples of outgrowths during growth (top) and regression (bottom) showing epithelial cells extruded into the dermis (pseudocoloured green). d, Revisits of extruded cells in the dermis, showing cells become undetectable over time. e, Quantifications showing the amount of time cells are detectable in the dermis once extruded. All scale bars, 50 µm.
Extended Data Figure 6. Outgrowths with limited contribution of wild-type cells develop into proliferative cysts.
a, K19creER; B-catnflox(Ex3);tdTomato Wlsfl/fl whole-mount of Ki67 staining. b, K19creER;β-catnflox(Ex3);K14rtTA;cdkn1b whole-mount of Ki67 staining. c, Haematoxylin and eosin image of K19creER;β-catnflox(Ex3) backskin at low- (left) and high-power (right) magnifications. d, Haematoxylin and eosin image of backskin from K19creER;β-catnflox(Ex3);Wlsfl/fl showing the formation of small follicular cysts at low- (left) and high-power (right) magnification. e, Haematoxylin and eosin image of backskin from K19creER;β-catnflox(Ex3);K14rtTA;cdkn1b showing a dilated follicular cyst at low- (left) and high-power (right) magnifications. All scale bars, 50 µm.
Extended Data Figure 7. Endogenous and ectopic cellular behaviours are used in the regression of the outgrowth.
Diagram of observed cellular behaviours during the growth and regression of the outgrowths.
Extended Data Figure 8. Remaining cells from regressed outgrowths can develop into functional appendages.
a, Revisits of the same outgrowth in the non-cycling compartment. K14–H2BGFP labels epithelial nuclei (green). The non-hair cycling compartment is outlined in white. The cycling hair follicle, out of focal plane at later time points, is represented by a white dotted line. Insets show elimination of mutant core (tdTomato, red). b, Quantification of the phases of growth and regression of the outgrowths from the hair cycling epithelium of tamoxifen-treated (200 µg) Lgr6creER;β-catnflox(Ex3)/+;tdTomato;mTmG;K14–H2BGFP mice (mean ± s.e.m.). Pre-phenotypic plot accounts for hair follicles before the development of outgrowths to demonstrate variability in timing of formation (n = 33 outgrowths in three mice). c, Quantification of the two different fates of non-cycling epithelial outgrowths 173 days after induction (n = 24 outgrowths). d, Revisits from a tamoxifen-treated (200 µg) Lgr6creER;β-catnflox(Ex3)/+;tdTomato;mTmG;K14–H2BGFP mouse showing that, after the mutant core has differentiated out of the tissue (left), the remaining nodule of cells has converted into an extranumerary hair follicle. Subsequent revisits capture the representative extranumerary follicle in the early stage of catagen (centre) and telogen (right). e, Diagram representing the conversion into extranumerary structures. f, Revisits of representative Lgr6creER;β-catnflox(Ex3)/+;tdTomato;mTmG;K14–H2BGFP mouse after the administration of a high-dose (2 mg) of tamoxifen (n = 4 mice). Large benign tumours result in a macroscopic phenotype of severely wrinkled skin (day 21, left and inset) that resolves over time as the outgrowths regress (day 208, right and inset). g, Quantification of the hair follicles with tumours (mean ± s.e.m., n = 803 hair follicles across three mice). h, Quantification of hair follicles with supernumerary sebaceous gland lobes and de novo hair follicles after outgrowth regression (mean ± s.e.m., n = 580 hair follicles across three mice). i, Representative images of normal (left) and extranumerary (right) sebaceous glands present in the tissue 151 days after induction. Normal sebaceous glands are outlined in white, extranumerary structures are outlined in blue. j, Oil Red O staining on tail whole-mounts of Lgr6creER;β-catnflox(Ex3)/+ mouse 1 year after the administration of a high dose (2 mg) of tamoxifen. Note the Oil Red O staining in the extranumerary sebaceous gland lobes, indicating these structures are functional and actively producing lipids. k, Whole-mount Pcad IF staining on Lgr6creER;β-catnflox(Ex3)/+ ear skin 1 year after the administration of a high dose (2 mg) of tamoxifen, showing the extranumerary hair follicle has a Pcad enrichment at the base of the structure, similar to the hair germ of the main axis. All scale bars, 50 µm.
Extended Data Figure 9. Broad Hras activation and mutation-independent systems reveal a wide range of corrective abilities.
a, Representative phenotypes in LV-cre HrasG12V broad activation model (59% are hyperthickened and 10% are structurally deformed). b, Quantification of follicular bulge width demonstrates that Hras follicles are significantly hyperthickened during the first rest (P < 0.0001) and growth phases (P < 0.0001), but that hyperthickening is resolved by the second rest phase (P = 0.0860, n = 492 wild-type follicles, 550 Hras follicles, three mice per genotype). c, Haematoxylin and eosin images demonstrating regions of epidermal hyperplasia (upper arrowhead) and dermal cysts (lower arrowhead). d, Keratinized cyst resolves over time. e, Top: x–y view of macroscopic growth in Hras mouse demonstrates that hyperthickening and hyperkeratinization are resolved in 6 weeks. Hair follicles (A–C) are used as landmarks. Bottom: y–z view of macroscopic growth at starting (p38) and ending (p80) time points (n = 3 regressing macroscopic growths observed in two mice).
Extended Data Figure 10. Non-mutational insult to wild-type follicles can be corrected.
a, Correction of a deformed hair follicle post-ablation (right) compared with its non-ablated counterpart (left). b, Frequency of ablated follicle recovery (mean ± s.e.m., n = 38 follicles in five mice) c, Representative image of an ablated follicle that adopts a deformed structure, corrects it, and begins to cycle again. d, Quantification of the cycling ability of follicles 4 weeks post-ablation revealed 24% of ablated follicles were able to cycle again (mean ± s.e.m., n = 38 follicles in five mice). Asterisks denote region of autofluorescence produced post-ablation. All scale bars, 50 µm.
Supplementary Material
Acknowledgments
We thank K. Cockburn, K. Mesa, and S. Guo for feedback on the manuscript. We thank G. Panse, P. Myung, and C. Ko for assistance with brightfield images and clinical assessment of haematoxylin and eosin sections. We thank G. Gu for K19creER and M. Taketo for β-catnflox(Ex3)/+ mice. This work was supported by The New York Stem Cell Foundation and grants to V.G. by the Edward Mallinckrodt, Jr. Foundation, a Howard Hughes Medical Institute Scholar award, and National Institute of Arthritis and Musculoskeletal and Skin Disease, National Institutes of Health (NIH), grant numbers 5R01AR063663-04 and 1R01AR067755-01A1. The content is the responsibility of the authors and does not necessarily represent the official views of the NIH. S.Br. was supported by the NIH Predoctoral Program in Cellular and Molecular Biology, grant number NIH T32GM007223. C.M.P. was supported by Human Genetics Training Grant NIH T32HD001749 and is currently supported by the National Cancer Institute of the NIH under Award Number F31CA206419. S.P. was supported by a James Hudson Brown - Alexander Brown Coxe Postdoctoral Fellowship and is currently supported by CT Stem Cell Grant 14-SCA-YALE-05. V.G. is a New York Stem Cell Foundation Robertson Investigator. β-catnflox(Ex3) mice are available from M. Taketo under a material transfer agreement with Banyu-Merck. We thank the Marine Biological Laboratory, Woods Hole, Massachusetts, for support while writing this manuscript.
Footnotes
Supplementary Information is available in the online version of the paper.
Author Contributions S.Br., C.M.P., and V.G. designed experiments, analysed data, and wrote the manuscript. S.Br. performed β-catenin imaging, immunohistochemistry, drug treatments, and mouse genetics. C.M.P. performed laser ablations, reverse transcribed PCR, Hras imaging, and viral work. T.X. assisted with β-catenin imaging and manuscript writing. J.B. assisted with immunohistochemistry and mouse genetics. K.S. assisted with clinical assessment and manuscript writing. S.P. assisted with drug delivery. C.M.-M. assisted with viral work. D.G. assisted with data analysis. J.R. provided training on viral work. S.Be. provided tools and feedback on the data and manuscript.
The authors declare no competing financial interests.
References
- 1.Ling G, et al. Persistent p53 mutations in single cells from normal human skin. Am. J. Pathol. 2001;159:1247–1253. doi: 10.1016/S0002-9440(10)62511-4. [DOI] [PMC free article] [PubMed] [Google Scholar]
- 2.Martincorena I, et al. High burden and pervasive positive selection of somatic mutations in normal human skin. Science. 2015;348:880–886. doi: 10.1126/science.aaa6806. [DOI] [PMC free article] [PubMed] [Google Scholar]
- 3.Laurie CC, et al. Detectable clonal mosaicism from birth to old age and its relationship to cancer. Nat. Genet. 2012;44:642–650. doi: 10.1038/ng.2271. [DOI] [PMC free article] [PubMed] [Google Scholar]
- 4.Pineda CM, et al. Intravital imaging of hair follicle regeneration in the mouse. Nat. Protocols. 2015;10:1116–1130. doi: 10.1038/nprot.2015.070. [DOI] [PMC free article] [PubMed] [Google Scholar]
- 5.Rompolas P, et al. Live imaging of stem cell and progeny behaviour in physiological hair-follicle regeneration. Nature. 2012;487:496–499. doi: 10.1038/nature11218. [DOI] [PMC free article] [PubMed] [Google Scholar]
- 6.Clevers H. Wnt/β-catenin signaling in development and disease. Cell. 2006;127:469–480. doi: 10.1016/j.cell.2006.10.018. [DOI] [PubMed] [Google Scholar]
- 7.Liu F, et al. β-Catenin initiates tooth neogenesis in adult rodent incisors. J. Dent. Res. 2010;89:909–914. doi: 10.1177/0022034510370090. [DOI] [PMC free article] [PubMed] [Google Scholar]
- 8.van Amerongen R, Bowman AN, Nusse R. Developmental stage and time dictate the fate of Wnt/β-catenin-responsive stem cells in the mammary gland. Cell Stem Cell. 2012;11:387–400. doi: 10.1016/j.stem.2012.05.023. [DOI] [PubMed] [Google Scholar]
- 9.Harada N, et al. Intestinal polyposis in mice with a dominant stable mutation of the β-catenin gene. EMBO J. 1999;18:5931–5942. doi: 10.1093/emboj/18.21.5931. [DOI] [PMC free article] [PubMed] [Google Scholar]
- 10.Gat U, DasGupta R, Degenstein L, Fuchs E. De novo hair follicle morphogenesis and hair tumors in mice expressing a truncated β-catenin in skin. Cell. 1998;95:605–614. doi: 10.1016/s0092-8674(00)81631-1. [DOI] [PubMed] [Google Scholar]
- 11.Lo Celso C, Prowse DM, Watt FM. Transient activation of β-catenin signalling in adult mouse epidermis is sufficient to induce new hair follicles but continuous activation is required to maintain hair follicle tumours. Development. 2004;131:1787–1799. doi: 10.1242/dev.01052. [DOI] [PubMed] [Google Scholar]
- 12.Kretzschmar K, Weber C, Driskell RR, Calonje E, Watt FM. Compartmentalized epidermal activation of β-catenin differentially affects lineage reprogramming and underlies tumor heterogeneity. Cell Rep. 2016;14:269–281. doi: 10.1016/j.celrep.2015.12.041. [DOI] [PMC free article] [PubMed] [Google Scholar]
- 13.MacDonald BT, Tamai K, He X. Wnt/β-catenin signaling: components, mechanisms, and diseases. Dev. Cell. 2009;17:9–26. doi: 10.1016/j.devcel.2009.06.016. [DOI] [PMC free article] [PubMed] [Google Scholar]
- 14.Chan EF, Gat U, McNiff JM, Fuchs E. A common human skin tumour is caused by activating mutations in β-catenin. Nat. Genet. 1999;21:410–413. doi: 10.1038/7747. [DOI] [PubMed] [Google Scholar]
- 15.Morin PJ, et al. Activation of β-catenin-Tcf signaling in colon cancer by mutations in β-catenin or APC. Science. 1997;275:1787–1790. doi: 10.1126/science.275.5307.1787. [DOI] [PubMed] [Google Scholar]
- 16.Deschene ER, et al. β-Catenin activation regulates tissue growth non-cell autonomously in the hair stem cell niche. Science. 2014;343:1353–1356. doi: 10.1126/science.1248373. [DOI] [PMC free article] [PubMed] [Google Scholar]
- 17.Madisen L, et al. A robust and high-throughput Cre reporting and characterization system for the whole mouse brain. Nat. Neurosci. 2010;13:133–140. doi: 10.1038/nn.2467. [DOI] [PMC free article] [PubMed] [Google Scholar]
- 18.Ferrer-Vaquer A, et al. A sensitive and bright single-cell resolution live imaging reporter of Wnt/β-catenin signaling in the mouse. BMC Dev. Biol. 2010;10:121. doi: 10.1186/1471-213X-10-121. [DOI] [PMC free article] [PubMed] [Google Scholar]
- 19.Augustin I, et al. The Wnt secretion protein Evi/Gpr177 promotes glioma tumourigenesis. EMBO Mol. Med. 2012;4:38–51. doi: 10.1002/emmm.201100186. [DOI] [PMC free article] [PubMed] [Google Scholar]
- 20.Carpenter AC, Rao S, Wells JM, Campbell K, Lang RA. Generation of mice with a conditional null allele for Wntless. Genesis. 2010;48:554–558. doi: 10.1002/dvg.20651. [DOI] [PMC free article] [PubMed] [Google Scholar]
- 21.Pruitt SC, Freeland A, Rusiniak ME, Kunnev D, Cady GK. Cdkn1b overexpression in adult mice alters the balance between genome and tissue ageing. Nat. Commun. 2013;4:2626. doi: 10.1038/ncomms3626. [DOI] [PMC free article] [PubMed] [Google Scholar]
- 22.Xie W, Chow LT, Paterson AJ, Chin E, Kudlow JE. Conditional expression of the ErbB2 oncogene elicits reversible hyperplasia in stratified epithelia and up-regulation of TGFα expression in transgenic mice. Oncogene. 1999;18:3593–3607. doi: 10.1038/sj.onc.1202673. [DOI] [PubMed] [Google Scholar]
- 23.Füllgrabe A, et al. Dynamics of Lgr6+ progenitor cells in the hair follicle, sebaceous gland, and interfollicular epidermis. Stem Cell Rep. 2015;5:843–855. doi: 10.1016/j.stemcr.2015.09.013. [DOI] [PMC free article] [PubMed] [Google Scholar]
- 24.Snippert HJ, et al. Lgr6 marks stem cells in the hair follicle that generate all cell lineages of the skin. Science. 2010;327:1385–1389. doi: 10.1126/science.1184733. [DOI] [PubMed] [Google Scholar]
- 25.Baker CM, Verstuyf A, Jensen KB, Watt FM. Differential sensitivity of epidermal cell subpopulations to β-catenin-induced ectopic hair follicle formation. Dev. Biol. 2010;343:40–50. doi: 10.1016/j.ydbio.2010.04.005. [DOI] [PMC free article] [PubMed] [Google Scholar]
- 26.Chen X, et al. Endogenous expression of HrasG12V induces developmental defects and neoplasms with copy number imbalances of the oncogene. Proc. Natl Acad. Sci. USA. 2009;106:7979–7984. doi: 10.1073/pnas.0900343106. [DOI] [PMC free article] [PubMed] [Google Scholar]
- 27.Endo M, et al. Efficient in vivo targeting of epidermal stem cells by early gestational intraamniotic injection of lentiviral vector driven by the keratin 5 promoter. Mol. Ther. 2008;16:131–137. doi: 10.1038/sj.mt.6300332. [DOI] [PMC free article] [PubMed] [Google Scholar]
- 28.Beronja S, Livshits G, Williams S, Fuchs E. Rapid functional dissection of genetic networks via tissue-specific transduction and RNAi in mouse embryos. Nat. Med. 2010;16:821–827. doi: 10.1038/nm.2167. [DOI] [PMC free article] [PubMed] [Google Scholar]
- 29.Beronja S, Fuchs E. RNAi-mediated gene function analysis in skin. Methods Mol. Biol. 2013;961:351–361. doi: 10.1007/978-1-62703-227-8_23. [DOI] [PMC free article] [PubMed] [Google Scholar]
- 30.Means AL, Xu Y, Zhao A, Ray KC, Gu G. A CK19(CreERT) knockin mouse line allows for conditional DNA recombination in epithelial cells in multiple endodermal organs. Genesis. 2008;46:318–323. doi: 10.1002/dvg.20397. [DOI] [PMC free article] [PubMed] [Google Scholar]
- 31.Tumbar T, et al. Defining the epithelial stem cell niche in skin. Science. 2004;303:359–363. doi: 10.1126/science.1092436. [DOI] [PMC free article] [PubMed] [Google Scholar]
- 32.Mesa KR, et al. Niche-induced cell death and epithelial phagocytosis regulate hair follicle stem cell pool. Nature. 2015;522:94–97. doi: 10.1038/nature14306. [DOI] [PMC free article] [PubMed] [Google Scholar]
- 33.Fujiwara H, et al. The basement membrane of hair follicle stem cells is a muscle cell niche. Cell. 2011;144:577–589. doi: 10.1016/j.cell.2011.01.014. [DOI] [PMC free article] [PubMed] [Google Scholar]
- 34.Fuchs Y, et al. Sept4/ARTS regulates stem cell apoptosis and skin regeneration. Science. 2013;341:286–289. doi: 10.1126/science.1233029. [DOI] [PMC free article] [PubMed] [Google Scholar]
- 35.Kaufman CK, et al. GATA-3: an unexpected regulator of cell lineage determination in skin. Genes Dev. 2003;17:2108–2122. doi: 10.1101/gad.1115203. [DOI] [PMC free article] [PubMed] [Google Scholar]
Associated Data
This section collects any data citations, data availability statements, or supplementary materials included in this article.
Supplementary Materials
Data Availability Statement
The authors declare that the main data supporting the findings of this study are available within the paper and its supplementary information. Any additional data are available from the corresponding authors upon request.


