Abstract
Background:
Retention of movement technique is crucial in anterior cruciate ligament (ACL) injury prevention programs. It is unknown if specific instructions or video instructions result in changes in kinematic and kinetic measures during a relatively short training session, and in a retention test one week later.
Hypothesis/Purpose:
The purpose was to determine the effects of verbal external focus (EF), verbal internal focus (IF) and video instructions (VI) on landing technique (i.e. kinematics and kinetics) during training and retention.
Study Design:
Randomized Controlled Trial.
Methods:
This study compared verbal EF, verbal IF, VI and CTRL group. Forty healthy athletes were assigned to the IF (n=10), EF (n=10), VI (n=10) or CTRL group (n=10). A jump-landing task was performed as a baseline, followed by two training blocks (TR1 and TR2) and a post test. Group specific instructions were offered in TR1 and TR2. In addition, subjects in the IF, EF and VI groups were free to ask for feedback after every jump in TR1 and TR2. One week later, a retention test was conducted without specific instructions or feedback. Kinematics and kinetics were captured using an 8-camera motion analysis system.
Results:
Males and females in the EF and VI instruction group showed beneficial results during and after the training session, in terms of improved landing technique. Retention was achieved after only a short training session.
Conclusion:
ACL injury prevention programs should include EF and/or VI instructions to improve kinematics and kinetics and achieve retention.
Level of Evidence:
3b
Keywords: Injury prevention, motor learning, movement technique, retention
INTRODUCTION
An injury of the ACL is a devastating injury which commonly occurs in sports with a lot of jumping, accelerations and decelerations.1 Ideally, ACL injury prevention programs achieve long-term effects due to improved movement patterns on the field that translates to reduction of ACL injury incidence.2,3 Motor learning is defined as a relative permanent change in movement patterns.3,4 The achievement of motor learning effects as relatively permanent changes is defined as retention.5 For effective ACL injury prevention, learned motor skills needs to become relatively permanent after a certain time interval when no feedback, guidance or instructions are given.3 Attention of athletes during movement activities can be internally focused (IF) or externally focused (EF). An IF of attention indicates that the athlete's attention is directed to body movements, (e.g. ‘focus on flexing your knee’), while an EF of attention indicates that the athlete is focused on the environment and the effect of the movement (e.g. ‘focus on landing as soft as possible’).4 It is suggested that retention of movement technique is superior with an EF compared to an IF.4
Using video instructions is a method used to create an EF.6 When athletes receive video instructions from the example of expert models, they are encouraged to imitate the movements and the mirror neuron system will be triggered.7 Additionally, the focus of video instructions is more on reviewing whole body movement patterns instead of specific components of a movement.8 Self or expert videos have both been found to be effective methods to improve landing technique.9,10,11,12,13 Furthermore, the fact that retention has been achieved after only one short training session of video instructions indicates that the effects were not only immediate and temporary but also relatively permanent.2,13 Therefore, ACL injury prevention programs can be more effective when using video instructions compared to ACL injury prevention programs including only verbal feedback.
Both verbal EF instructions and video instructions result in improved landing technique compared to verbal IF instructions.4,10,11,12,13 However, it has not been investigated if verbal EF instructions and video instructions result in permanent better dynamics in terms of improved landings (i.e. kinematics and kinetics). Therefore, the purpose was to determine the effects of verbal EF, verbal IF and video instructions (VI) on landing technique (i.e. kinematics and kinetics) during training and retention. It was hypothesized that the EF and VI groups show improved landing technique in the retention test, compared to the IF and CTRL groups.
METHODS
Participants
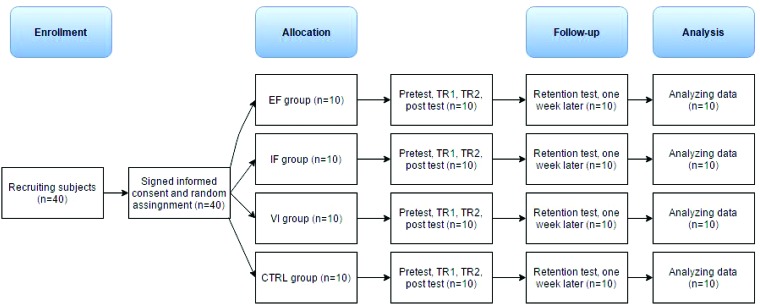
A randomized controlled trial was conducted in a controlled laboratory setting. Forty (twenty males, twenty females) subjects were recruited from local ball team sports clubs in Groningen, the Netherlands. Detailed demographics can be found in Table 1. Enrollment, allocation and testing were conducted by the same author (W.W.), who was not blinded. For inclusion, subjects had to be: 1) ≥ 18 years old and 2) physically active in recreational ball team sports for a minimum of four hours per week. Subjects were excluded if they had any lower extremity injury in the prior six months. Subjects were randomly allocated using MATLAB 6.1 (The MathWorks Inc., Natick, MA) to one of the four groups based on sex, age and length: verbal IF group (n=10), verbal EF group (n=10), video group (VI) (n=10) or the control group with no specific instruction (n=10) (Figure 1). Before testing, all subjects signed an informed consent.
Table 1.
Descriptive of subjects per group (mean±SD).
| EF | IF | VI | CTRL | |
|---|---|---|---|---|
| N | 10 | 10 | 10 | 10 |
| Sex (m/f) | 5/5 | 5/5 | 5/5 | 5/5 |
| Age (years) | 22.60 ± 1.35 | 22.10 ± 2.64 | 22.90 ± 0.57 | 22.40 ± 1.35 |
| Height (m) | 1.80 ± 0.14 | 1.77 ± 0.08 | 1.78 ± 0.10 | 1.83 ± 0.11 |
| Mass (kg) | 72.40 ± 10.38 | 71.10 ± 6.92 | 74.40 ± 17.10 | 78.00 ± 14.79 |
| Sport | Football(3) Handball(3) Basketball(1) Hockey(1) Korfball(1) Volleyball(1) |
Football(5) Volleyball(3) Handball(2) |
Football(3) Handball(3) Basketball(2) Korfball(1) Volleyball(1) |
Volleyball(4) Football(3) Basketball(1) Handball(1) Hockey(1) |
EF = external focus group; IF = internal focus group; VI = video group; CTRL = control group.
Figure 1.
CONSORT flow chart, including data analysis.
EF = external focus; IF = internal focus; VI = video; CTRL = control group; TR1 = training block 1; TR2 = training block 2
Procedures
Collecting expert data
In the current study, expert videos of the jump-landing task of athletes with optimal jump-landing technique were created before the start of data collection and made available for providing instruction to the VI group (expert modelling). The criteria for the expert videos were based on previous research (Table 2).9,14,15,16 Sex- and size matched expert models were selected for four height ranges (160-170 cm, 170-180 cm, 180-190 cm, 190-200 cm). The expert subjects were all ball team sport players. Before recording the expert jump-landing tasks, general anthropometric measures were taken from the expert subjects. 3D motion capture was used to define the movement of the expert data. Therefore, expert subjects had twenty-one reflective markers of 14 mm in diameter placed according to the Vicon Plug-in-Gait marker set and model. In addition, trunk markers were added to the sternum, clavicle, C7, T10 and right scapula.
Table 2.
Reference scores for the videos of expert jumps used by the VI group.
| Variable | Reference score expert on jump-landing task |
|---|---|
| Knee varus/valgus moment (Nm/kg) | <22.25 (females)13 |
| Knee flexion range (°) | >45 (males & females)17 |
| Peak vGRF (N/kg) | ≤59.15 (males)38 / ≤ 17.90 (females)14,15 |
Nm = Newton meter; Kg = kilogram; °=degrees; Peak vGRF = vertical peak ground reaction force; N = Newton.
Collecting subject data
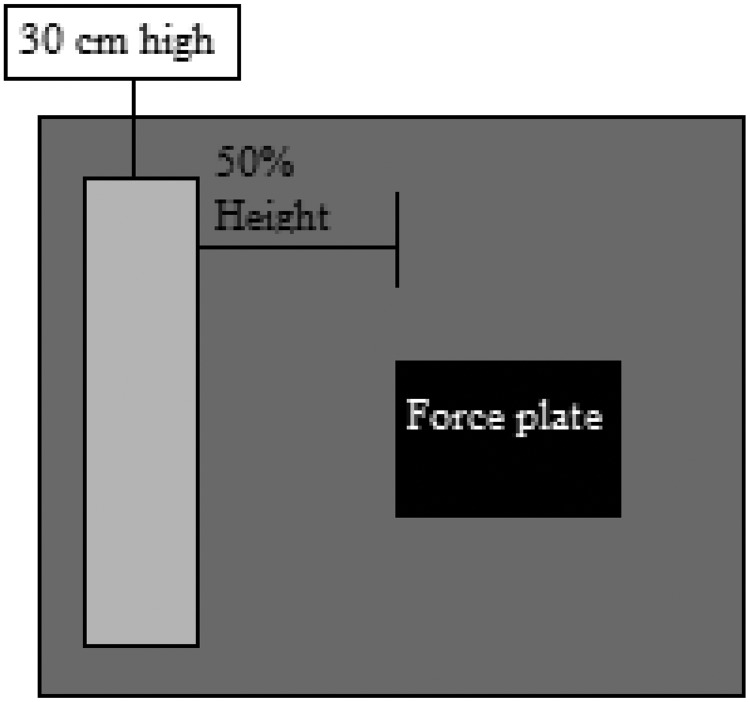
The jump-landing test protocol used in the current study is the same as previously reported.13,16 Before testing, anthropometric measures of all subjects were taken followed by the placement of 21 reflective markers of 14 mm (in diameter) placed according to the Vicon Plug-in-Gait marker set with additional trunk markers on the sternum, clavicle, C7, T10 and right scapula. The marker placement was followed by a static calibration. Subjects performed a five-minute warm-up on a stationary bike followed by three squats, three lunges per leg and three vertical jumps. After the warm-up, subjects received a general instruction of the jump-landing task and practiced the jump-landing task three times to get familiar with the task. Subjects jumped from a 30-cm high box to a distance of 50% of their height away from the box, down to the two force plates on the ground, and immediately rebounded for a maximal vertical jump on landing (Figure 2).16 Subjects were instructed to jump as high as possible after they landed from the box.17
Figure 2.
Subjects jumped from a 30-cm high box to a distance of 50% of their height away from the box, down to the two force plates on the ground, and immediately rebounded for a maximal vertical jump on landing as originally described in the Landing Error Scoring System procedures.
3D motion capture was used during a pretest of five jumps (baseline), two training blocks of ten jumps each (TR1 and TR2), a post test of five jumps directly after the training sessions and a retention test of five jumps one week later. Group specific instructions were given after the pretest, and repeated after every five jumps.13 An overview of the instructions can be found in Table 3. The EF group were instructed to pay attention to the environment and the effect of the movement (“push yourself as hard as possible off the ground after landing on the force plate”) while the IF group received instructions related to the subject's body (“extend your knees as rapidly as possible after the landing on the force plate”). The VI group watched an expert video on a television screen (LG, Flatron 65VS10-BAA) before the two training blocks. Both the EF instructions, IF instructions and expert video instructions were repeated after every five jumps. The goal for the VI group was to imitate the expert video as best they could. Subjects in the CTRL group did not receive any group specific instructions but only received the general instruction before data collection.
Table 3.
Overview of the instructions given to the different groups.
| General instruction | Pretest | Instructions | TR1 & TR2 | Posttest | Retention test | |
|---|---|---|---|---|---|---|
| EF | Jump as high as possible after you have landed off the box | 5 DVJ's | Push yourself as hard as possible off the ground after landing on the force plate | 2 × 10 DVJ's with self-controlled feedback (LESS score) & group specific instruction after every 5 trials | 5 DVJ's | 5 DVJ's |
| IF | Jump as high as possible after you have landed off the box | 5 DVJ's | Extend your knees as rapidly as possible after the landing on the force plate | 2 × 10 DVJ's with self-controlled feedback (LESS score) & group specific instruction after every 5 trials | 5 DVJ's | 5 DVJ's |
| VI | Jump as high as possible after you have landed off the box | 5 DVJ's | You will see a video of an expert jump. Try to imitate the jump as best you can | 2 × 10 DVJ's with self-controlled feedback (LESS score) & group specific instruction after every 5 trials | 5 DVJ's | 5 DVJ's |
| CTRL | Jump as high as possible after you have landed off the box | 5 DVJ's | N.A. | 2 × 10 DVJ's | 5 DVJ's | 5 DVJ's |
EF = external focus; IF = internal focus; VI = video instruction; CTRL = control group; DVJ = drop vertical jump; TR1 = training block 1; TR2 = training block 2.
Additionally, subjects in the IF, EF and VI group were free to ask feedback during the training blocks (TR1 and TR2) after every jump. This form of feedback is called self-controlled feedback and is suggested to influence the motor learning process because it is more tailored to the subjects’ needs,18 which results in enhanced intrinsic motivation during the jump-landing task.18,19 The feedback consisted of their real time Landing Error Scoring System (LESS) score (range 0-15) of that respective jump.20 Total LESS scores were provided but no further details were mentioned. Before testing, subjects were told that a lower total LESS score implied an improved landing technique. The CTRL group could not ask for feedback during the measurements. After one week, a retention test was done. No group specific instructions or feedback was given during the retention test.
Data analysis
Kinematic data were collected using an 8-camera motion analysis system at 200 Hz (Vicon Motion Analysis Systems Inc., Oxford, UK and Vicon Nexus software (version 1.8.3, Oxford, UK)). The 8-camera analysis motion system has shown to be highly reliable (ICC=0.998) with a standard error of measurement (SEM) of 1.83 ° in the measurement of complex dance movements,21 making it suitable for use as criterion measure. Furthermore, good measurement accuracy as well as high test and retest repeatability have been previously reported.22,23 Ground reaction force (GRF) data was collected using two force plates sampled at 1200 Hz (Bertec Corporation, Columbus, Ohio) and entered in software (Vicon Nexus software). The force plates were located within a custom-built flooring system in which the force plates are flush with the floor.
Primary outcome variables were vertical GRF (vGRF), knee valgus moment, knee flexion moment and maximal knee flexion angles. All variables are expressed at peak external valgus/varus moment. Moments are expressed as external moments normalized to body weight. Jump-landing tasks were analyzed of all included subjects (n = 10 IF, n = 10 EF, n = 10 VI, n = 10 CTRL) for the dominant leg (D) and the non-dominant leg (ND). For the vGRF, only the data of the dominant leg was used. Customized software using MATLAB 6.1 (The MathWorks Inc., 220 Natick, MA) was written and used to compute segmental kinematics and kinetics for both legs. Force plate and kinetic data were filtered using a fourth-order zero-lag Butterworth low-pass filter at 10 Hz.
Statistical analysis
With an effect size (ES) of 0.25 (medium effect ANOVA) and an alpha of 0.05, a power of 0.80 was reached with 40 subjects.24 G*Power for Windows, Version 3.1.7. was used to calculate the required sample size. Hence, 10 subjects were allocated to the EF, IF, VI and CTRL group respectively. Assumptions for normality of distribution for all variables were checked. Assumptions of homogeneity of variance and sphericity were also validated for the use of analysis of variance (ANOVA). To determine differences between groups (EF, IF, VI and CTRL), time (pretest, TR1, TR2, posttest and retention test) and sex (female and male), two 4x5 MANOVA's were used followed by post hoc comparisons (Bonferroni). To determine correlation between the outcome variables, a Pearson correlation analysis was conducted. Based on number of subjects and pooled standard deviation, effect sizes (ES) were calculated for all significant comparisons. Cohen's d values are reported as a measure of ES, where 0.2 ≤ d ≤ 0.5, 0.5 ≤ d ≤ 0.8 and d ≥ 0.8 represent a small, moderate and large effect, respectively.25
RESULTS
No significant differences were found in baseline kinetics and kinematics between groups for both males and females.
Males
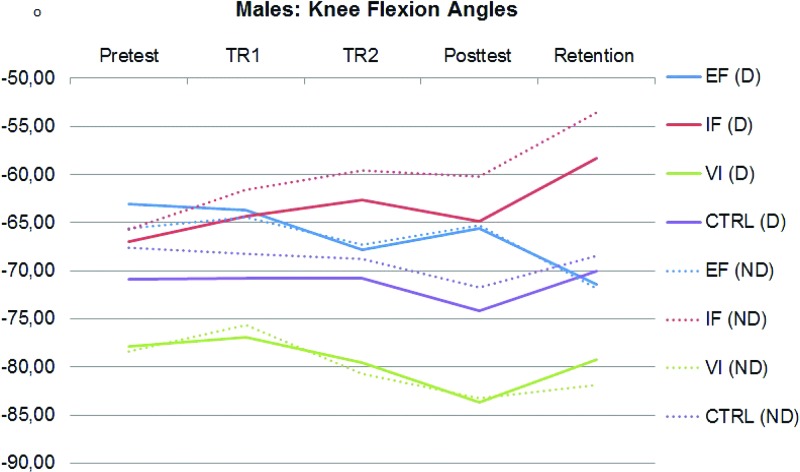
For males, between group analysis showed significantly greater knee flexion angles in the ND leg at the posttest (p=0.021, ES=2.590) and retention (p=0.019, ES=2.152) in the VI group, compared to the IF group.
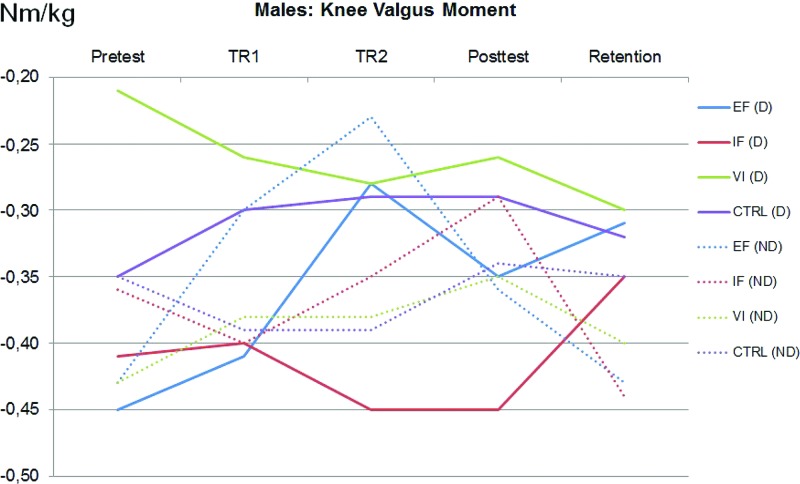
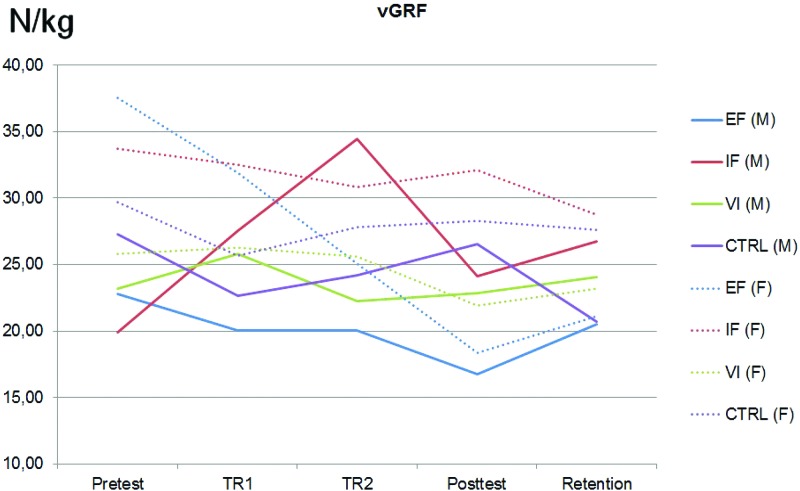
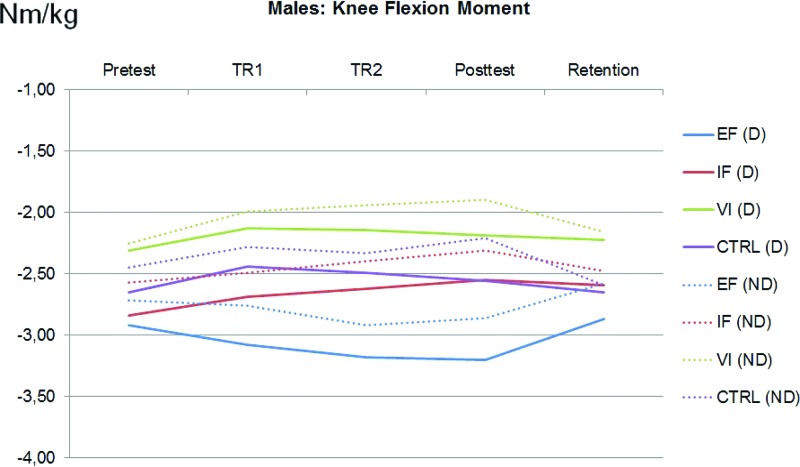
Males in the EF group showed significantly greater knee flexion angles in the ND leg during at the retention trial compared to the posttest (p=0.048, ES=0.631) (TABLE 4, FIGURE 3). Furthermore, males in the EF group showed a significantly smaller knee valgus moment in the D leg at the posttest compared to TR1 (p=0.050, ES=0.416) and in the ND leg at TR2 compared to the pretest (p=0.003, ES=2.629) (FIGURE 7). Males in the IF group showed significantly greater knee flexion angles in the ND leg at the pretest compared to TR2 (p=0.043, ES=0.572). Additionally, a significantly greater knee flexion moment was found in the ND leg at the pretest compared to the posttest (p=0.040, ES=0.703) and a significant greater knee valgus moment in the ND leg was found at the TR2 compared to the posttest (p=0.024, ES=0.788). Furthermore, vGRF analysis showed significantly smaller vGRF at pretest compared to retention (p=0.007, ES=1.550) (FIGURE 9). Males in the VI group showed significantly greater knee flexion angles in the D leg at the posttest compared to TR1 (p=0.008, ES=1.221) and showed significantly greater knee flexion angles in the D leg at the posttest compared to TR2 (p=0.030, ES=0.356). Furthermore, a significantly greater knee flexion moment at the pretest in the D leg was found compared to the posttest (p=0.037, ES=0.688) (FIGURE 5). Additionally, a significant smaller knee valgus moment in the D leg was found at the pretest compared to retention (p=0.019, ES=1.508).
Table 4.
Kinetic and kinematic data per group for males (mean ± SD).
| Knee Flexion Angle ND(°) | Knee Flexion Angle D (°) | Knee Flexion Moment ND (Nm/kg) | Knee Flexion Moment D (Nm/kg) | Knee Valgus Moment ND | Knee Valgus Moment D (Nm/kg) | vGRF(N/kg) | ||
|---|---|---|---|---|---|---|---|---|
| EF | Pretest | −65.61 ± 14.40 | −63.10 ± 15.06 | −2.72 ± 0.84 | −2.92 ± 0.88 | −0.43 ± 0.12 | −0.45 ± 0.20 | 22.79 ± 9.20 |
| TR1 | −64.43 ± 16.53 | −63.68 ± 16.40 | −2.76 ± 1.22 | −3.08 ± 1.08 | −0.30 ± 0.09 | −0.41 ± 0.14 | 20.03 ± 4.56 | |
| TR2 | −67.31 ± 15.99 | −67.83 ± 14.73 | −2.92 ± 1.44 | −3.18 ± 1.20 | −0.23 ± 0.08 | −0.28 ± 0.20 | 20.05 ± 4.14 | |
| Posttest | −65.30 ± 13.58 | −65.56 ± 12.48 | −2.86 ± 1.51 | −3.20 ± 1.63 | −0.36 ± 0.16 | −0.35 ± 0.18 | 16.74 ± 6.62 | |
| Retention | −71.79 ± 8.96 | −71.43 ± 10.40 | −2.58 ± 0.94 | −2.87 ± 1.06 | −0.43 ± 0.12 | −0.31 ± 0.09 | 20.48 ± 8.82 | |
| IF | Pretest | −65.69 ± 10.85 | −66.98 ± 10.07 | −2.57 ± 0.48 | −2.84 ± 0.51 | −0.36 ± 0.06 | −0.41 ± 0.14 | 19.87 ± 5.24 |
| TR1 | −61.58 ± 9.31 | −64.30 ± 9.61 | −2.49 ± 0.40 | −2.69 ± 0.44 | −0.40 ± 0.08 | −0.40 ± 0.15 | 27.51 ± 11.08 | |
| TR2 | −59.57 ± 12.97 | −62.63 ± 13.93 | −2.40 ± 0.63 | −2.61 ± 0.72 | −0.35 ± 0.08 η | −0.45 ± 0.09 | 34.45 ± 11.40 | |
| Posttest | −60.22 ± 11.77 | −64.85 ± 9.07 | −2.31 ± 0.36 | −2.55 ± 0.96 | −0.29 ± 0.09 | −0.45 ± 0.12 | 24.15 ± 6.71 | |
| Retention | −53.53 ± 18.71 | −58.31 ± 11.36 | −2.48 ± 0.63 | −2.59 ± 0.60 | −0.44 ± 0.13 | −0.35 ± 0.13 | 26.72 ± 4.62 | |
| VI | Pretest | −78.44 ± 10.15 | −77.90 ± 8.56 | −2.25 ± 0.53 | −2.31 ± 0.39 | −0.43 ± 0.07 | −0.21 ± 0.05 | 23.19 ± 11.58 |
| TR1 | −75.64 ± 6.19 | −76.86 ± 7.06 | −1.99 ± 0.44 | −2.13 ± 0.27 | −0.38 ± 0.08 | −0.26 ± 0.09 | 25.82 ± 11.79 | |
| TR2 | −80.68 ± 8.70 | −79.52 ± 7.76 | −1.94 ± 0.34 | −2.14 ± 0.32 | −0.38 ± 0.08 | −0.28 ± 0.09 | 22.26 ± 9.31 | |
| Posttest | −83.30 ± 7.75 | −83.64 ± 8.43 | −1.90 ± 0.38 | −2.10 ± 0.31 | −0.35 ± 0.08 | −0.26 ± 0.10 | 22.82 ± 11.47 | |
| Retention | −81.90 ± 9.18 | −79.24 ± 8.33 | −2.16 ± 0.76 | −2.22 ± 0.68 | −0.40 ± 0.07 | −0.30 ± 0.08 | 24.07 ± 10.08 | |
| CTRL | Pretest | −67.63 ± 8.60 | −70.89 ± 7.99 | −2.45 ± 0.52 | −2.65 ± 0.59 | −0.35 ± 0.06 | −0.35 ± 0.14 | 27.25 ± 9.35 |
| TR1 | −68.24 ± 11.22 | −70.80 ± 10.79 | −2.28 ± 0.88 | −2.44 ± 0.70 | −0.39 ± 0.12 | −0.30 ± 0.10 | 22.68 ± 5.72 | |
| TR2 | −68.82 ± 9.50 | −70.74 ± 1104 | −2.33 ± 0.71 | −2.49 ± 0.74 | −0.39 ± 0.15 | −0.29 ± 0.08 | 24.21 ± 4.76 | |
| Posttest | −71.74 ± 8.39 | −74.12 ± 10.13 | −2.21 ± 0.33 | −2.56 ± 0.63 | −0.34 ± 0.16 | −0.29 ± 0.17 | 26.51 ± 7.94 | |
| Retention | −68.46 ± 12.55 | −70.07 ± 14.24 | −2.59 ± 0.93 | −2.65 ± 0.71 | −0.35 ± 0.19 | −0.32 ± 0.08 | 20.70 ± 7.90 |
EF = external focus group; IF = internal focus group; VI = video group; CTRL = control group; TR1 = training block 1; TR2 = training block 2; ND = non-dominant leg; D = dominant leg; ° = degrees; Nm = Newton meter; vGRF = vertical ground reaction force; N/kg = Newton/kilogram. Data are expressed as mean values ± SD. A bracketed connection between sessions indicates a significant difference between these sessions.
Figure 3.
Graphical representation of knee flexion angles (°) in males.
° = degrees; D = dominant leg; ND = non-dominant leg; EF = external focus group; IF = internal focus group; VI = video group; CTRL = control group; TR1 = training block 1; TR2 = training block 2.
Figure 7.
Graphical representation of knee valgus moments (Nm/kg) in males.
Nm = Newton meter; kg = kilogram; D = dominant leg; ND = non-dominant leg; EF = external focus group; IF = internal focus group; VI = video group; CTRL = control group; TR1 = training block 1; TR2 = training block 2.
Figure 9.
Graphical representations of vGRF (N/kg) values in males and females.
N = Newton; kg = kilogram; vGRF = vertical ground reactions force; EF = external focus group; IF = internal focus group; VI = video group; CTRL = control group; TR1 = training block 1; TR2 = training block 2.
Figure 5.
Graphical representation of knee flexion moments (Nm/kg) in males.
Nm = Newton meter; kg = kilogram; D = dominant leg; ND = non-dominant leg; EF = external focus group; IF = internal focus group; VI = video group; CTRL = control group; TR1 = training block 1; TR2 = training block 2.
No significant differences were found for the males in the CTRL group between the different time point analyses.
Females
For females, no significant difference were found between groups, prior to interventions.
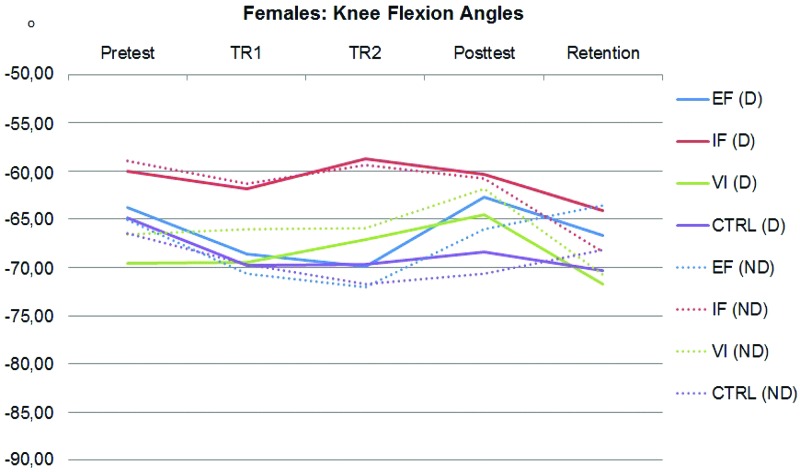
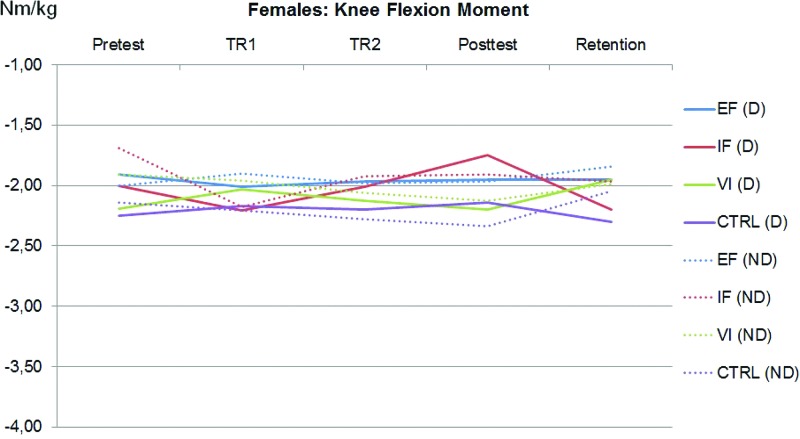
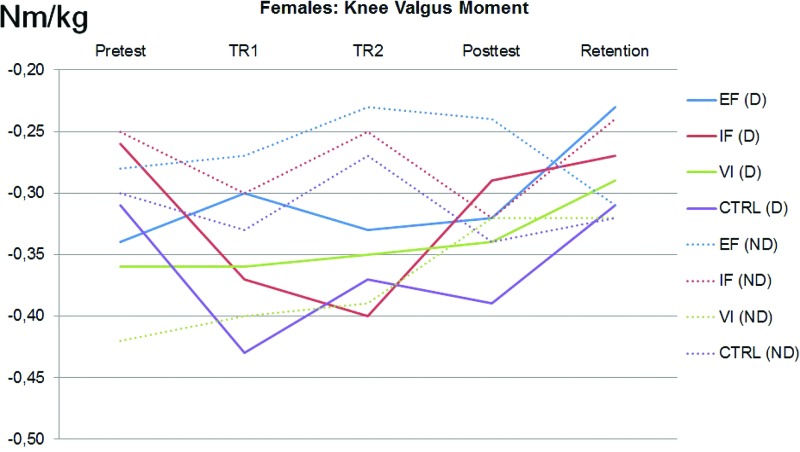
Females in the EF group showed a significantly smaller knee valgus moment in the D leg at retention compared to the posttest (p=0.034, ES=1.001) (TABLE 5). Furthermore, females in the EF group showed significant smaller vGRF in TR2 (p=0.044, ES=0.692) and the posttest (p=0.050, ES=1.167) compared to the pretest. Females in the IF group showed a significant greater knee valgus moment in the ND leg at the posttest compared to retention (p=0.039, ES=0.595). Females in the VI group showed significant greater knee flexion angles in the ND leg at retention compared to the posttest (p=0.008, ES=1.274) (FIGURE 4). Furthermore, a significant greater knee flexion moment in the D leg at TR2 was found compared to retention (p=0.023, ES=0.370) (FIGURE 6) and a significant greater knee valgus moment was found in the ND leg at TR2 compared to the posttest (ND; p=0.031, ES=0.460) (FIGURE 8). Additionally, vGRF analysis for females in the VI group showed significant smaller vGRF in the posttest compared to TR1 (p=0.031, ES=0.356) (FIGURE 9).
Table 5.
Kinetic and kinematic data per group for females (mean ± SD).
| Knee Flexion Angle ND(°) | Knee Flexion Angle D(°) | Knee Flexion Moment ND (Nm/kg) | Knee Flexion Moment D (Nm/kg) | f\nee vaigus∼ Moment ND (Nm/kg) | Knee Valgus Moment D (Nm/kg) | vGRF (N/kg) | ||
|---|---|---|---|---|---|---|---|---|
| EF | Pretest | −65.08 ± 12.42 | −63.80 ± 12.99 | −2.00 ± 0.49 | −1.91 ± 0.67 | −0.28 ± 0.14 | −0.34 ± 0.19 | 37.55 ± 23.38 |
| TR1 | −70.67 ± 11.37 | −68.58 ± 10.10 | −1.90 ± 0.53 | −2.10 ± 0.59 | −0.27 ± 0.09 | −0.30 ± 0.09 | 31.87 ± 22.82 | |
| TR2 | −72.01 ± 13.11 | −69.88 ± 11.99 | −1.98 ± 0.50 | −1.97 ± 0.51 | −0.23 ± 0.07 | −0.33 ± 0.14 | 25.09 ± 16.27 | |
| Posttest | −65.98 ± 10.43 | −62.65 ± 8.51 | −1.97 ± 0.55 | −.95 ± 0.51 | −0.24 ± 0.08 | −0.32 ± 0.11 | 18.39 ± 11.29 | |
| Retention | −63.56 ± 5.38 | −66.62 ± 8.96 | −1.84 ± 0.52 | −1.95 ± 0.59 | −0.31 ± 0.11 | −0.23 ± 0.09 | 21.10 ± 12.55 | |
| IF | Pretest | −58.94 ± 7.06 | −60.05 ± 2.74 | −1.60 ± 0.20 | −2.00 ± 0.40 | −0.25 ± 0.11 | −0.26 ± 0.08 | 33.72 ± 26.23 |
| TR1 | −61.31 ± 6.69 | −61.88 ± 5.86 | −2.18 ± 0.60 | −2.21 ± 0.75 | −0.30 ± 0.10 | −0.37 ± 0.22 | 32.52 ± 12.65 | |
| TR2 | −59.40 ± 7.76 | −58.74 ± 9.70 | −1.92 ± 0.70 | −2.01 ± 0.72 | −0.25 ± 0.08 | −0.40 ± 0.20 | 30.85 ± 7.53 | |
| Posttest | −60.75 ± 9.11 | −60.33 ± 6.19 | −1.91 ± 0.34 | −1.75 ± 0.38 | −0.32 ± 0.14 | −0.29 ± 0.13 | 32.09 ± 22.31 | |
| Retention | −68.41 ± 9.06 | −64.11 ± 6.96 | −1.97 ± 0.58 | −2.20 ± 0.96 | −2.24 ± 0.16 | −0.27 ± 0.10 | 28.74 ± 15.58 | |
| VI | Pretest | −66.51 ± 10.39 | −69.58 ± 8.34 | −1.91 ± 0.44 | −2.19 ± 0.58 | −0.42 ± 0.18 | −0.36 ± 0.09 | 25.82 ± 19.75 |
| TR1 | −66.05 ± 13.35 | −69.49 ± 14.21 | −1.96 ± 0.54 | −2.03 ± 0.47 | −0.40 ± 0.19 | −0.36 ± 0.07 | 26.27 ± 15.02 | |
| TR2 | −65.89 ± 14.82 | −67.14 ± 16.01 | −2.16 ± 0.80 | −2.13 ± 0.47 | −0.39 ± 0.16 | −0.35 ± 0.11 | 25.58 ± 14.97 | |
| Posttest | −61.89 ± 8.86 | −64.48 ± 9.02 | −2.13 ± 1.11 | −2.20 ± 0.68 | −0.32 ± 0.18 | −0.34 ± 0.09 | 21.88 ± 12.41 | |
| Retention | −70.70 ± 6.41 | −71.73 ± 8.03 | −1.99 ± 0.69 | −1.95 ± 0.59.1 | −0.32 ± 0.08 | −0.29 ± 0.08 | 23.21 ± 11.70 | |
| CTRL | Pretest | −66.47 ± 3.83 | −64.84 ± 5.15 | −2.14 ± 0.74 | −2.25 ± 0.59 | −0.30 ± 0.12 | −0.31 ± 0.11 | 29.71 ± 18.79 |
| TR1 | −69.64 ± 5.97 | −69.76 ± 2.96 | −2.21 ± 0.73 | −2.17 ± 0.56 | −0.33 ± 0.10 | −0.43 ± 0.20 | 25.68 ± 13.91 | |
| TR2 | −71.68 ± 4.40 | −69.71 ± 1.98 | −2.28 ± 0.88 | −2.20 ± 0.72 | −0.27 ± 0.08 | −0.37 ± 021 | 27.79 ± 10.80 | |
| Posttest | −70.59 ± 5.22 | −68.43 ± 4.24 | −2.34 ± 0.74 | −2.14 ± 0.66 | −0.34 ± 0.10 | −0.39 ± 0.18 | 28.28 ± 10.96 | |
| Retention | −68.14 ± 10.30 | −70.33 ± 7.72 | −2.05 ± 0.47 | −2.30 ± 0.52 | −0.32 ± 0.11 | −0.31 ± 0.09 | 27.61 ± 19.82 |
EF = external focus group; IF = internal focus group; VI = video group; CTRL = control group; TR1 = training block 1; TR2 = training block 2; ND = non-dominant leg; D = dominant leg; ° = degrees; Nm = Newton meter; vGRF = vertical ground reaction force; N/kg = Newton/kilogram. Data are expressed as mean values ± SD. A bracketed connection between sessions indicates a significant difference between these sessions.
Figure 4.
Graphical representation of knee flexion angles (°) in females.
° = degrees; D = dominant leg; ND = non-dominant leg; EF = external focus group; IF = internal focus group; VI = video group; CTRL = control group; TR1 = training block 1; TR2 = training block 2.
Figure 6.
Graphical representation of knee flexion moments (Nm/kg) in females.
Nm = Newton meter; kg = kilogram; D = dominant leg; ND = non-dominant leg; EF = external focus group; IF = internal focus group; VI = video group; CTRL = control group; TR1 = training block 1; TR2 = training block 2.
Figure 8.
Graphical representation of knee valgus moments (Nm/kg) in females.
Nm = Newton meter; kg = kilogram; D = dominant leg; ND = non-dominant leg; EF = external focus group; IF = internal focus group; VI = video group; CTRL = control group; TR1 = training block 1; TR2 = training block 2.
No significant differences were found for the females in the CTRL group between different time point analyses.
Correlations
In the males EF group, high positive correlations were found between knee valgus moment and vGRF in TR2 (D; 0.8, p=0.118). In the males IF group, high negative correlations were found between knee flexion moment and vGRF in TR1 (ND; -0.7, p=0.162). In the males VI group, high positive correlations were found between knee flexion angle and knee valgus moment in posttest (ND; 0.7, p=0.177).
In the females EF group, high negative correlations were found between knee flexion angle and vGRF in TR1 (D; -0.9, p=0.058), TR2 (D; -0.9, p=0.055; ND; -0.7, p=0.154), and posttest (D; -0.8, p=0.133). Furthermore, in the males EF group high negative correlations were found between knee flexion moment and knee valgus moment in TR2 (ND; -0.9, p=0.037).
DISCUSSION
The main finding in the current study was that both males and females in the EF group showed an improvement in landing technique during training which was maintained after one week. Furthermore, males and females in the VI group show an improvement in some aspects of landing technique in the retention testing conducted after one week.
Movement patterns became more symmetrical over time, especially in the EF and VI group for both males and females. For example, the absolute difference between the ND and D leg in knee flexion angle for the EF group for males decreased from -2.51 ° in the pretest to -0.36 ° in retention. Furthermore, the difference in knee flexion angle for the VI group for females decreased from -3.07 ° in the pretest to -1.03 ° in retention. Besides more landing symmetry, knee flexion for both legs increased from pretest to retention indicating a softer landing strategy. These findings indicate successful changes in movement technique especially for the EF and VI groups.
Landings with greater knee flexion angles will potentially decrease forces on the ACL and therefore potentially reduce the risk of an ACL injury.26,27 Landing with relatively more extended knees potentially generates greater vGRF than a soft landing, achieved with a more flexed knee. A soft landing with large amounts of knee-joint flexion is more conducive to preventing injury than a stiff-legged landing.26,27 For example, Koga et al analyzed videos of ten ACL injuries and showed that non-contact ACL injuries occurred with a peak knee flexion angle of -47.00 °.28 In the current study, males in the VI group showed significant greater knee flexion angles in the posttest (-83.30 ° ND; -83.64 ° D) and retention (-81.90 ° ND; -79.24 ° D) compared to males in the IF group in the posttest (-60.22 ° ND; -64.85 ° D) and retention (-53.53 ° ND; -58.31 ° D). Additionally, males in the EF group showed significant greater knee flexion angles in retention (-71.79 ° ND; -71.43 ° D) compared to the posttest (-65.30 ° ND; -65.56 ° D) which potentially results in decreased forces on the ACL. Future research should focus on the minimal detectable changes of the used kinematics and kinetics to investigate if the differences found are clinically relevant. Furthermore, a high positive correlation between knee valgus moment and vGRF was found in TR2, indicating a smaller knee valgus moment and smaller vGRF in the training session was achieved when adopting EF instructions. Knee valgus is a risk factor for an ACL injury because knee valgus loading increases the load the ACL.14,15 Also, greater vGRF could result in higher forces in the knee and therefore, an increase of the risk of an ACL injury.29 Females in the EF group showed maintenance of a smaller knee valgus moment in the D leg and smaller vGRF in retention. Additionally, high negative correlations were found between knee flexion angle and vGRF in TR1 and in the posttest, indicating greater flexion angles with smaller vGRF in the training session and posttest which implicates an improved landing technique after adopting EF focus instructions. Although this correlation is not significant, it's highly relevant since the correlation is high. The reason for the non-significant correlations can be due the relatively low power (and low n) of the study.
Males in the IF group showed a decrease in knee flexion angles and a smaller knee flexion moment in the training session. These findings are in line with previous research showing smaller knee flexion angles when adopting an IF focus.30,31 Additionally, high negative correlations were found between knee flexion moment and vGRF in TR1, indicating a smaller knee flexion moment was associated with greater vGRF in TR1. These findings implicate a less favorable landing technique when adopting IF focus instructions. Females in the IF group showed a greater knee valgus moment in the posttest compared to the training session. These results indicate that IF focus instructions resulted in a landing technique with greater ACL injury risk. These findings are in line with previous authors who have investigated the effects of an IF focus during landing.31,32,33
Both males and females in the VI group seemed to learn from watching the expert video indicated by maintenance of greater knee flexion angles in retention. Males showed greater knee flexion angles in the D leg in posttest than in the training session, which was maintained in retention. Females showed greater knee flexion angles in the ND leg in retention compared to the training session and posttest one week earlier. Showing a video in training as instruction is used in other studies resulting in improved landing technique.9,10,11,12 Furthermore, another recent study showed retention after one and four weeks of improved sidestep cutting technique in the males receiving video instructions.2 Coaches and medical staff are encouraged to use video instructions in prevention programs. Additionally, research suggests that a combination of feedback and IF instructions are beneficial in the motor learning process.10,12,34 According to the results of the current study, these prevention programs could be more beneficial by adding EF instructions instead of IF instructions.
Retention is defined as the achievement of learning effects as relatively permanent changes.5 The findings in the present study indicate that the beneficial effects of EF and VI instructions are still present after one week which is crucial in motor learning and implicates that only two short training sessions result in an improved landing technique as demonstrated with the high retention. Current ACL injury prevention programs often show low compliance due the fact that coaches experience these programs as time-consuming without performance enhancement.35,36,37 Since retention was achieved after relatively short training sessions, the use of EF instructions or VI have potential to improve the longer term effectiveness of ACL injury prevention.2,13,29 Barriers such as ‘the effects are too short lasting for the time spent’ might be countered when implementing EF or VI instructions.2,14,36 Additionally, EF or VI instructions in combination with self-controlled feedback is suggested to increase the intrinsic motivation and therefore, positively influence the motor learning process.18,19
Adopting an EF or VI seems to lead to a potentially greater efficiency in movement patterns. One possibility of the beneficial results of automatic control is that motor unit activation is coordinated more effectively with an EF, including relatively little physical and mental effort compared to an IF.5 The findings in the present study are in line with the results of research that used the exact same EF and IF instructions. 13,21,38,39 The beneficial effects of EF and VI instructions are best explained by the constrained-action hypothesis, which suggests that an EF of attention decreases the conscious control in a movement and increases automaticity in the motor control system and therefore performance outcomes will increase. 5,40,41
There are some limitations that should be acknowledged. Retention was only measured after one week. Future research should focus on measuring retention after a longer period of time in order to investigate if possible beneficial effects continue to exist over time. Additionally, future research should focus on the effects of a longer training program with EF and VI instructions to investigate beneficial effects of longer and/or more frequent training programs. Subjects included in this study were free from any lower extremity injury in the prior six months and therefore, a limitation could be that subjects could have had a lower extremity injury before the six-month window, which could have affected the results.
CONCLUSION
The current study showed successful retention of some aspects of improved landing technique after a training with EF or VI instructions in recreational athletes. These findings have potential for ACL injury prevention programs. ACL injury prevention programs should include EF and/or VI instructions to enhance motor learning. Future research should focus on the implementation of EF and/or VI instructions in prevention programs and tracking injury to discern the possible effects on decreasing ACL injuries.
REFERENCES
- 1.Boden BP Dean GS Feagin JA Jr Garrett WE Jr. Mechanisms of anterior cruciate ligament injury. Orthop. 2000;23(6):573-578. [DOI] [PubMed] [Google Scholar]
- 2.Benjaminse A Gokeler A Dowling AV, et al. Optimization of the Anterior Cruciate Ligament Injury Prevention Paradigm: Novel Feedback Techniques to Enhance Motor Learning and Reduce Injury Risk. J Orthop Sports Phys Ther. 2015;45:170-182. [DOI] [PubMed] [Google Scholar]
- 3.Schmidt RA Lee T. Motor learning and performance. 5th ed Champaign, IL: Human Kinetics; 2014. [Google Scholar]
- 4.Wulf G Shea C Lewthwaite R. Motor skill learning and performance: a review of influential factors. Med Ed. 2010;44:75-84. [DOI] [PubMed] [Google Scholar]
- 5.Wulf G. Attentional focus and motor learning: a review of 15 years. Int Rev Sport Exerc Psychol. 2013; 6:77-104. [Google Scholar]
- 6.Benjaminse A Otten E. ACL injury prevention, more effective with a different way of motor learning? Knee Surg Sports Traumatol Arthrosc. 2011;19:622-627. [DOI] [PMC free article] [PubMed] [Google Scholar]
- 7.Rizzolatti G Fogassi L Gallese V. Neurophysiological mechanisms underlying the understanding and imitation of action. Nat. Rev. Neurosci. 2001;2:661–670. [DOI] [PubMed] [Google Scholar]
- 8.Shea CH Wulf G. Enhancing motor learning through external-focus instructions and feedback. Hum Mov Sci. 1999;18:553–571. [Google Scholar]
- 9.Myer GD Stroube BW DiCesare CA, et al. Augmented feedback supports skill transfer and reduces high-risk injury landing mechanics: a double-blind, randomized controlled laboratory study. Am J Sports Med. 2013;41:669-677. [DOI] [PMC free article] [PubMed] [Google Scholar]
- 10.Onate JA Guskiewicz KM Sullivan RJ. Augmented feedback reduces jump landing forces. J Orthop Sports Phys Ther. 2001;31:511-517. [DOI] [PubMed] [Google Scholar]
- 11.Onate JA Guskiewicz KM Marshall SW Giuliani C Yu B Garrett WE. Instruction of jump-landing technique using videotape feedback: altering lower extremity motion patterns. Am J Sports Med. 2005;33:831-842. [DOI] [PubMed] [Google Scholar]
- 12.Parsons JL Alexander MJ. Modifying spike jump landing biomechanics in female adolescent volleyball athletes using video and verbal feedback. J Strength Cond Res. 2012;26:1076-1084. [DOI] [PubMed] [Google Scholar]
- 13.Welling W Benjaminse A Gokeler A Otten B. Enhanced retention of drop vertical jump landing technique: A randomized controlled trial. Hum Mov Sci. 2016;45:84-95. [DOI] [PubMed] [Google Scholar]
- 14.Hewett TE Myer GD Ford KR, et al. Biomechanical measures of neuromuscular control and valgus loading of the knee predict anterior cruciate ligament injury risk in female athletes: a prospective study. Am J Sports Med. 2005;33:492-501. [DOI] [PubMed] [Google Scholar]
- 15.Hewett TE Stroupe AL Nance TA Noyes FR. Plyometric training in female athletes. Decreased impact forces and increased hamstring torques. Am J Sports Med. 1996;24:765-773. [DOI] [PubMed] [Google Scholar]
- 16.Padua DA Marshall SW Boling MC Thigpen CA Garrett WE Beutler AI. The Landing Error Scoring System (LESS) Is a Valid and Reliable Clinical Assessment Tool of Jump-Landing Biomechanics The JUMP-ACL Study. Am J Sports Med. 2009;37:1996-2002. [DOI] [PubMed] [Google Scholar]
- 17.Padua DA DiStefano LJ Beutler AI de la Motte SJ DiStefano MJ Marshall SW. The landing error scoring system as a screening tool for an anterior cruciate ligament injury-prevention program in elite-youth soccer athletes. J Athl Train. 2015;50(6):589-585. [DOI] [PMC free article] [PubMed] [Google Scholar]
- 18.Chiviacowsky S Wulf G de Medeiros FL Kaefer A Wally R. Self-controlled feedback in 10-year-old children: higher feedback frequencies enhance learning. Res Q Exerc Sport. 2008;79:122-127. [DOI] [PubMed] [Google Scholar]
- 19.Andrieux M Danna J Thon B. Self-control of task difficulty during training enhances motor learning of a complex coincidence-anticipation task. Res Q Exerc Sport. 2012;83:27-35. [DOI] [PubMed] [Google Scholar]
- 20.Padua DA Boling MC Distefano LJ Onate JA Beutler AI Marshall SW. Reliability of the landing error scoring system-real time, a clinical assessment tool of jump-landing biomechanics. J Sport Rehabil. 2011;20:145-156. [DOI] [PubMed] [Google Scholar]
- 21.Pfister A West AM Bronner S Noah JA. Comparative abilities of Microsoft Kinect and Vicon 3D motion capture for gait analysis. J Med Eng Technol. 2014;38(5):274-280. [DOI] [PubMed] [Google Scholar]
- 22.Kadaba MP Ramakrishnan HK Wootten ME Gainey J Gorton G Cochran GV. Repeatability of kinematic, kinetic, and electromyographic data in normal adult gait. J Orthop. 1989;7:849-860. [DOI] [PubMed] [Google Scholar]
- 23.McGinley JL Baker R Wolfe R Morris ME. The reliability of three-dimensional kinematic gait measurements: a systematic review. Gait Posture. 2009;29:360-369. [DOI] [PubMed] [Google Scholar]
- 24.Cunningham JB McCrum-Gardner E. Power, effect and sample size using GPower: practical issues for researchers and members of research ethics committees. Evidence Based Midwifery. 2007;5:132-136. [Google Scholar]
- 25.Cohen J. Statistical power analysis for the behavioral sciences. Hillsdale, NJ: Lawrence Erlbaum Associate; 1988. [Google Scholar]
- 26.Devita P Skelly WA. Effect of landing stiffness on joint kinetics and energetics in the lower extremity. Med Sci Sports Exerc. 1992;24:108-115. [PubMed] [Google Scholar]
- 27.McNitt-Gray JL Hester DM Mathiyakom W Munkasy BA. Mechanical demand and multijoint control during landing depend on orientation of the body segments relative to the reaction force. J Biomech, 2011;34:1471-1482. [DOI] [PubMed] [Google Scholar]
- 28.Koga H Nakamae A Shima Y, et al. Mechanisms for noncontact anterior cruciate ligament injuries: knee joint kinematics in 10 injury situations from female team handball and basketball. Am J Sports Med. 2010;38(11):2218-2225. [DOI] [PubMed] [Google Scholar]
- 29.Benjaminse A Welling W Otten B Gokeler A. Novel methods of instruction in ACL injury prevention programs, a systematic review. Phys Ther Sport. 2015;16:176-186. [DOI] [PubMed] [Google Scholar]
- 30.Cowling EJ Steele JR McNair PJ. Effect of verbal instructions on muscle activity and risk of injury to the anterior cruciate ligament during landing. Br J Sports Med. 2003;37:126-130. [DOI] [PMC free article] [PubMed] [Google Scholar]
- 31.Makaruk H Porter JM Czaplicki A Sadowski J Sacewicz T. The role of attentional focus in plyometric training. J Sports Med Phys Fitness. 2012;52:319-327. [PubMed] [Google Scholar]
- 32.Porter JM Nolan RP Ostrowski EJ Wulf G. Directing attention externally enhances agility performance: a qualitative and quantitative analysis of the efficacy of using verbal instructions to focus attention. Front Psychol. 2010;1:216. [DOI] [PMC free article] [PubMed] [Google Scholar]
- 33.Wu WF Porter JM Brown LE. Effect of attentional focus strategies on peak force and performance in the standing long jump. J Strength Cond Res. 2012;26:1226-1231. [DOI] [PubMed] [Google Scholar]
- 34.Etnoyer J Cortes N Ringleb SI Van Lunen BL Onate JA. Instruction and jump-landing kinematics in college-aged female athletes over time. J Athl Train. 2013;48:161-171. [DOI] [PMC free article] [PubMed] [Google Scholar]
- 35.Irmischer B Harris C Pfeiffer R DeBeliso M Adams K Shea K. Effects of a knee ligament injury prevention exercise program on impact forces in women. J Strength Cond Res. 2004;18:703-707. [DOI] [PubMed] [Google Scholar]
- 36.Myklebust G. Engebretsen L Braekken IH Skjolberg A. Olsen OE Bahr R. Prevention of anterior cruciate ligament injuries in female team handball players: a prospective intervention study over three seasons. Clin J Sport Med. 2003;13:71-78. [DOI] [PubMed] [Google Scholar]
- 37.Pfeiffer RP Shea KG Roberts D Grandstrand S Bond L. Lack of effect of a knee ligament injury prevention program on the incidence of noncontact anterior cruciate ligament injury. Bone Joint J. 2006;88:1769-1774. [DOI] [PubMed] [Google Scholar]
- 38.Gokeler A Benjaminse A Welling W Alferink M Eppinga P Otten B. The effects of attentional focus on jump performance and knee joint kinematics in patients after ACL reconstruction. Phys Ther Sport. 2015;16:114-120. [DOI] [PubMed] [Google Scholar]
- 39.Porter JM Anton PM Wikoff NM Ostrowski JB. Instructing skilled athletes to focus their attention externally at greater distances enhances jumping performance. J Strength Cond Res. 2013;27:2073-2078. [DOI] [PubMed] [Google Scholar]
- 40.McNevin NH Wulf HG Carlson C. Effects of attentional focus, self-control, and dyad training on motor learning: implications for physical rehabilitation. Phys Ther. 2000;80:373–385. [DOI] [PubMed] [Google Scholar]
- 41.Masters RSW. Knowledge, ‘‘knerves’’ and know-how: the role of explicit versus implicit knowledge in the breakdown of a complex motor skill under pressure. Br J Sports Med.1992; 83:343-358. [Google Scholar]


