Abstract
Background/Purpose:
The Selective Functional Movement Assessment (SFMA) is a clinical model used to assist diagnosis and treatment of musculoskeletal disorders by identifying dysfunctions in movement patterns. Based on the premise that addressing movement dysfunction is associated with an improvement in patient outcomes, the validity of the SFMA would be strengthened by observed improvement in self-reported function being associated with change in movement patterns. The purpose of this study was to explore the validity of the SFMA by determining if a correlation exists between a change in self-reported outcome measures and attributes of the assessment.
Methods:
Eighty-five clinical subjects (20.3 ± 1.6 years) were administered the Patient-Specific Functional Scale and one of four region-specific outcome measures followed by the SFMA top-tier movements. When deemed appropriate for discharge or following six weeks of therapy by an independent physical therapist, each subject repeated the outcome measures and was re-evaluated on the top-tier tests by the same initial assessor who was blinded to the subject's self-reported outcomes. Correlations between changes in outcome measures, number of painful movements and measures of movement quality (number of dysfunctional movements and criterion scores) were calculated with Spearman rank correlation coefficients. Subjects were analyzed as a consolidated group and by each region based on primary complaint.
Results:
Fair to good positive correlations between improvements in self-reported outcomes and decreases in the number of painful patterns were noted for the complete dataset and for those with shoulder girdle and lumbopelvic complaints (rs = 0.28, 0.52, and 0.41, respectively). Subjects with lumbopelvic complaints demonstrated fair positive correlations with improvements in self-reported outcomes and decreases in the number of dysfunctional patterns (rs = 0.41 and 0.46). No correlations between changes in outcome measures and criterion score were observed.
Conclusion:
Improvements in self-reported outcome measures were associated with fewer painful movement patterns of the SFMA. Improvements in self-reported function were not related to changes in movement quality, except for subjects presenting with lumbopelvic complaints.
Level of Evidence:
2b
Keywords: Functional movement, outcome measures, Selective Functional Movement Assessment (SFMA), validity
INTRODUCTION
Traditional models of physical assessment and treatment in the rehabilitation setting are typically focused on pathoanatomic modes of examination. These models are based upon identifying a structural abnormality or pathology that is the most likely cause of a patient's pain and dysfunction.1 However, there are many examples in the literature of patients presenting with high levels of pain and disability, but no significant identifiable anatomic pathology.2-4 Likewise, multiple authors have demonstrated large numbers of asymptomatic individuals with diagnostically confirmed anatomic abnormalities in the spine,5-7 hip,8 shoulder,9,10 and knee.11,12
The pathoanatomic model is useful and accurate in many situations, particularly in cases involving acute or traumatic musculoskeletal injury. If a patient presents with recent fracture or muscle strain, the pain being experienced is in large part due to the damaged tissue and inflammatory processes caused by the injury. But when considering the common presence of asymptomatic anatomic abnormalities and the occurrence of pain in the absence of abnormal findings, a case can be made for incorporation of a pathokinesiologic model of evaluation. A pathokinesiologic model refers to an evaluation focused on the identification of movement impairments as potential contributors to a patient's pain and dysfunction.1 A reliable and valid clinical movement assessment may identify contributing factors to a patient's pain and dysfunction that have not been identified by other regionally-focused means of examination.1,13
Various methods exist for comparing an individual's fundamental movement patterns to established standards. The Functional Movement Screen™ (FMS™; Functional Movement Systems™, www.FunctionalMovement.com) is one of these tools, and is designed for use with healthy individuals. The FMS™ has demonstrated acceptable reliability14-16 and is often utilized as part of a comprehensive physical performance assessment.17-21 However, most patients presenting to a physical therapy clinic are already in pain, and pain has been shown to have deleterious effects on movement patterns.22-25 Therefore, movement assessments for healthy subjects may not have the same clinical utility for individuals presenting for evaluation and treatment of pain and dysfunction.
The Selective Functional Movement Assessment (SFMA; Functional Movement Systems™, www.FunctionalMovement.com) is a tool aimed at integrating the concepts of posture, muscle balance, and fundamental movement patterns in the practice of musculoskeletal rehabilitation.13 Designed for a clinical population, the SFMA compares a patient's movements against a baseline set of movement standards and ranks their quality and provocation of symptoms.13 Using video observation of healthy subjects, Glaws et al. demonstrated SFMA reliability from substantial to poor depending on the level of clinician experience and scoring method used.26 Dolbeer et al. demonstrated moderate or better reliability of the assessment using live and video observation of symptomatic subjects.27 Pilch et al. noted a correlation between the SFMA and patient self-reported outcome measures for patients with cervical spine pain.28
In the literature review, no studies were found investigating the correlation of patient self-reported outcomes to performance of the SFMA across multiple body regions. If a movement-based assessment is a valid means of evaluating a patient's musculoskeletal pain or dysfunction, it could reasonably be expected that a change in a patient's self-reported functional status would result in some level of change in the patient's movement patterns. Determining a relationship between these variables is one of the first steps to establishing the validity of a clinical assessment tool such as the SFMA. Therefore, the purpose of this prospective observational study was to explore the validity of the SFMA by determining if a correlation exists between a patient's performance of the SFMA and the self-reported outcome measures of pain, function, and disability for cervicothoracic, shoulder girdle, lumbopelvic, and lower extremity complaints. The hypothesis for this study was that a change in self-reported outcome measures would be correlated with a change in SFMA movement quality assessment.
METHODS
This study involved a convenience sample of subjects recruited from patients who reported to a direct-access outpatient physical therapy clinic for evaluation of musculoskeletal pain (United States Military Academy, West Point, NY). Eligibility criteria for subjects in the study is presented in Table 1. Following consent, each subject completed an intake data sheet that asked the subject's demographic and injury history information.
Table 1.
Eligibility criteria for subjects considered for the study
| Inclusion | Exclusion |
|---|---|
| Male or female | Musculoskeletal surgery in previous 6 months |
| Age 18-40 | Self-reported pregnancy |
| Musculoskeletal pain ≥ 2 weeks | Participants not fluent in english |
| NPRS rating ≤ 4/10 at rest | CONDITION That resulted in musculoskeletal surgery during the study period |
| Active duty military and Department of Defense beneficiaries | Pain found to be due to fracture or non-musculoskeletal cause |
Abbreviations: NPRS, numeric pain rating scale.
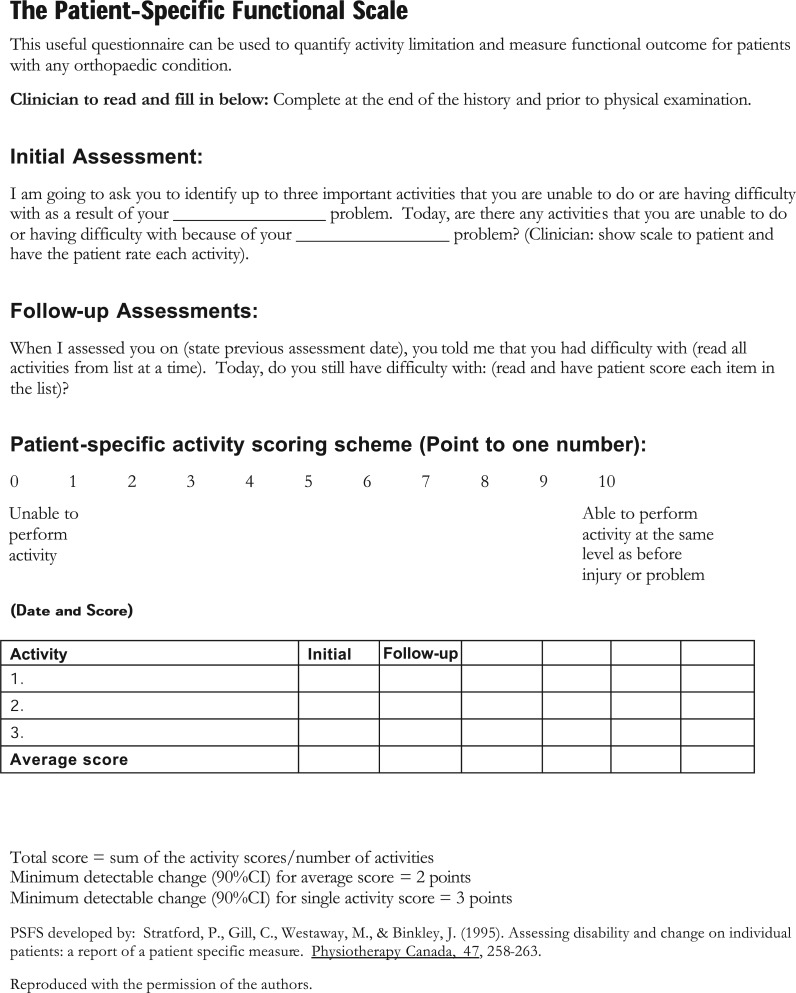
Subjects were administered the Patient-Specific Functional Scale (PSFS) and one of four region-specific self-reported outcome measures by the treating physical therapist. The PSFS was the primary patient self-reported outcome of interest, with the region-specific self-reported outcome measure as a secondary patient self-reported outcome of interest.
The PSFS is a self-reported, patient-specific measure designed to assess functional change, primarily in patients presenting with musculoskeletal disorders. Patients are asked to identify up to five important activities they are unable to perform or are having difficulty with as a result of their problem. Each of these activities is then rated by the patient on an 11-point scale to indicate the level of difficulty associated with performing it, where 0 indicates an inability to perform the activity and 10 indicates that there is no difficulty associated with the activity.29 For this study, subjects reported three activities that were impacted as a result of their primary complaint. The PSFS has demonstrated good reliability and validity across multiple body regions with a minimum clinically important difference (MCID) of 1.3 to 2.3 points dependent on the body region being assessed.30,31
Region-specific outcome measures were used in a manner that allocated each subject into one of four groups based on the location of his or her primary area of complaint. Data from subjects presenting with more than one region of pain or dysfunction were collected based on the region he or she chose as the most limiting region. The region-specific outcome measures used were the Neck Disability Index (NDI) for complaints involving the cervical spine and thoracic spine, the Quick Disabilities of the Arm, Shoulder and Hand (QuickDASH) for complaints involving the shoulder region, the Oswestry Disability Index (ODI) for complaints involving the lumbopelvic region, and the Lower Extremity Functional Scale (LEFS) for complaints involving the hip region and all parts of the lower extremity distal to it. Each of these measures has been described in detail elsewhere, and shown to be reliable and valid.32-39 Table 2 summarizes the region-specific outcome measures used with associated MCIDs.
Table 2.
Region-specific outcome measures and associated minimum clinically important differences (MCID).
| Body Region | Self-Reported Outcome Measure | Scale | MCID |
|---|---|---|---|
| Cervicothoracic Spine | Neck Disability Index (NDI) | 0-100%* | 19% |
| Shoulder Girdle | Quick Disabilities of the Arm, Shoulder, and Hand (QuickDASH) | 0–100%* | 8% |
| Lumbopelvic | Oswestry Disability Index (ODI) | 0–100%* | 11% |
| Lower Extremity | Lower Extremity Functional Scale (LEFS) | 0–80† | 9 |
higher scores indicate higher levels of disability.
higher scores indicate lower levels of disability.
The intake questionnaire also asked the subject to rate his or her pain in the previous 24 hours at rest and at its worst using the Numeric Pain Rating Scale (NPRS). The NPRS is an 11-point scale which measures a subject's subjective report of pain intensity. The scale has criteria that range from 0 (no pain) to 10 (worst possible pain). This scale has demonstrated good reliability and validity when assessing the intensity of pain, and has a MCID of 2 points.40-42
Following administration of intake paperwork, one of two assessors independently observed each subject perform the top-tier movements of the SFMA. One assessor had received 64 cumulative hours of formal training in administration of the SFMA; the second received 32 cumulative hours of formal training. Both assessors were physical therapists certified in use of the SFMA. SFMA certification requires completion of a 16-hour SFMA didactic and laboratory course and a passing score on the SFMA certification exam.
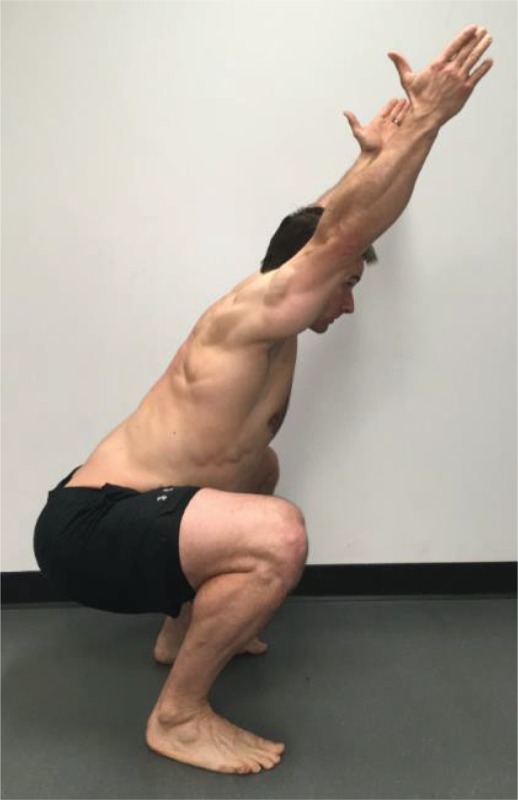
The top-tier tests consist of 10 movements for the head and neck, the upper extremities, a toe touch pattern, backwards bending, full-body rotation, single leg stance, and deep squatting. In the authors’ experience with SFMA education courses, these movements have been counted as either 7, 10, or 15 patterns depending on how they are grouped. The notation of 10 movements was used throughout this research in order to be consistent with the instructions and scoring sheets provided in the appendices. Examples of each movement with the verbal instructions given to each subject are provided in Appendix A. Subjects were not informed of the grading criteria and were provided with the same verbal instructions for each of the tests. All subjects performed the SFMA in shorts and bare feet. With the exceptions of the single leg stance and deep squat, all movements were performed with the feet together. Male subjects performed the movements without a shirt. Female subjects performed the movements in a tank top or sports bra, or in the absence of appropriate clothing were asked to adjust their shirts so that the spine and scapulae could be clearly visualized by the observer. The top-tier tests were performed by each subject with no warm-up or preparation beforehand.
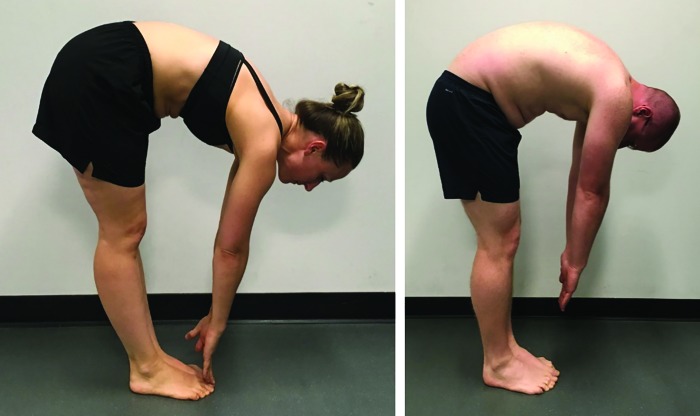
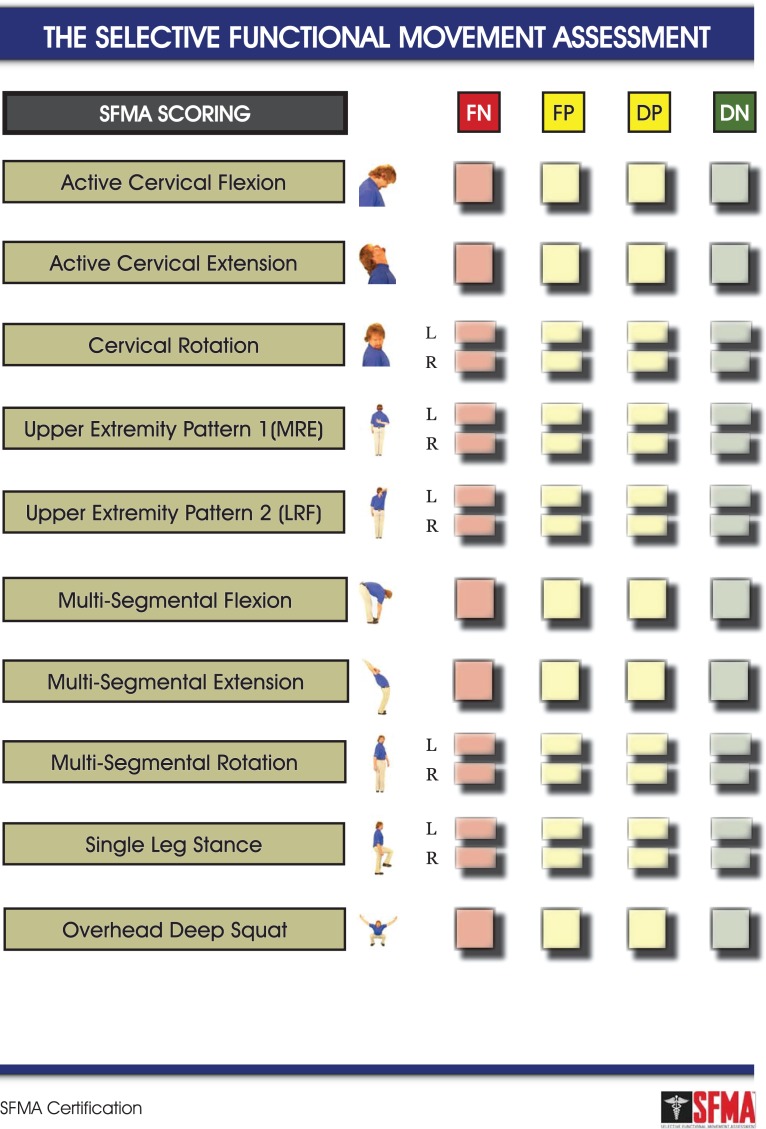
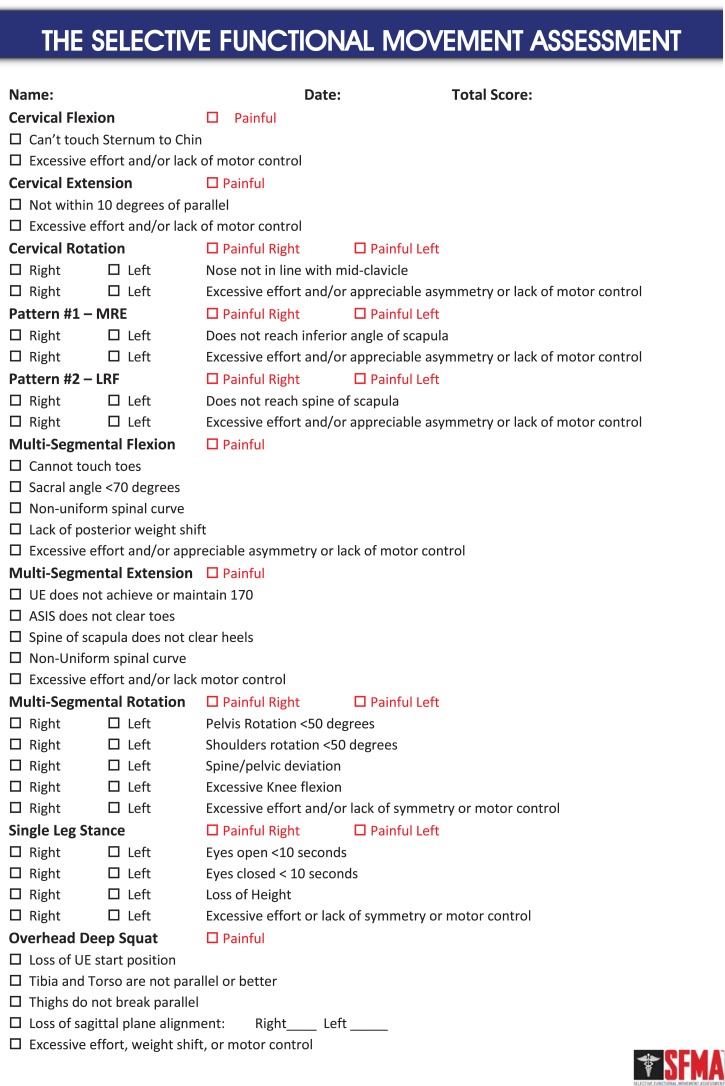
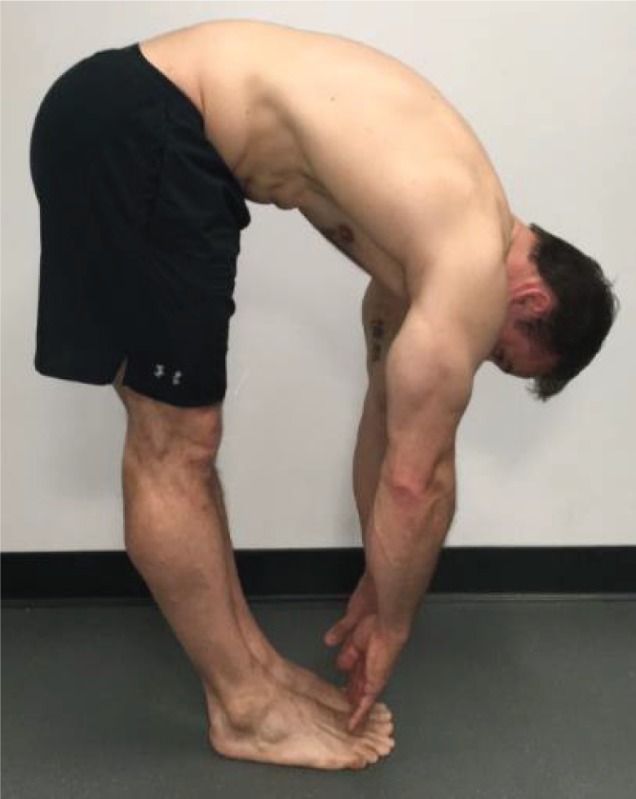
Subjects were scored on the SFMA top-tier movements using both a categorical scale and a criterion-based scale (Appendices B and C). Use of the categorical scoring tool requires the observer to assign one of four labels to each movement pattern based on movement quality criteria and whether pain is experienced during the movement. Scoring options are Functional Non-painful (FN), Functional Painful (FP), Dysfunctional Non-painful (DN) and Dysfunctional Painful (DP). The criterion-based checklist scoring tool requires the observer to assign an ordinal scale rating to each top-tier movement based on the same quality criteria as the categorical scoring tool. A score of zero indicates perfect performance without compensation for all movements. A score of 50 indicates failure of all criteria. To demonstrate an example of differences in pattern performance, the multisegmental flexion component of the top-tier tests with associated scoring of the pattern is presented in Figure 1.
Figure 1.
Demonstration of two multi-segmental flexion patterns of the Selective Functional Movement Assessment (SFMA). Figure 1A would be scored as Functional Non-Painful (FN) using the categorical scoring scale (Appendix B) and a 0 on the criterion scale (Appendix C). Figure 1B would be scored Dysfunctional Non-Painful (DN) using the categorical scoring scale and a score of 3 on the criterion scale for inability to touch the toes, a sacral angle of less than 70 degrees from vertical, and excessive effort in performing the movement.
Following intake data collection, the subjects were independently evaluated by a treating physical therapist who was not present for the assessment of the SFMA top-tier performance. The assessors provided results of the assessment to the treating physical therapist. The final assessment was conducted after six weeks of physical therapy or when the treating physical therapist deemed the patient to be appropriate for discharge, whichever occurred sooner. At the final data collection visit, the treating physical therapist administered the PSFS using the same three activities identified at intake and the region-specific outcome measure. The same assessor who performed the initial SFMA observed the subject perform the top-tier tests of the SFMA for the final assessment. The assessor was blinded to the results of patient self-reported data and specific course of treatment administered by the treating physical therapist. Subjects who required treatment beyond six weeks of rehabilitation continued to receive the standard of care until deemed appropriate for discharge.
DATA ANALYSIS
From previous research on correlation sample size estimates, a sample of 79 subjects was needed to determine a correlation coefficient of 0.75 with a 95% confidence interval half width of 0.10.43 To account for potential drop-outs, the intent was to recruit a sample of 100 subjects.
Data analysis was completed using R statistical software package “Rcmdr” version 2.2-5 (R Foundation; Vienna, Austria). The total number of dysfunctional patterns and the total number of painful patterns observed in the SFMA at both intake and final assessment were calculated. Comparisons of intake to final assessment values of PSFS, regional outcome measures, number of dysfunctional and painful patterns, and SFMA criterion scores were conducted using Wilcoxon signed-ranks tests. These comparisons were calculated for the consolidated dataset and for each of the four body regions examined. Change in outcome measure scores were normalized such that a positive change indicated an improvement in perceived function, such as a decrease in ODI or an increase in LEFS. Improvement in movement parameters was defined as a decrease in the number of painful patterns, dysfunctional patterns, or the SFMA criterion score.
Relationships between both changes in measures of movement quality (number of dysfunctional patterns and criterion score on the SFMA) and presence of pain during movement (number of painful patterns) to changes in self-reported outcome measures were calculated using a Spearman rank correlation coefficient (i.e. Spearman's rho, rs). Correlations were calculated for the consolidated dataset and for each of the four body regions examined. Ninety-five percent confidence intervals for Spearman rank correlation coefficients were calculated in Microsoft Excel 2016 using the Fisher transformation (Microsoft Corporation; Redmond, WA).44,45 Interpretation of the Spearman rank correlation coefficient has been described as: 0.00 – 0.25 = little or no relationship, 0.25 – 0.50 = fair relationship, 0.50 – 0.75 = moderate to good relationship, >0.75 = good to excellent relationship.46 Statistical significance was set at p < 0.05 for all analyses.
RESULTS
A cohort of 89 subjects consented to participate in the study. From the initial cohort, four subjects were dropped from the study following consent. Reasons for exclusion included two subjects who received surgery for their injuries during the study period, one subject who reported a higher level of resting pain than allowed by the intake criteria following consent, and one subject who moved away from the geographic area before final assessment data were collected. This resulted in a total of 85 subjects (68 male, 17 female) available for analysis. Of those subjects included in the study, 28 (33%) reported a previous injury of similar nature, 34 (40%) reported a time-loss injury of at least two weeks within the previous five years, and nine (11%) reported a previous musculoskeletal surgery secondary to injury. Demographic data for subjects at intake are summarized in Table 3.
Table 3.
Demographic data for complete dataset of subjects and divided by region of primary complaint. Data reported as mean ± standard deviation.
| Demographic | Complete Dataset (n = 85) | Cervicothoracic (n = 5) | Shoulder Girdle (n = 16) | Lumbopelvic (n = 23) | Lower Extremity (n = 41) |
|---|---|---|---|---|---|
| Age (years) | 20.3 ± 1.6 | 19.0 ± 1.0 | 20.1 ± 1.5 | 21.2 ± 1.6 | 20.0 ± 1.5 |
| Duration of symptoms (days) | 230.8 ± 452.1 | 36.2 ± 38.8 | 215.5 ± 450.5 | 218.6 ± 339.9 | 267.3 ± 532.2 |
| Height (cm) | 177.1 ± 8.6 | 174.8 ± 10.1 | 180.0 ± 6.9 | 176.2 ± 7.1 | 176.8 ± 9.8 |
| Weight (kg) | 79.8 ± 11.7 | 72.5 ± 10.6 | 84.7 ± 10.9 | 79.7 ± 8.5 | 78.7 ± 13.2 |
| NPRS (rest) | 1.8 ± 1.4 | 1.8 ± 2.0 | 1.6 ± 1.6 | 2.4 ± 1.3 | 1.5 ± 1.2 |
| NPRS (worst) | 6.5 ± 1.9 | 5.9 ± 2.3 | 6.7 ± 1.4 | 7.0 ± 2.3 | 6.2 ± 1.9 |
Abbreviations: NPRS, numeric pain rating scale; cm, centimeters; kg, kilograms.
Comparisons of intake to final assessment values of self-reported outcome measures showed statistically and clinically meaningful improvements for the consolidated dataset and for subjects with a primary complaint of shoulder girdle, lumbopelvic, and lower extremity complaints. A significant decrease in the number of painful patterns from intake to final assessment was detected for the consolidated dataset and for subjects with a primary complaint of shoulder girdle, lumbopelvic, and lower extremity complaints (mean decrease of 1.1, 1.1, 1.8 and 0.5 patterns, respectively). Subjects with a primary complaint of lumbopelvic pain demonstrated a significant mean decrease of 1.8 dysfunctional patterns and a significant mean decrease of 1.8 points on the criterion scale from intake to final assessment. No other significant changes to the number of dysfunctional patterns or the criterion scores were demonstrated. For subjects presenting with a primary complaint involving the cervical spine or thoracic spine there were no statistically significant differences in self-reported outcome measures, presence of pain during movement, or measures of movement quality between intake and final assessment. These results are summarized in Table 4.
Table 4.
Summary of self-reported outcome measures and movement-related parameters as defined by the Selective Functional Movement Assessment (SFMA).
| Outcome of Interest | Data Point | Complete Dataset | Cervicothoracic | Shoulder Girdle | Lumbopelvic | Lower Extremity |
|---|---|---|---|---|---|---|
| PSFS | Intake | 4.9 ± 1.8 | 5.7 ± 1.4 | 4.1 ± 1.7 | 5.1 ± 2.1 | 5.0 ± 1.6 |
| Final Assessment | 8.1 ± 1.7 | 9.3 ± 0.9 | 7.8 ± 1.4 | 8.1 ± 1.5 | 7.9 ± 2.0 | |
| Change | 3.1 (2.6, 3.7) * | 3.6 (1.9, 5.34) | 3.7 (2.6, 4.8) * | 3.0 (2.0, 4.1) * | 2.9 (2.1, 3.7) * | |
| Region-Specific Questionnaire | Intake | - | 20.4 ± 7.4 | 21.3 ± 8.9 | 22.9 ± 15.1 | 61.7 ± 8.7 |
| Final Assessment | - | 7.6 ± 7.4 | 10.5 ± 14.9 | 9.0 ± 10.0 | 71.5 ± 10.8 | |
| Change | - | 12.8 (2.0, 23.6) | 10.8 (2.0, 19.6) * | 13.9 (6.3, 21.5) * | 9.9 (5.6, 14.2) * | |
| Number of Dysfunctional Patterns | Intake | 9.3 ± 2.3 | 11.0 ± 2.7 | 9.4 ± 1.9 | 9.4 ± 2.0 | 8.9 ± 2.6 |
| Final Assessment | 8.9 ± 2.2 | 8.8 ± 1.6 | 9.6 ± 2.7 | 8.3 ± 1.8 | 8.9 ± 2.2 | |
| Change | 0.4 (-0.3, 1.1) | 2.2 (-1.1, 5.5) | -0.2 (-1.9, 1.5) | 1.1 (-0.04, 2.2) * | 0.1 (-1.0, 1.1) | |
| Number of Painful Patterns | Intake | 1.6 ± 2.1 | 3.2 ± 3.8 | 1.7 ± 1.5 | 2.8 ± 2.6 | 0.7 ± 1.0 |
| Final Assessment | 0.5 ± 1.1 | 0.4 ± 0.9 | 0.6 ± 1.0 | 1.0 ± 1.7 | 0.3 ± 0.6 | |
| Change | 1.1 (0.6, 1.6) * | 2.8 (−1.3, 6.9) | 1.1 (0.2, 2.0) * | 1.8 (0.5, 3.2) * | 0.5 (0.1, 0.8) * | |
| SFMA Criterion Score | Intake | 14.2 ± 4.5 | 17.0 ± 5.0 | 14.1 ± 4.5 | 14.8 ± 4.2 | 13.5 ± 4.6 |
| Final Assessment | 13.3 ± 3.9 | 13.2 ± 2.5 | 13.6 ± 4.7 | 12.9 ± 2.7 | 13.4 ± 4.4 | |
| Change | 0.8 (−0.5, 2.1) | 3.8 (−2.0, 9.6) | 0.5 (−2.8, 3.8) | 1.8 (−0.3, 3.9) * | 0.02 (−2.0, 2.0) |
Results for intake and final assessment scores are reported as mean ± standard deviation. Results for change scores are reported as mean (95% confidence interval) with values normalized such that positive numbers indicate improvement on the scale used. Region-specific questionnaires used were Neck Disability Index (0-100%), Quick Disabilities of the Arm, Shoulder, and Hand (0-100%), Oswestry Disability Index (0-100%), and Lower Extremity Functional Scale (0-80).
indicates an associated p-value of < 0.05 obtained in Wilcoxon signed-rank test comparison of intake to discharge scores.
Fair, positive correlations were demonstrated between change in PSFS and change in the number of painful patterns for the consolidated dataset (rs = 0.28, p = 0.01) and for those subjects with a primary complaint of lumbopelvic pain (rs = 0.41, p = 0.049). Fair, positive correlations were noted for both change in PSFS (rs = 0.41, p = 0.049) and change in ODI (rs = 0.46, p = 0.03) with a change in the number of dysfunctional movement patterns for those subjects with a primary complaint of lumbopelvic pain. A moderate to good positive correlation was also demonstrated for change in QuickDASH and change in the number of painful patterns (rs = 0.52, p = 0.04). No other significant correlations were demonstrated. These results are summarized in Table 5.
Table 5.
Spearman rank correlation coefficient (rs) analysis for changes in patient self-report outcome measures and changes in movement-related parameters.
| Self-Reported Outcome of Interest | Movement-Related Outcome of Interest | Complete Dataset | Cervicothoracic | Shoulder Girdle | Lumbopelvic | Lower Extremity |
|---|---|---|---|---|---|---|
| PSFS | Number of Dysfunctional Patterns | <0.001 (-0.21, 0.21) | 0.58 (-0.62, 0.97) | 0.14 (-0.38, 0.59) | 0.41* (0.00, 0.70) | -0.20 (-0.48, 0.11) |
| Number of Painful Patterns | 0.28* (0.07, 0.47) | −0.05 (−0.89, 0.87) | 0.27 (−0.26, 0.68) | 0.41* (0.00, 0.70) | 0.20 (−0.11, 0.48) | |
| SFMA Criterion Score | 0.03 (−0.18, 0.24) | 0.20 (−0.83, 0.92) | 0.14 (−0.38, 0.59) | 0.22 (−0.21, 0.58) | −0.02 (−0.33, 0.29) | |
| Region-Specific Questionnaire | Number of Dysfunctional Patterns | − | 0.58 (−0.62, 0.97) | 0.13 (−0.39, 0.59) | 0.46* (0.06, 0.73) | −0.02 (−0.33, 0.29) |
| Number of Painful Patterns | − | 0.56 (−0.64, 0.97) | 0.52* (0.03, 0.81) | 0.36 (−0.06, 0.67) | 0.19 (−0.12, 0.47) | |
| SFMA Criterion Score | − | 0.40 (−0.75, 0.95) | 0.05 (−0.46, 0.53) | 0.27 (−0.16, 0.61) | 0.09 (−0.22, 0.39) |
Values reported are correlation coefficients (95% confidence interval). Region-specific questionnaires used were Neck Disability Index, Quick Disabilities of the Arm, Shoulder, and Hand, Oswestry Disability Index, and Lower Extremity Functional Scale.
indicates a statistically significant correlation (p < 0.05). Abbreviations: SFMA, Selective Functional Movement Assessment.
Post-hoc analysis using R statistical software package “pwr” version 1.2-1 demonstrated that observed statistical power for the dataset ranged from 0.04 to 0.41.
DISCUSSION
The purpose of this study was to explore the relationship between patient self-reported measures of function and objective measures of movement quality as defined in the top-tier movements of the SFMA. For the consolidated data set of this cohort, there was a statistically significant, positive correlation across all body regions between a change in self-reported function and change in the number of painful movement patterns a patient experienced when performing the SFMA. As a patient's perception of function improved, he or she was likely to experience a decrease in the number of painful patterns performed. Analyzing the consolidated dataset across all body regions, an improvement in self-reported function was not related to a change in movement quality as defined by the SFMA.
From a regional perspective, patients presenting with shoulder girdle or lumbopelvic complaints demonstrated a positive correlation between a change in the number of painful movement patterns and a change in self-reported outcome measures. The only regional subgroup that demonstrated an improvement in movement quality when an improvement in self-reported function occurred was that of patients with a primary complaint of lumbopelvic issues.
The results observed in this study indicate that improvement in self-reported function is more strongly related to a decrease in pain during movement than it is to quality of movement. It is important to note that the design of this study was not to investigate if movement quality in the SFMA could be altered with intervention but just to examine if a relationship between self-reported function and movement exists. It is possible that in this group of subjects, quality of movement may be a characteristic that is independent of, or at least not heavily influenced by, self-reported functional outcome measures.
As shown in Table 4, subjects in this study demonstrated clinically important improvements in self-reported measures of function across all regions except for those with primary complaint of cervicothoracic pain.31,32,35,37,38 It is believed that the magnitude of these improvements in self-reported function was sufficient to show a clinically meaningful change in movement quality if the two attributes were related. Dolbeer et al. determined a minimum detectable difference of 5.41 points on the criterion score of the SFMA, so it may be that the changes observed in this study were too small to support detection of a significant correlation with self-reported outcomes (Tables 4 and 5).27 However, it must be noted that no minimum clinically important difference for a change in movement quality has been established and a decrease of just one painful or dysfunctional pattern may be considered important to a patient.
It is important to note that many self-reported outcome measures are more strongly weighted in a patient's experience of pain than his or her objective levels of function.47 This may explain some of the reason that improvements in perceived function and decreases in the number of painful patterns were generally observed, but limited improvements in quality of motion were seen (Table 4). As noted previously, the criterion score is not affected by pain. When taking these two factors into account, these results indicate that the categorical scoring method may have more practical usefulness for movement assessment than the criterion scoring method.
One should also consider the wide variations in movement that may be observed in different populations exposed to different activities. Most notably in some throwing athletes, relatively large asymmetries in range of motion and movement may be of athletic advantage and therefore considered advantageous to the sport in question.48-50 It is likely that with such adaptive asymmetries, a patient may not be able to achieve what is deemed a functional pattern on the SFMA and yet be asymptomatic with all activities. It may be useful to consider instead the concept that there is some range of movement quality (a “standard deviation” of movement) that is acceptable for activity and function rather than just one ideal way for all patients to move.
The relatively small changes in movement quality parameters observed may have been due to several factors. Treating therapists had the results of the top-tier SFMA available to them, but it is unknown to what extent each therapist attempted to influence movement quality of the patient as opposed to a treatment plan focused primarily on addressing the patient's chief complaint through other methods. Though grading standards of the SFMA are objective, some amount of subjectivity and error with grading of any movement system will be present which may result in variation to observed changes in movement quality from intake to final assessment. Finally, the criterion scoring method weights each pattern differently based on the number of quality criteria for each pattern (Appendix C). Functional improvement noted by a patient with lumbopelvic complaints could potentially change his or her criterion score far more than a patient with unilateral shoulder pain based on the greater number of associated quality criteria and movement patterns that may be influenced by a lumbopelvic complaint. This may also offer some explanation as to why some body regions demonstrated stronger relationships between movement quality and self-reported outcome measures.
This study was conducted on a convenience sample at a direct-access physical therapy clinic. Therefore, the number of subjects in each region varied considerably. The relatively small numbers of subjects in each region may have reduced power sufficiently to not detect any significant changes. The observed power calculations listed above indicate that the regional analyses may have benefitted from a greater number of subjects in each group to minimize a risk of Type II error. However, the utility of post-hoc power testing has been questioned and it is believed that it may not be of particular use.51,52 Rather, a more accurate way of stating the issue is that this study was appropriately powered for the consolidated dataset, but the a priori estimate of the correlation coefficient rs value of 0.75 was an overestimation of the correlation between movement and self-reported function, if a correlation truly exists. Thus, it is not believed that this study was underpowered, particularly when noting that significant differences were found, an occurrence that necessitates sufficient power.
For those subjects presenting with lower extremity complaints, running and ruck marching were common aggravating activities. These two activities are frequently required by the subjects involved in this study. Due to the dynamic nature of these actions and other high-level sporting activities, the ability to perform them may not be reflected well by the SFMA. It may be expected that a smaller magnitude of change in observed movement quality would result from a treatment plan designed to facilitate return to these activities.
Future research should examine the potential for improving movement quality as measured by the SFMA when treatment plans are specifically designed to do so. This approach could also address the question of whether an improvement in movement quality would lead to a subsequent change in self-reported outcome measures. As mentioned earlier, because self-reported outcome measures may be more heavily weighted to a patient's experience of pain, future research might explore the relationship between the SFMA and other objective physical performance outcome measures such as the upper and lower quarter Y-Balance Tests or hop testing. It is of note that this study population consisted of young and generally physically fit individuals at a military academy, and the results of this study may not apply to the general population. Future research should examine a more diverse range of subjects.
CONCLUSION
Significant improvements in patient self-reported functional outcome measures were associated with a decrease in the number of painful patterns experienced during the SFMA. Improvements in self-reported function were not related to a change in the observed movement quality of the assessment, except for those patients presenting with lumbopelvic pain. Movement quality as evaluated by the SFMA may be an independent attribute of patient presentation that is not strongly influenced by changes in patient self-reported function alone. Future research should investigate if specific interventions can change the quality of movement in the SFMA, and to what extent this change may affect self-reported outcome measures.
Acknowledgments
The opinions or assertions contained herein are the private views of the authors and are not be construed as official or as reflecting the views of the US Navy or the Department of Defense.
Appendix A.
Demonstration of each pattern of the Selective Functional Movement Assessment with the verbal instructions provided to each subject. With the exceptions of Single Leg Stance and Overhead Deep Squat, all movements were performed standing upright with both feet together.
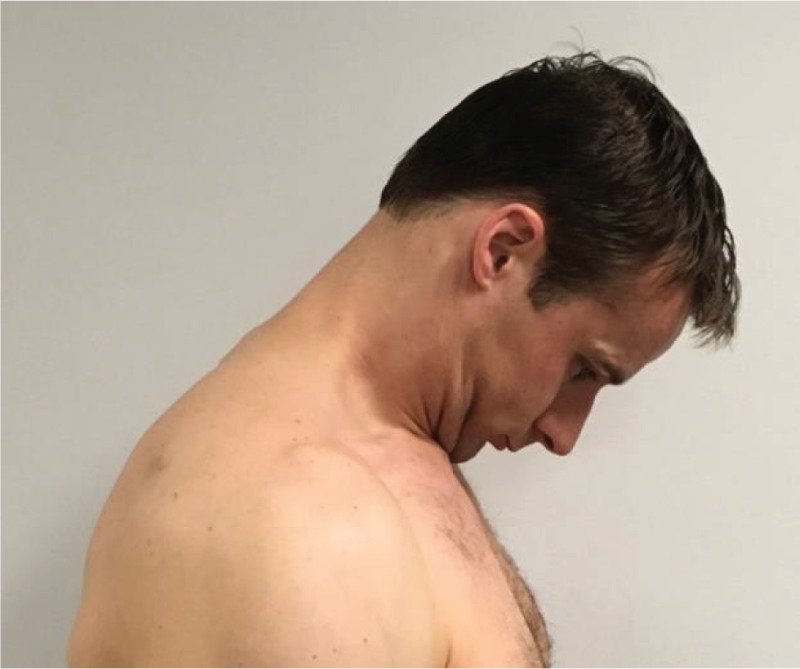
|
Cervical
Flexion “Keeping your mouth closed and tongue resting lightly on the roof of your mouth, bring your chin down to your chest or as close as you can.” |
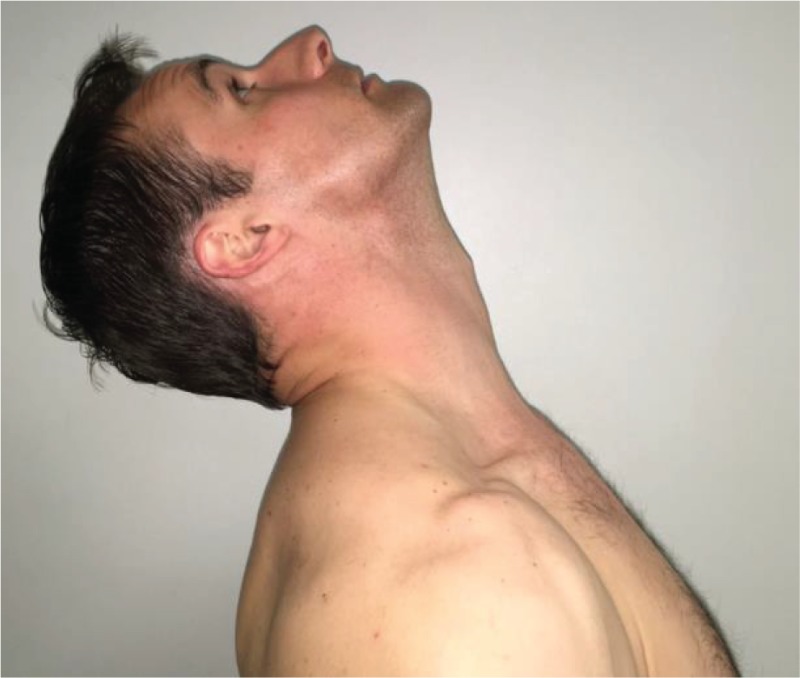
|
Cervical
Extension “Please look up to the ceiling as high as you can.” |
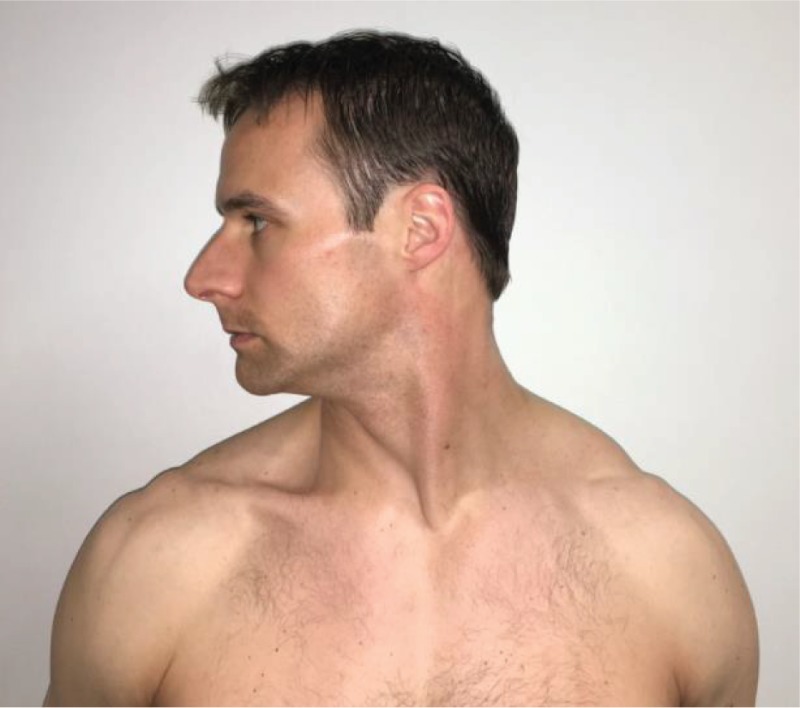
|
Cervical Rotation “Turn your head as far as you can to the right.” This movement is performed bilaterally. |
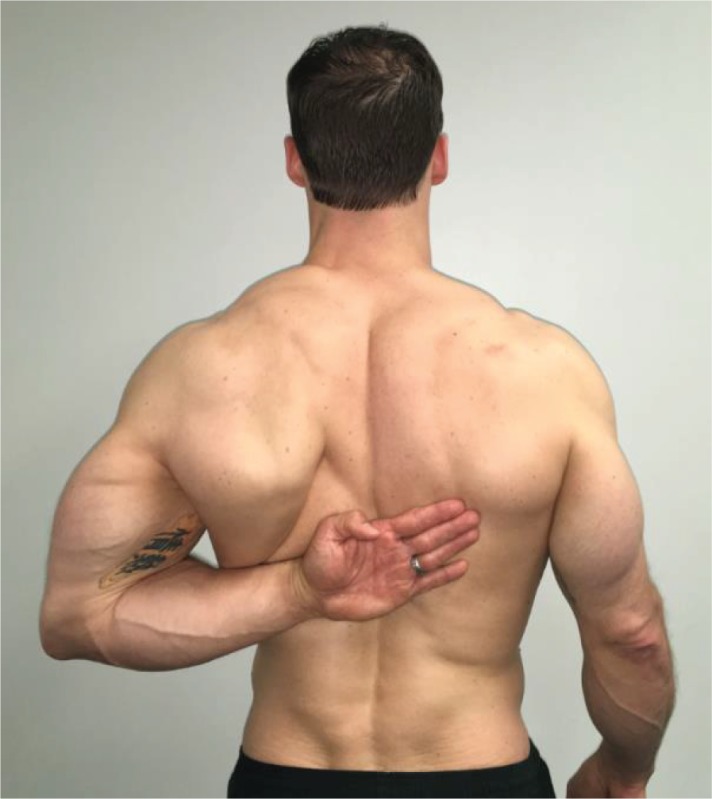
|
Upper Extremity Pattern One – Medial
Rotation and Extension “Using your left arm in one movement, reach behind your back and try to touch the bottom of your opposite shoulder blade.” This movement is performed bilaterally. |
|
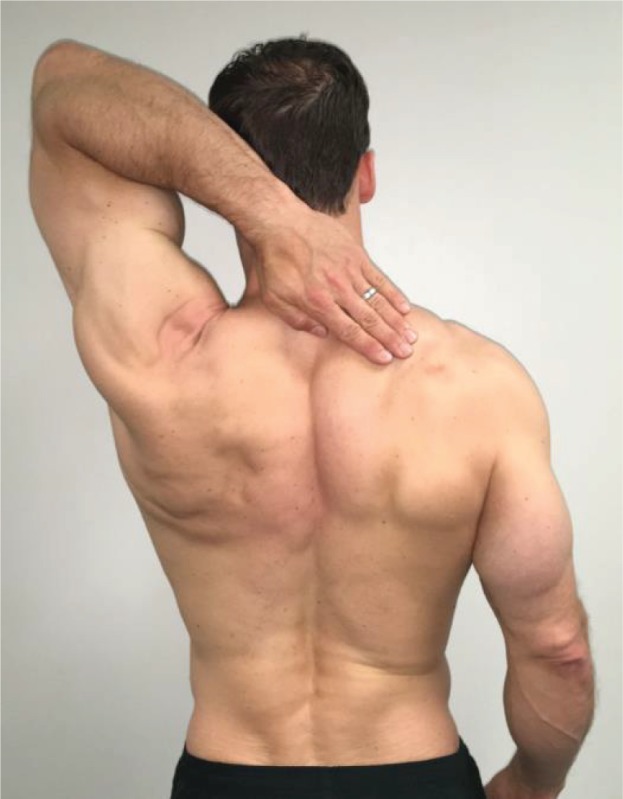
Upper Extremity Pattern Two – Lateral
Rotation and Flexion “Using your left arm in one movement, reach behind your head and try to touch the top of your opposite shoulder blade.” This movement is performed bilaterally. |
|
Multi-Segmental
Flexion “Bend down and try to touch your toes.” |
|
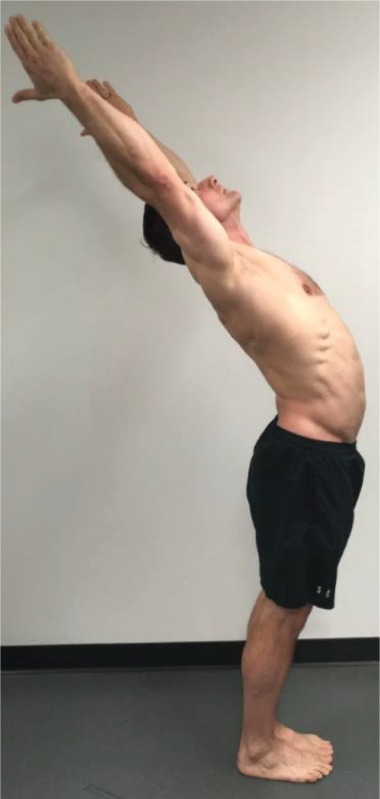
Multi-Segmental
Extension “Raise your arms above your head and lean back as far as you can.” |
|
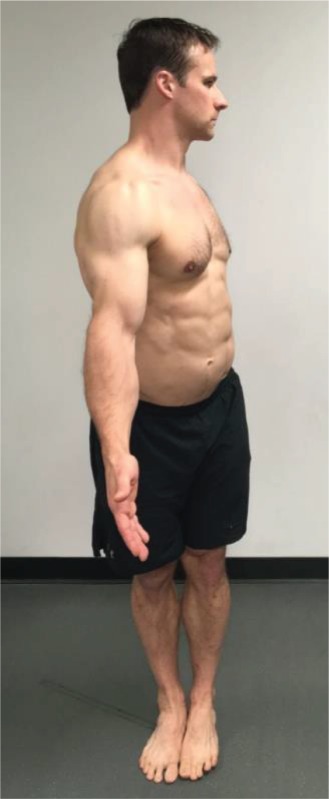
Multi-Segmental
Rotation “Place your hands by your sides with palms facing forward and rotate your entire body as far as you can to the left.” This movement is performed bilaterally. |

|
Single Leg Stance “With your hands by your sides and palms facing forward, raise your right thigh so it is parallel with the floor.” This position is held for 10 seconds with the eyes open, and then for 10 seconds with the eyes closed. This movement is performed bilaterally. |
|
Overhead Deep
Squat “Standing with your feet shoulder width apart and pointed straight forward, raise your arms in a Y position with your elbows straight. Squat as low as you can.” |
Appendix B.
Appendix C.
Appendix D.
REFERENCES
- 1.Ludewig PM Lawrence RL Braman JP. What's in a name? Using movement system diagnoses versus pathoanatomic diagnoses. J Orthop Sports Phys Ther. 2013;43(5):280-283. [DOI] [PubMed] [Google Scholar]
- 2.Carragee E Alamin T Cheng I Franklin T van den Haak E Hurwitz E. Are first-time episodes of serious LBP associated with new MRI findings? Spine J. 2006;6(6):624-635. [DOI] [PubMed] [Google Scholar]
- 3.Wolfe F Clauw DJ Fitzcharles MA, et al. The American College of Rheumatology preliminary diagnostic criteria for fibromyalgia and measurement of symptom severity. Arthritis Care Res. 2010;62(5):600-610. [DOI] [PubMed] [Google Scholar]
- 4.Flynn TW Smith B Chou R. Appropriate use of diagnostic imaging in low back pain: a reminder that unnecessary imaging may do as much harm as good. J Orthop Sports Phys Ther. 2011;41(11):838-846. [DOI] [PubMed] [Google Scholar]
- 5.Boden SD McCowin PR Davis DO Dina TS Mark AS Wiesel SW. Abnormal magnetic-resonance scans of the lumbar spine in asymptomatic subjects. J Bone Joint Surg. 1990;72:403-409. [PubMed] [Google Scholar]
- 6.Jarvik JG Hollingworth W Heagerty PJ Haynor DR Boyko EJ Deyo RA. Three-year incidence of low back pain in an initially asymptomatic cohort: clinical and imaging risk factors. Spine (Phila Pa 1976). 2005;30(13):1541-1548. [DOI] [PubMed] [Google Scholar]
- 7.Matsumoto M Okada E Ichihara D, et al. Age-related changes of thoracic and cervical intervertebral discs in asymptomatic subjects. Spine (Phila Pa 1976). 2010;35(14):1359-1364. [DOI] [PubMed] [Google Scholar]
- 8.Register B Pennock AT Ho CP Strickland CD Lawand A Philippon MJ. Prevalence of abnormal hip findings in asymptomatic participants: a prospective, blinded study. Am J Sports Med. 2012;40(12):2720-2724. [DOI] [PubMed] [Google Scholar]
- 9.Tempelhof S Rupp S Seil R. Age-related prevalence of rotator cuff tears in asymptomatic shoulders. J Should Elbow Surg. 1999;8(4):296-299. [DOI] [PubMed] [Google Scholar]
- 10.Connor PM Banks DM Tyson AB Coumas JS D’Alessandro DF. Magnetic resonance imaging of the asymptomatic shoulder of overhead athletes. Am J Sports Med. 2003;31(5):724-727. [DOI] [PubMed] [Google Scholar]
- 11.Zanetti M Pfirrmann CW Schmid MR Romero J Seifert B Hodler J. Patients with suspected meniscal tears: prevalence of abnormalities seen on MRI of 100 symptomatic and 100 contralateral asymptomatic knees. Am J Roentgenology. 2003;181(3):635-641. [DOI] [PubMed] [Google Scholar]
- 12.Kaplan LD Schurhoff MR Selesnick H Thorpe M Uribe JW. Magnetic resonance imaging of the knee in asymptomatic professional basketball players. J Arthrosc Relat Surg. 2005;21(5):557-561. [DOI] [PubMed] [Google Scholar]
- 13.Cook G. Movement: Functional movement systems: Screening, assessment, corrective strategies. On Target Publications; 2010. [Google Scholar]
- 14.Gribble PA Brigle J Pietrosimone BG Pfile KR Webster KA. Intrarater reliability of the functional movement screen. J Strength Condit Res. 2013;27(4):978-981. [DOI] [PubMed] [Google Scholar]
- 15.Minick KI Kiesel KB Burton L Taylor A Plisky P Butler RJ. Interrater reliability of the functional movement screen. J Strength Condit Res. 2010;24(2):479-486. [DOI] [PubMed] [Google Scholar]
- 16.Cuchna JW Hoch MC Hoch JM. The interrater and intrarater reliability of the functional movement screen: A systematic review with meta-analysis. Phys Ther in Sport. 2016;19:57-65. [DOI] [PubMed] [Google Scholar]
- 17.Letafatkar A Hadadnezhad M Shojaedin S Mohamadi E. Relationship between functional movement screening score and history of injury. Int J Sports Phys Ther. 2014;9(1):21. [PMC free article] [PubMed] [Google Scholar]
- 18.Kiesel K Plisky PJ Voight ML. Can serious injury in professional football be predicted by a preseason functional movement screen. N Am J Sports Phys Ther. 2007;2(3):147-158. [PMC free article] [PubMed] [Google Scholar]
- 19.O’Connor FG Deuster PA Davis J Pappas CG Knapik JJ. Functional movement screening: predicting injuries in officer candidates. Med Sci Sports Exerc. 2011;43(12):2224-2230. [DOI] [PubMed] [Google Scholar]
- 20.Kraus K Schütz E Taylor WR Doyscher R. Efficacy of the functional movement screen: a review. J Strength Condit Res. 2014;28(12):3571-3584. [DOI] [PubMed] [Google Scholar]
- 21.Moran RW Schneiders AG Mason J Sullivan SJ. Do Functional Movement Screen (FMS) composite scores predict subsequent injury? A systematic review with meta-analysis. Br J Sports Med. 2017:bjsports-2016-096938. [DOI] [PubMed] [Google Scholar]
- 22.Dickx N Cagnie B Parlevliet T Lavens A Danneels L. The effect of unilateral muscle pain on recruitment of the lumbar multifidus during automatic contraction. An experimental pain study. Man Ther. 2010;15(4):364-369. [DOI] [PubMed] [Google Scholar]
- 23.dos Reis AC Correa JC Bley AS Rabelo ND Fukuda TY Lucareli PR. Kinematic and Kinetic Analysis of the Single-Leg Triple Hop Test in Women With and Without Patellofemoral Pain. J Orthop Sports Phys Ther. 2015;45(10):799-807. [DOI] [PubMed] [Google Scholar]
- 24.Hodges PW Tucker K. Moving differently in pain: a new theory to explain the adaptation to pain. Pain. 2011;152(3 Suppl):S90-98. [DOI] [PubMed] [Google Scholar]
- 25.Tucker K Larsson AK Oknelid S Hodges P. Similar alteration of motor unit recruitment strategies during the anticipation and experience of pain. Pain. 2012;153(3):636-643. [DOI] [PubMed] [Google Scholar]
- 26.Glaws KR Juneau CM Becker LC Di Stasi SL Hewett TE. Intra-and inter-rater reliability of the selective functional movement assessment (SFMA). Int J Sports Phys Ther. 2014;9(2). [PMC free article] [PubMed] [Google Scholar]
- 27.Dolbeer JA Mason JS Morris JB Crowell MS Goss DL. Inter-Rater Reliability of the Selective Functional Movement Assessment (SFMA) by SFMA Certified Physical Therapists with Similar Clinical and Rating Experience. Int J Sports Phys Ther. 2017 Oct; 12(5): 752-763. [PMC free article] [PubMed] [Google Scholar]
- 28.Pilch SB RK Rudolph K Swiatek N Zawisky JP Schenk RJ. Relationship Among Performance on the Selective Functional Movement Assessment and NDI and ODI Scores in Patients with Spine Pain. Orthop Phys Ther Pract. 2012;24(1):22-27. [Google Scholar]
- 29.Stratford P Gill C Westaway M Binkley J. Assessing disability and change on individual patients: a report of a patient specific measure. Physiotherapy Canada. 1995;47(4):258-263. [Google Scholar]
- 30.Horn KK Jennings S Richardson G Vliet DV Hefford C Abbott JH. The patient-specific functional scale: psychometrics, clinimetrics, and application as a clinical outcome measure. J Orthop Sports Phys Ther. 2012;42(1):30-42. [DOI] [PubMed] [Google Scholar]
- 31.Abbott JH Schmitt J. Minimum important differences for the patient-specific functional scale, 4 region-specific outcome measures, and the numeric pain rating scale. J Orthop Sports Phys Ther. 2014;44(8):560-564. [DOI] [PubMed] [Google Scholar]
- 32.Cleland JA Childs JD Whitman JM. Psychometric properties of the Neck Disability Index and Numeric Pain Rating Scale in patients with mechanical neck pain. Arch Phys Med Rehabil. 2008;89(1):69-74. [DOI] [PubMed] [Google Scholar]
- 33.Macdermid JC Walton DM Avery S, et al. Measurement properties of the neck disability index: a systematic review. J Orthop Sports Phys Ther. 2009;39(5):400-C412. [DOI] [PubMed] [Google Scholar]
- 34.Gummesson C Ward MM Atroshi I. The shortened disabilities of the arm, shoulder and hand questionnaire (QuickDASH): validity and reliability based on responses within the full-length DASH. BMC Musculoskel Disord. 2006;7:44. [DOI] [PMC free article] [PubMed] [Google Scholar]
- 35.Mintken PE Glynn P Cleland JA. Psychometric properties of the shortened disabilities of the Arm, Shoulder, and Hand Questionnaire (QuickDASH) and Numeric Pain Rating Scale in patients with shoulder pain. J Should Elbow Surg. 2009;18(6):920-926. [DOI] [PubMed] [Google Scholar]
- 36.Fairbank JC Pynsent PB. The Oswestry disability index. Spine. 2000;25(22):2940-2953. [DOI] [PubMed] [Google Scholar]
- 37.Lauridsen HH Hartvigsen J Manniche C Korsholm L Grunnet-Nilsson N. Responsiveness and minimal clinically important difference for pain and disability instruments in low back pain patients. BMC Musculoskel Disord. 2006;7:82. [DOI] [PMC free article] [PubMed] [Google Scholar]
- 38.Binkley JM Stratford PW Lott SA Riddle DL. The lower extrenity functional scale (LEFS): Scale development, measurement properties, and clinical application. Phys Ther. 1999;79(4):371. [PubMed] [Google Scholar]
- 39.Watson CJ Propps M Ratner J Zeigler DL Horton P Smith SS. Reliability and responsiveness of the lower extremity functional scale and the anterior knee pain scale in patients with anterior knee pain. J Orthop Sports Phys Ther. 2005;35(3):136-146. [DOI] [PubMed] [Google Scholar]
- 40.Downie W Leatham P Rhind V Wright V Branco J Anderson J. Studies with pain rating scales. Ann Rheum Dis. 1978;37(4):378-381. [DOI] [PMC free article] [PubMed] [Google Scholar]
- 41.Kahl C Cleland JA. Visual analogue scale, numeric pain rating scale and the McGill pain Questionnaire: an overview of psychometric properties. Phys Ther Rev. 2013;10(2):123-128. [Google Scholar]
- 42.Farrar JT Young JP Jr. LaMoreaux L Werth JL Poole RM. Clinical importance of changes in chronic pain intensity measured on an 11-point numerical pain rating scale. Pain. 2001;94(2):149-158. [DOI] [PubMed] [Google Scholar]
- 43.Moinester M Gottfried R. Sample size estimation for correlations with pre-specified confidence interval. Quant Methods Psych. 2014;10(2):124-130. [Google Scholar]
- 44.Altman D Machin D Bryant T Gardner M. Statistics with confidence: confidence intervals and statistical guidelines. John Wiley & Sons; 2013. [Google Scholar]
- 45.Conover W. Practical nonparametric statistics, 3rd edn Wiley; New York: 1999:250-257. [Google Scholar]
- 46.Portney L Watkins M. Foundations of clinical research: applications to practice 3rd ed. Upper Saddle River, New Jersey: Pearson Education Inc.; 2009. [Google Scholar]
- 47.Stratford PW Kennedy DM. Performance measures were necessary to obtain a complete picture of osteoarthritic patients. J Clin Epidemiol. 2006;59(2):160-167. [DOI] [PubMed] [Google Scholar]
- 48.Osbahr DC Cannon DL Speer KP. Retroversion of the humerus in the throwing shoulder of college baseball pitchers. Am J Sports Med. 2002;30(3):347-353. [DOI] [PubMed] [Google Scholar]
- 49.Bussey MD. Does the demand for asymmetric functional lower body postures in lateral sports relate to structural asymmetry of the pelvis? J Sci Med Sport. 2010;13(3):360-364. [DOI] [PubMed] [Google Scholar]
- 50.Ellenbecker TS Roetert EP Bailie DS Davies GJ Brown SW. Glenohumeral joint total rotation range of motion in elite tennis players and baseball pitchers. Med Sci Sports Exerc. 2002;34(12):2052-2056. [DOI] [PubMed] [Google Scholar]
- 51.Goodman SN Berlin JA. The use of predicted confidence intervals when planning experiments and the misuse of power when interpreting results. Ann Int Med. 1994;121(3):200-206. [DOI] [PubMed] [Google Scholar]
- 52.Levine M Ensom MH. Post hoc power analysis: an idea whose time has passed? J Hum Pharmacol Drug Ther. 2001;21(4):405-409. [DOI] [PubMed] [Google Scholar]


