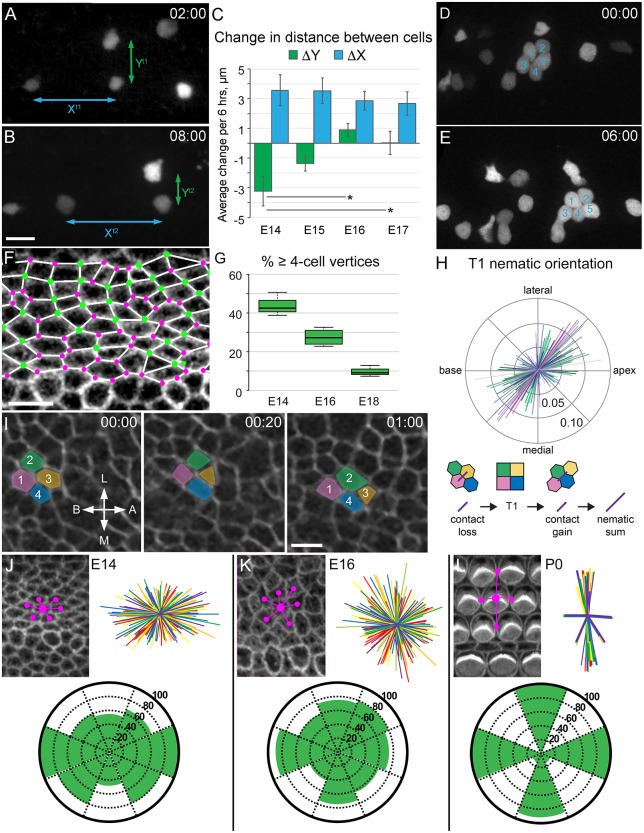
Fig. 3.
CE occurs during cochlear outgrowth. (A,B) z-stack projections from an Atoh1Cre*PR; R26RZsGreen time-lapse begun at E14 equivalent, showing CE measurements. The distance between cells along the x-axis (base-to-apex) increases, whereas distance along the y-axis (medial-lateral) decreases. Scale bar: 20 µm in B for A,D,E. (C) Quantification of average change in distance between nearby pairs of cells over 6 h. Convergence (negative ΔY) and extension (positive ΔX) are observed at E14-E15. Extension continues until E17, but little convergence is observed beyond E15. Data shown are averages±s.e.m., and statistically different values are indicated (P<0.01). n=(age, explants, cell pairs): E14, 8, 26; E15, 8, 28; E16, 5, 46; E17, 5, 45. (D,E) Cells align into rows in an E15 Atoh1Cre*PR; R26RtdTomato cochlear explant. A rosette of labeled HCs (D, numbered) rearranges into the first and second rows of OHCs over 6 h (E). (F) The luminal surface of a phalloidin-stained E14 cochlear epithelium, overlaid with depictions of the cell vertices. Vertices of three cells are marked with a pink dot, and those containing four or more cells with a green dot. Scale bar: 5 µm. (G) The percentage of cell vertices containing four or more cells decreases with developmental age. Values are significantly different (P<0.01). n=(age, sample, cell vertices): E14, 3, 740; E16, 4, 1170; E18, 3, 657. (H) The orientation of T1 transition summed nematics at E15, with axes indicated. Each line represents the average orientation of four-cell (T1) vertices resulting in neighbor exchange in a single time-lapse frame. The lengths of the lines along the nematic norm reflect how uniformly ordered the orientations of the exchanges are. A horizontal line orientation indicates productive neighbor exchange leading to extension along the base-to-apex axis, but the majority of the T1 nematics are oriented at ∼45°, between the base-to-apex and medial-lateral axes. Productive T1 neighbor exchange and summed nematic is depicted below the plot. n=3 explants, 143 frames, 1238 cells. (I) Still images of a 2 µm luminal surface z-stack confocal projection from an E14 R26RmT-mG cochlear explant, with four cells pseudocolored and numbered. In 1 h, cells 2 and 4 intercalate between cells 1 and 3. A common vertex forms, then resolves as cells 2 and 4 intercalate perpendicular to the base-to-apex elongation axis. Scale bar: 5 µm. (J-L) Luminal surface views of the OC at the indicated ages. Spatial relationships for cell-cell contacts were determined as shown (magenta lines). An overlay of spatial relationships for multiple cells in the OHC region is shown for each age. Orientations of cell-cell contacts at E14 and E16 are similar. At P0 cellular patterning has changed significantly. Rose diagrams illustrate the percentage of cells with contacts at the indicated positions. n=(age, samples, cells, contacts) E14, 3, 45, 271; E16, 3, 45, 179; P0, 3, 45, 123.

