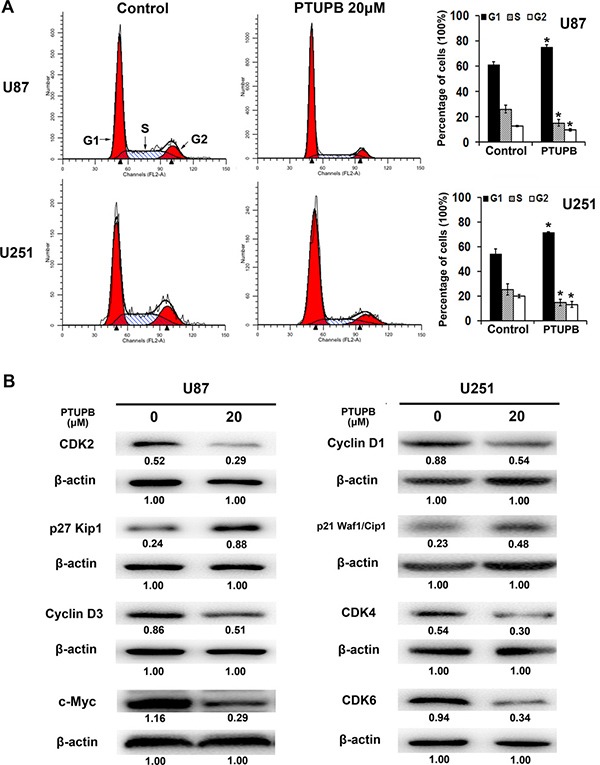
Figure 2. The effect of PTUPB on cell cycle.

(A) 20 μM PTUPB (48-h treatment) increases the percentage of G1 phase cells and decrease the percentage of S and G2 phase cells, compared with the control (*P < 0.05). (B) 20 μM PTUPB (48–h treatment) reduces the expression of cell cycle promoters CDK2, CDK4, CDK6, Cyclin D1, Cyclin D3 and c-Myc and, increases the expression of cell cycle progression inhibitors, p27Kip1 and p21Waf1/Cip1. β-actin served as loading control. The immunoblotting bands were quantified by ImageJ and represented by relative values compare with loading control (1.00).
