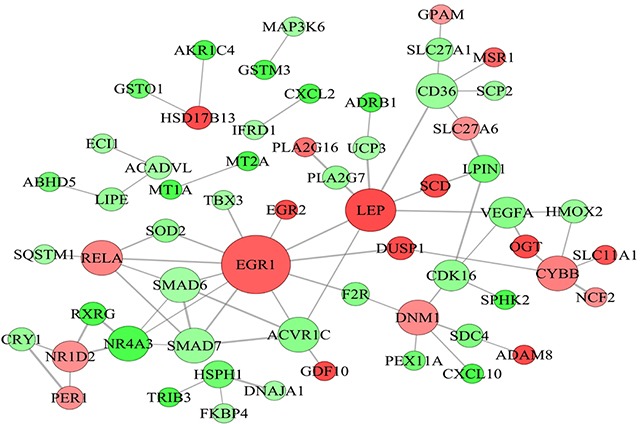
Figure 4. Protein-protein interaction network of differentially expressed genes related to lipid metabolism.

Node represents protein, edge represents interaction between proteins, size of the node is proportional to degree of this node (degree of the node is defined as amount of proteins that interact with this node), and color of node represents Log2FoldChange in expression levels of differentially expressed genes between Laiwu and Large White pigs.
