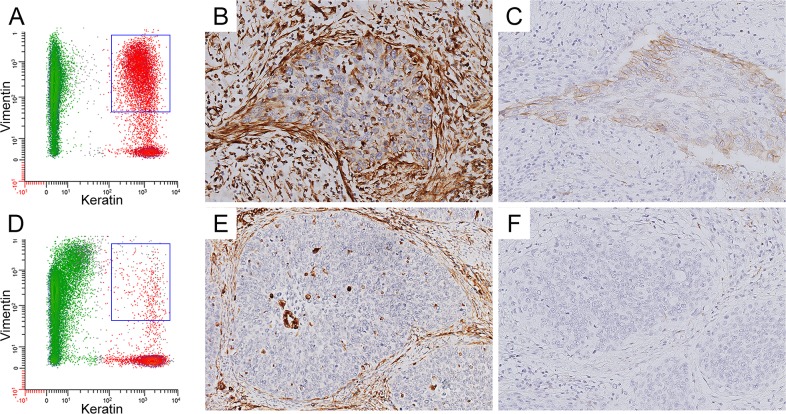
Figure 4.
(A+D) Representative FACS analysis of tumor samples with high (A) and low (D) fraction of vimentin positive tumor cells. The keratin negative fraction is shown in green, the keratin positive fraction (i.e. tumor fraction) is shown in red. The keratin/vimentin double-positive tumor fraction is indicated with a blue square. (B+E) Immunohistochemical staining of high (B) and low (E) vimentin expression. (C+F) Immunohistochemical staining of high (C) and low (F) L1CAM expression.

