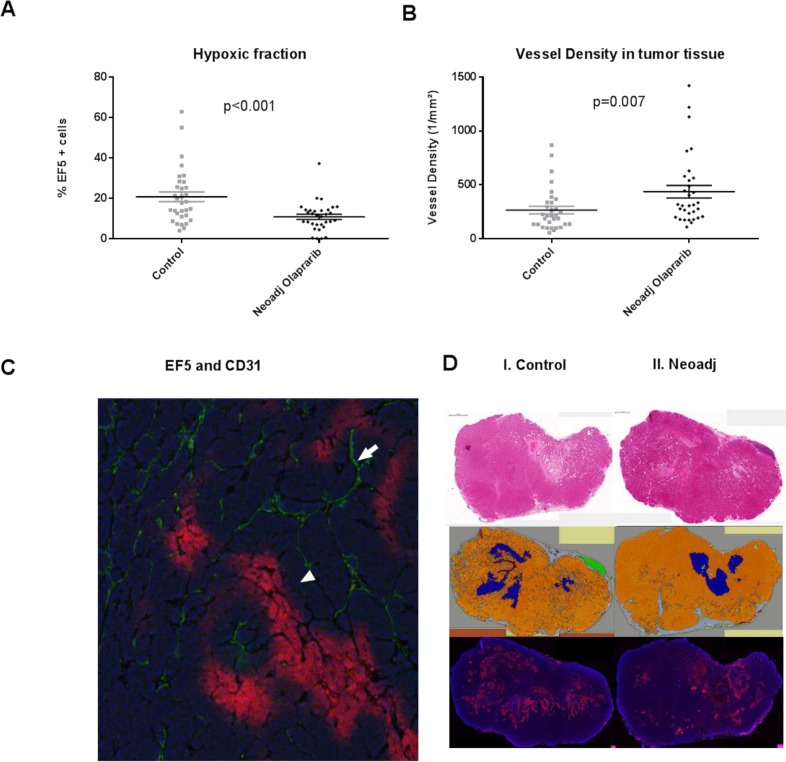
Figure 4.
(A) The percentage of cells which are EF5 positive (i. e. red regions are hypoxic in Figure 4C) is significantly lower following neoadjuvant Olaparib treatment (black diamonds) when compared to the untreated control tumors (grey triangles). (B) The vessel density in olaparib (black diamonds) treated and control tumors (grey triangles) are different in the oxic regions within the tumor. (C) Hypoxic (positive EF5) area indicated by the white triangle and CD31 (vessel) is indicated by the white arrow. (D) I. Two H&E staining slides of a control (left) and neoadjuvantly (right) treated tumor of about 9 mm in length (scale bar of 1 mm is picture in the left top corner). H&E staining was executed to discriminate the different tissue types in the tumor. II. Discrimination: orange=tumor tissue, blue=necrotic tissue, green=normal breast tissue, brown=artefact, grey=mesenchymal tissue. III. EF5 staining of a control (left) and neoadjuvantly (right) treated tumor.

