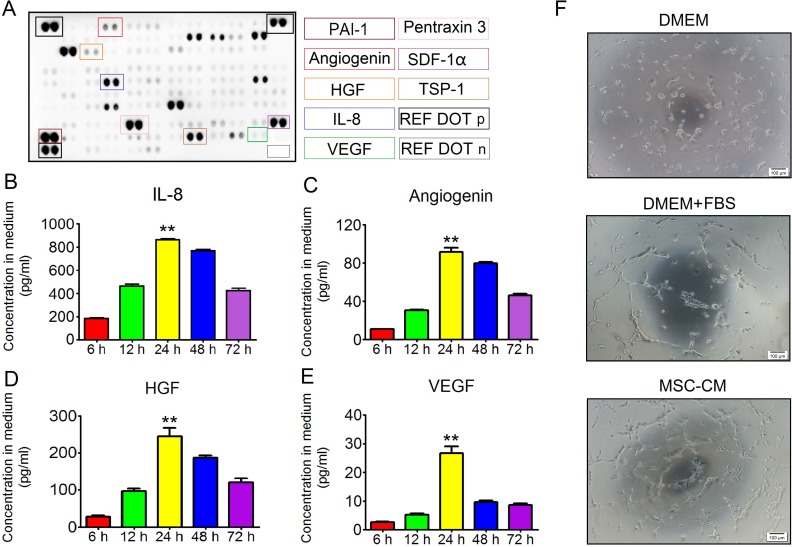
Figure 2. The angiogenic effect of MSC-CM.
(A) Protein array analysis. Each cytokine was detected in duplicate. Cytokines affecting angiogenesis were labeled in color frame. REF DOT p: reference dots for positive controls; REF DOT n: Reference dots for background controls. (B) Relationship between IL-8 concentration in MSC-CM and conditioned time. Each 5 ml medium was conditioned for 6 hours, 12 hours, 24 hours, 48 hours and 72 hours. IL-8 was detected using the Luminex-based multiple cytokines assay. Data are shown as the Mean±S.D. Each time point contained 6 independent samples (n = 6). One-way ANOVA method was used for analyzing statistical differences between groups. **P ≤ 0.001: Significantly higher than other groups. (C) Relationship between angiogenin concentration in MSC-CM and conditioned time. Each 5 ml medium was conditioned for 6 hours, 12 hours, 24 hours, 48 hours and 72 hours. Angiogenin was detected using the Luminex-based multiple cytokines assay. Data are shown as the Mean±S.D. Each time point contained 6 independent samples (n = 6). One-way ANOVA method was used for analyzing statistical differences between groups. **P ≤ 0.001: Significantly higher than other groups. (D) Relationship between HGF concentration in MSC-CM and conditioned time. Each 5 ml medium was conditioned for 6 hours, 12 hours, 24 hours, 48 hours and 72 hours. HGF was detected using the Luminex-based multiple cytokines assay. Data are shown as the Mean±S.D. Each time point contained 6 independent samples (n = 6). One-way ANOVA method was used for analyzing statistical differences between groups. **P ≤ 0.001: Significantly higher than other groups. (E) Relationship between VEGF concentration in MSC-CM and conditioned time. Each 5 ml medium was conditioned for 6 hours, 12 hours, 24 hours, 48 hours and 72 hours. VEGF was detected using the Luminex-based multiple cytokines assay. Data are shown as the Mean±S.D. Each time point contained 6 independent samples (n = 6). One-way ANOVA method was used for analyzing significant differences among groups. **P ≤ 0.001: Significantly higher than other groups. (F) Tube formation of HUVEC. Intact HUVEC were seeded onto a 96-well plate. Each well contained 20 μl of Matrigel. Inducible condition using basic DMEM was set as the negative control. In addition, DMEM plus FBS was set as the positive control. Four hours later, HUVEC were branched in both the DMEM plus FBS group and MSC-CM group 4. Magnification at 40×; Scale bar: 100 μm.

