

Abstract
The purpose of this study was to define the feasibility of dynamic contrast-enhanced MRI to estimate vascular density and leakiness of spontaneous islet cell tumors in RIP-Tag2 transgenic mice. Dynamic T1-weighted SPGR imaging at 2.0 T was performed in 17 RIP-Tag2 mice using a prototype blood pool macromolecular contrast medium (MMCM), albumin-(Gd-DTPA)35. Kinetic analysis of the dynamic enhancement responses based on a two-compartment model was used to estimate fractional plasma volume (fPV) and the coefficient of endothelial permeability (KPS) for each tumor. The MRI estimate of fPV was correlated on a tumor-by-tumor basis with corresponding microscopic measurements of vascular density. The fPV assays by MMCM-enhanced imaging ranged from 2.4 to 14.1% of tissue volume. Individual tumor fPV values correlated significantly (r=0.79, p<0.001) with the corresponding microscopic estimates of vascularity consisting of the combined area densities of lectin-perfused microvessels plus erythrocyte-stained blood lakes. A biotinylated derivative of the albumin-based MMCM confirmed extravasation of the contrast agent from some tumor blood vessels and accumulation in 25% of blood lakes. The KPS values ranged from 0 (no detectable leak) to 0.356 ml/min/100cm3. Dynamic MMCM-enhanced MRI is feasible in RIP-Tag2 pancreatic tumors yielding estimates of vascular permeability and microscopically-validated measurements of vascular richness.
Keywords: Dynamic MRI, MMCM, RIP-Tag2 tumors, blood lakes, lectin, fractional plasma volume
INTRODUCTION
Numerous studies conducted over the past two decades have investigated the mechanisms underlying tumor angiogenesis using a unique mouse model of pancreatic islet cell cancers arising spontaneously in RIP-Tag2 transgenic mice (1). In this model, due to the control of the rat insulin II promoter, expression of the SV-40 large T-antigen is restricted to the insulin-producing β cells of the islets of Langerhans in the pancreas (2). The Tag oncoprotein possesses a number of functional activities, including the ability to bind and thereby inactivate two tumor suppressor proteins, pRB and p53 (3). Although the Tag oncoprotein is present from the embryonic stage, its phenotypic effects become apparent by 6-8 weeks of age, when islets begin to become hyperplastic with accelerated, “switched-on” angiogenesis. This accelerated angiogenesis leads to highly vascularized tumors typically associated with the appearance of many hemorrhage-like extravascular blood collections, termed “blood lakes” (4). Much of the appeal for the past investigations of the RIP-Tag2 tumor model is that in a single mouse by 12-14 weeks of age, normal islets, hyperplastic cell collections, early angiogenically-active tumors and highly vascularized advanced solid islet cell cancers are simultaneously present.
The RIP-Tag2 mouse model has been utilized for a wide range of investigations including studies of the angiogenic switch, angiogenesis inhibition, and microscopic characterizations of tumor blood vessels; it has become a virtual prototype for the pathways, parameters, and molecular mechanisms of angiogenesis (5). Yet, this highly valued model of tumor angiogenesis has not been examined using dynamic contrast-enhanced MRI with quantitative vascular characterizations. The small size of mice and their small tumors combined with the high intra-abdominal location near the diaphragm of these cancers subject to respiratory motion image degradation are predictable impediments to quantitative MRI.
The potential of dynamic contrast-enhanced MRI analyzed with a simple mathematical model of tumor tissue to estimate tumor vascular richness (anatomy) and vascular leakiness (function) has been demonstrated previously in other models and in larger rodents (6). Moreover, quantitative MRI enhanced with macromolecular contrast media (MMCM) has been shown to sensitively detect and measure effects of multiple inhibitors of tumor angiogenesis including bevacizumab (Avastin™) (7), tyrosine kinase inhibitors (8), COX-2 inhibitors (9), matrix metalloproteinase inhibitors (10), and thalidomide (11); but all of the aforementioned studies were performed in xenograft tumors grown subcutaneously in immuno-compromised rats. It would be highly appealing to examine cancer angiogenesis by quantitative MRI in the RIP-Tag2 model offering the advantages of spontaneously-developing, orthotopic (pancreas) tumors in various stages of tumor progression without the potential disadvantages of xenografts and immuno-compromised animals.
Accordingly, the purpose of this study was to define the feasibility of dynamic contrast-enhanced MRI for the quantitative vascular characterization of spontaneously-developing pancreatic islet cell cancers in the transgenic RIP-Tag2 mouse model.
MATERIALS AND METHODS
Animals
The study was performed in accordance with the guidelines of the National Institutes of Health for the care and use of laboratory animals. Approval from our institutional Animal Care and Use Committee was obtained. RIP-Tag2 transgenic mice, n = 17, from the C57BL/6 mouse strain were studied between 14 to 16 weeks of age, when they were assumed, based on past experience with this mouse model, to harbor large pancreatic islet cell tumors. Mice weighted in a range from 23-32 grams.
Contrast agent
Albumin-(Gd-DTPA)35, a prototype macromolecular contrast medium (MMCM) not intended for clinical development, was administered intravenously in all mice at a dose of 0.03 mmolGd/kg body weight (12). Albumin-(Gd-DTPA)35 has a distribution volume closely approximating the blood volume (0.05 l/kg) and a relatively long plasma half-life of about 180 minutes in rodents (12,13). This same MMCM has been used extensively in the past for quantitative MRI tumor vascular characterizations in rats weighting roughly 10 times the weight of these mice (7-10). A biotin-labeled conjugate of our MMCM able to react with fluorescent-labeled streptavidin for microscopic tracing, albumin-Gd-(DTPA)27-(biotin)11, was synthesized following published methods (14,15).
MRI
For MRI, mice were anesthetized by inhalation of 2% isoflurane carried in 100% oxygen. A 27-gauge butterfly catheter (Abbott Laboratories, North Chicago, IL) was carefully inserted into a tail vein and secured with a splint and tape for contrast medium administration. In a minority of cases where a stable venous access could not be achieved via the tail vein, a catheter was inserted surgically into the right jugular vein. Mice were placed supine on a deuterated-water-filled heating pad to keep the body temperature at constant physiologic levels and positioned in a 3.8 cm diameter birdcage imaging coil.
MRI was performed using an Omega CSI-II system operating at 2.0 T (Bruker Instruments, Fremont, CA). This system is equipped with Acustar S-150 self-shielded gradient coils (20 G/cm, 15 cm inner diameter). For detection and initial localization of tumors, a coronal T1-weighted 3D SPGR sequence with the following parameters was used: TR = 50 msec, TE = 3 msec, NA = 4, flip angle (α) = 30°, matrix 256 × 128 × 64, FOV 64 × 32 × 32mm, yielding in-plane pixel dimension of 0.25 mm and slice partitions of 0.5 mm thickness. Once tumors were detected, all additional MRI acquisitions were performed in a transverse imaging plane allowing for coverage of all tumors in the abdomen. Pre-contrast tumor longitudinal relaxation rate (R1) values were measured by a series of 16 single-slice inversion recovery centric-ordered fast GRE image sequences (TR/TE = 6.0/1.5 ms, number of acquisitions (NA) = 1, flip angle (α) = 10°, matrix = 64 × 64, FOV = 32 × 32 mm, slice thickness = 2 mm) with TI varying between 100 ms and 2500 ms. Each image was reconstructed in phase-sensitive mode and R1 values for tumor regions were determined by a standard 3-parameter fit of signal intensity data to the following equation, SI = a − b exp(−TI*R1), as described previously (16). Then a series of 3D16 or 32 T1-weighted 3D SPGR sequences was acquired over 1 hr with contrast agent administered after the 2nd or 3rd image to dynamically measure the time course of signal increases in tumor and blood. The following parameters were used: TR = 50 msec, TE = 3 msec, NA = 1, flip angle (α) = 90°, matrix = 128 × 128 × 32 or 128 × 128 × 16, FOV = 32 × 32 × 32 mm, temporal resolution = 3.4 or 1.8 min.
Images were transferred to a Sun workstation (Sun Microsystems, Mountain View, CA) and analyzed using commercially available image analysis software (MRVision, The MRVision Co. Winchester, MA). Regions of interest (ROIs) were drawn and signal intensities recorded for the blood in the inferior vena cava (IVC) and the entire area of each tumor at the tumor equator. Post-contrast R1 values for tumor and blood were calculated from pre-contrast R1 values and signal intensities on dynamic 3D images obtained before and after contrast administration using the equation R1post= −ln[1−(SIpost/SIpre)(1−exp(−TR*R1pre))]/TR. Pre-contrast R1 for blood was taken to be 0.73 s−1 based on many historical measurements in rodent subjects (17). Differences between the pre-contrast and post-contrast R1 values (ΔR1) at any time were taken to be proportional to the concentration of the gadolinium contrast medium ([Gd+3]), either in the blood or in the tissue of interest (18).
The dynamic ΔR1 data from the blood and tumor were analyzed kinetically using a 2-compartment tumor tissue model describing the vascular and interstitial water spaces of the tumor for estimation of the fractional plasma volume (fPV, ml/cm3) and the endothelial transfer coefficient (KPS) (19, 20). The blood ΔR1 time course measured in the IVC was used as the input function for the tumor tissue model. Fractional PV estimates the plasma volume in the tumor and thus is a measure of vascular richness. A mono-exponential function was found to provide good fits to the albumin-(Gd-DTPA)35 blood ΔR1 data. All data fitting was performed using the SAAM II software (SAAM Institute, Seattle, WA), which employs a weighted, nonlinear least squares parameter estimation algorithm. Measurement errors in the ΔR1 data were assumed to be independent and Gaussian, with zero mean and fractional standard deviation (FSD) known within a scale factor determined from the data. Weights were optimally chosen, i.e., equal to the inverse of the variance of the measurement error. The precision of the model parameter value estimates was determined from the covariance matrix at the least squares fit (21). Our kinetic analysis also provides a measure of noise in the data sets likely due to respiratory motion or whole animal movement. A standard of precision was uniformly applied to all tumor data sets that normalized residuals having coefficients of variation greater than 25% were excluded from analysis. These tumors exhibited excessive noise likely resulting from respiratory motion attributable to locations close to the diaphragm.
Lectin perfusion and tumor fixation
At the completion of the MR imaging with the mice still living, 100 μg of fluorescein isothiocyanate-labeled (green) Lycopersicon esculentum lectin in 100 μl of 0.9% NaCl (Vector Laboratories, Burlingame, CA) was injected intravenously using the tail vein catheter (22). Lycopersicon esculentum lectin is a stable glycoprotein of about 100,000 Da containing about 50% arabinose and galactose. When injected intravenously this lectin binds N-acetylglucosamine oligomers, consistently present on the luminal surface of blood vessels. Thus, because lectin binds to the inner surface of those vessels being perfused and because the lectin used in this study was labeled with fluorescein isothiocyanate (green fluorescence), perfused blood vessels could be identified as green under the fluorescent microscope. After a two-minute period for distribution of the lectin, the chest was then opened rapidly, the left ventricle was cannulated under direct observation, and an incision was made in the left atrium to allow for the escape of blood (22). Then the mice were perfused for an additional two minutes with 1% paraformaldehyde (PFA) in PBS, pH 7.4 (Sigma, St. Louis MO) at a pressure of 120 mmHg to flush out the blood and any non-bound lectin. The abdomen was then opened and the internal organs inspected and photographed. The pancreatic tumors identified and localized by MRI were labeled in situ according to their location in the corresponding in vivo MR images, dissected, and measured by caliber applying the formula for volume = 0.52 × (width) × (length) × (height).
To define the microscopic localization of the MMCM distribution within tumor sections, an additional group of five untreated RIP-Tag2 mice were injected i.v. with albumin-Gd-(DTPA)27-(biotin)11 and after 1 hour were perfused as described above. No MRI was performed in these mice.
Tumors were then immersed in fixative, 1% PFA in PBS for 1 hour at 4°, rinsed several times with PBS, infiltrated with 30% sucrose, frozen in Tissue-Tek OCT (Optimal Cutting Temperature) compound, and processed for immunohistochemistry.
Immunohistochemistry
Cryostat sections of tumors, 80-μm in thickness, were dried on Superfrost Plus slides (Fisher Scientific, Pittsburgh, PA) overnight. Specimens were permeabilized with PBS containing 0.3% Triton X-100 (Lab Chem Inc., Pittsburgh, PA) and incubated in 5% normal goat serum (Jackson ImmunoResearch, West Grove, PA) in PBS+ [PBS containing 0.3% Triton X-100, 0.2% bovine serum albumin (Sigma), and 0.01% thimerosal (Sigma)] for 1 hour at room temperature to block any potential nonspecific antibody binding. Sections were incubated with primary antibody diluted in 5% normal goat serum in PBS+ for 12 to 15 hours at room temperature. Endothelial cells lining all tumor blood vessels, whether lectin-stained or not, whether perfused or not, were identified by staining tissue sections with hamster monoclonal anti-CD31, specific for the PECAM-1 antigen expressed on all mouse endothelial cells (clone MEC 13.3, 1:500, Pharmingen, San Diego, CA). Furthermore, RIP-Tag2 tumors are characterized by the presence of extensive hemorrhages or “blood lakes” (sites of accumulation of extravasated erythrocytes). In order to identify the blood lakes, tumor sections were stained with rat monoclonal anti-TER119 (TER119, Erythroid cells, Ly-76) antibody (1:250, eBioscience, San Diego, CA). The TER119 antibody reacts with erythroid cells at different stages of development (early pro-erythroblasts to mature erythrocytes). After rinsing the primary antibody with PBS containing 0.3% Triton X-100, specimens were further incubated for 4 to 6 hours at room temperature with Cy3-conjugated anti-rat secondary antibody or Cy3 or Cy5-conjugated anti-hamster or anti-rat secondary antibody (all used 1:400, Jackson ImmunoResearch Inc., West Grove, PA) diluted in 5% normal serum in PBS+. Specimens were then rinsed with PBS containing 0.3% Triton X-100, fixed in 4% PFA in PBS, rinsed again with PBS, and mounted in Vectashield (Vector Laboratories) used as a preservative. To detect the extravasated albumin-(Gd-DTPA)27-(biotin)11 in the tumor sections Cy3-labeled streptavidin (1:400, Jackson ImmunoResearch Inc., West Grove, PA) was used for staining. Streptavidin is a tetrameric protein that binds tightly to the small molecule biotin, which was included as a component in each contrast medium molecule.
Hematoxylin and eosin staining (H&E)
RIP-Tag2 tumor specimens from perfusion-fixed 15-week old RIP-Tag2 mice (n = 3) were embedded in paraffin, sectioned at 5 μm, and stained with H & E (Biopathology Sciences Medical, South San Francisco, CA).
Contrast media and blood lake co-localization
As an estimate of what proportion of blood lakes contained the biotinylated contrast medium, the amount of co-localization of contrast agent, assayed by streptavidin staining of the MMCM-biotin label, and of blood lakes, assayed by TER119 staining, was assessed on fluorescence microscopic images of 80-μm sections of RIP-Tag2 tumors. Digital images of the red channel (streptavidin) and green channel (TER119) were captured separately on the Axiophot fluorescence microscope (10× objective, 1× Optovar) (23). The “Co-localization” plug-in function of Image J was used to identify pixels that had fluorescence intensity in both red and green channels equal to or greater than a threshold value, ranging between 30 and 45. Degree of co-localization was expressed as a percentage calculated from the number of pixels with above-threshold TER119 staining that co-localized with above-threshold streptavidin staining divided by the total number of above-threshold pixels in the TER119 image.
Lectin and extravascular blood lake area-density assays
Specimens were examined with a Zeiss Axiophot fluorescence microscope to calculate the lectin area density, representing only the perfused vessels, and the TER119 area density, representing the extravasated erythrocyte. In detail, digital fluorescence microscopic images measuring 960 × 1280 μm (10× objective, 1× Optovar) were captured from 80 μm-thick sections from each excised RIP-Tag2 tumor. Images were analyzed by using ImageJ software (http://rsb.info.nih.gov/ij) (22). Based on an analysis of pixel fluorescence intensities, which ranged from 0 to 255, specific staining was distinguished from background by using an empirically determined threshold value of 35. Area densities of blood vessels stained with lectin or hemorrhages-blood lakes (erythrocytes) were calculated as the fraction (%) of total pixels having a fluorescence intensity value equal to or greater than the threshold (22). In addition, a Zeiss LSM 510 laser-scanning confocal microscope was used to generate detailed images for purposes of illustration.
In the 80-μm sections some regions of the lectin staining overlapped the regions of TER119 staining. Therefore the combined lectin and blood lakes (TER119) area densities were calculated as a fraction (%) of the sum of the pixels where lectin and TER119 co-localized, plus those pixels where lectin was not co-localized with TER119, and pixels where TER119 was not co-localized with lectin.
Statistical analysis
Results are given as mean values ± standard deviation (SD). Correlation between fPV determinations and lectin area density alone or combined with the hemorrhages area density measurements from the same tumors was assessed using standard Pearson correlation. All statistical testing was performed using the GraphPad Prism Software (GraphPad Inc., San Diego, CA). P values smaller than 0.05 were considered statistically significant. Point estimates of values for KPS having coefficients of variation of 75% or greater were for this analysis considered not significantly different from zero.
RESULTS
In seventeen RIP-Tag2 mice having 29 tumors visualized on the pre-contrast MR images, dynamic post-contrast MRI and perfusion fixation were successfully completed (Figure 1). Applying our statistical criterion to ensure a reasonable level of data precision, ten tumors were excluded because they had residuals with an average coefficient of variation greater than 25% (Figure 2A). The remaining 19 RIP-Tag2 tumors (weight range from 20 to 905 mg) had residuals with an average coefficient of variation of 17% and were kinetically analyzed providing estimates of fPV and KPS (Figure 2B). All values of fPV and KPS with their associated uncertainties are shown in Table 1. Values of fPV ranged from 0.024 to 0.141 ml/cm3, corresponding to a qualitatively broad range of overall vascular richness, both on an inter- and intra-tumoral basis (Figure 1C and D; Table 1). The endothelial transfer coefficient, KPS, varied from 0 (no detectable leakiness) to 0.356 ml /min/100cm3 (Table 1). The calculated uncertainties (coefficients of variation) for fPV and KPS averaged 10% and 31%, respectively (Table 1). The coefficients of variation of the residuals for the blood responses used as the input function for the tumor tissue model were uniformly good in all studies with an average value of 8%.
Figure 1.

Photos of the in situ pancreatic tumors in 15-week old RIP-Tag2 mouse. Notice the multiplicity of tumors located in different areas of the pancreas with colors varying from deep purple (Tumor A: 364 mg) to pink (Tumor D: 18 mg) (A and B). High resolution coronal MR images of a RIP-Tag2 mouse before (C) and after injection (D) of albumin-(Gd-DTPA)35 (60 minute post-contrast injection) showing the variation in contrast enhancement both between different tumors (Tumor C on the left and Tumor A on the right, corresponding to tumor numbering in B) and within a single tumor. The smaller tumors and the cluster of small tumors seen in situ were not resolved on these images. Scale bar = 2 mm (A and B) and 5 mm (B and C).
Figure 2.

Plot of dynamic tumor enhancement response for a RIP-Tag2 tumor located close to the diaphragm (A). Plot of tumor enhancement response for a different tumor having relatively little noise (Same lesion as tumor “A” in figure 1) (B). In both graphs, the triangles (Δ) represent ΔR1 values for blood and the ellipses (0) represent ΔR1 tumor values. The solid lines represent the best fits.
Table 1.
Table showing the range of weight (mg); combined lectin and TER119 area densities (%); fPV (ml/cm3); Kps (μl/min/100cm3) and corresponding coefficients of variation for all the 19 RIP-Tag2 tumors analyzed.
| Tumor number (by chronology) |
Weight (mg) | TER119 + lectin area densities (%) * |
fPV (ml/cm3) | Coefficients of variant (%) for fPV |
Kps (ml/min/100cm3) | Coefficients of variant (%) for Kps |
|---|---|---|---|---|---|---|
|
| ||||||
| Tumor 1 | 24 | 92 | 0.141 | 11 | 0.112 | 32 |
| Tumor 2 | 20 | 69 | 0.085 | 7 | 0.083 | 17 |
| Tumor 3 | 171 | 46 | 0.050 | 7 | 0.070 | 15 |
| Tumor 4 | 364 | 81 | 0.103 | 14 | 0.356 | 13 |
| Tumor 5 | 905 | 46 | 0.088 | 3 | 0 | - |
| Tumor 6 | 184 | 52 | 0.042 | 18 | 0.062 | 48 |
| Tumor 7 | 64 | 64 | 0.092 | 13 | 0.077 | 45 |
| Tumor 8 | 180 | 51 | 0.081 | 12 | 0.075 | 39 |
| Tumor 9 | 465 | 64 | 0.112 | 5 | 0 | - |
| Tumor 10 | 83 | 65 | 0.112 | 6 | 0 | - |
| Tumor 11 | 25 | 77 | 0.114 | 14 | 0 | - |
| Tumor 12 | 24 | 65 | 0.051 | 14 | 0.153 | 18 |
| Tumor 13 | 23 | 65 | 0.051 | 7 | 0 | - |
| Tumor 14 | 43 | 55 | 0.059 | 10 | 0 | - |
| Tumor 15 | 294 | 38 | 0.024 | 7 | 0.007 | 73 |
| Tumor 16 | 84 | 45 | 0.036 | 7 | 0.037 | 22 |
| Tumor 17 | 182 | 51 | 0.061 | 14 | 0.087 | 32 |
| Tumor 18 | 130 | 57 | 0.078 | 5 | 0 | - |
| Tumor 19 | 586 | 46 | 0.032 | 10 | 0.062 | 15 |
The combined lectin and TER119 area density was calculated as the fraction (%) of the sum of the pixels where lectin and TER119 co-localized, plus those pixels where lectin was not co-localized with TER119, and pixels where TER119 was not co-localized with lectin.
Tumor microscopic lectin area-density assays in the same tumors showed a broad range of vascular richness with some RIP-Tag2 tumors being densely vascularized while others having relatively few blood vessels (Figure 3A-C). The lectin area-density assays, specific for perfused, endothelial-lined vessels, ranged from 20 to 53% (Figure 3D).
Figure 3.

Individual variability of densities for perfused vessels (lectin staining, green) and blood lakes (TER119 staining, red) with microscopic confocal fluorescent examples. In general there was a large range in the density of perfused blood vessels (A-C), as well as in the density of blood lakes (F-G). Image of RIP-Tag2 tumor stained with H & E shows the presence of blood lakes (black arrows) (E). The histograms D and H show the lectin and TER119 area densities for each tumor. The ordering of the tumors in the histograms D and H were the same and corresponded to the tumor numbering in Table 1. Notice that the variation in lectin area density appeared to be independent of the variation of blood lake density. Scale bar = 450 μm.
The dissected RIP-Tag2 tumors, after perfused blood vessels were flushed, showed a wide variation in degree of visual redness, from light pink to strong red, suggesting a broad range of extra-vascular blood collections, or “blood lakes” (Figure 1A and B). The H & E staining (Figure 3E) and the staining with an antibody against the erythrocyte marker TER119 (Figure 3F and G), confirmed the presence and variability in amount of blood lakes among the tumors. Indeed the density of tumor blood lakes assessed by area-density assays of extravasated erythrocytes stained with TER119, ranged widely between 25% and 57% (Figure 3H).
The fPV values of individual tumor assayed by MRI correlated positively and significantly (r = 0. 79, p < 0.001) with the combined microscopic area-densities of lectin-perfused blood vessels and erythrocyte-containing blood lakes (Figure 4).
Figure 4.
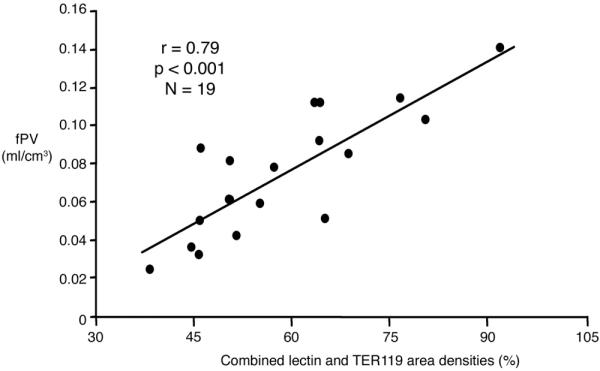
Graph showing the significant positive correlation, r = 0.79 p < 0.001 for each examined tumor (N = 19) between the MRI-assayed fractional plasma volume (fPV, ml/cm3) and the immunohistochemically assessed lectin and TER119 combined area-densities (%). The solid line denotes the best fit. Since two tumors had precisely the same values for fPV and for lectin and TER119 combined area-densities (see Table 1), the total number of points in the graph appears to be 18 instead of the actual 19 points.
To confirm the presence of the macromolecular contrast media in the blood lakes and to define the distribution pattern after a period in which the contrast could leak from the blood into the extravascular space, albumin-Gd-(DTPA)27-(biotin)11was administered intravenously and allowed to distribute for 1 hr prior to perfusion fixation. After 60 minutes of circulation the MMCM diffused not only into the extravascular space surrounding tumor blood vessels but also in some of the blood lakes (Figure 5). Measurement of the colocalization between TER119 and streptavidin staining revealed that the contrast agent was present in 25% of the TER119-stained blood lakes, but not in the remaining 75%.
Figure 5.

Representative confocal images of a RIP-Tag2 tumor sections, 80-μm thick, showing the blood vessels (CD31 staining, green, A), blood lakes (erythrocytes, TER119 antibody, red, B) and the 60-minute distribution of the macromolecular contrast medium (streptavidin-biotin reaction, red, A). The co-localization of the TER119 staining and the streptavidin staining shows the presence of the contrast in some blood lakes (C, yellow arrow) but not in all (C, white arrows). In RIP-Tag2 tumors the albumin-(Gd-DTPA)27-(biotin)11 distributed not only around the blood vessels indicating leakiness of some tumor vessels but also in some regions with extravasated erythrocytes. High magnification confocal image of tissue sections only 3-μm thick (E-G) confirmed the localization of some contrast media - streptavidin staining (light blue, E) - next to extravasated erythrocytes - TER119 staining (red, F) - rather than being superimposed from the tissue above or below the blood lakes (G). Scale bar = 50 μm (A, B and C) and 25 μm (D, E and F).
DISCUSSION
These results confirm the feasibility of performing dynamic contrast-enhanced MRI for the quantitative vascular characterization of pancreatic islet cell tumors in the transgenic RIP-Tag2 mouse model. Despite technical obstacles including small size of mice, small size and variable position of tumors within the upper abdomen, and potential motion degradation of image quality due to proximity of nearby moving diaphragms, MRI estimates of fractional plasma volumes (fPV) and coefficients of endothelial permeability (KPS) can be reliably defined for tumors weighing more than 20 mg. While overall data quality in these RIP-Tag2 tumors in mice (average CV of normalized residuals of 17% and 8% for tumor and blood, respectively) is not as good as reported results from rat tumors (average CV of normalized residuals of 10% and 5% for tumor and blood, respectively), the former were found to be suitable for kinetic analysis providing reasonable precision for fPV and KPS (Table 1) (11). Establishing the feasibility of non-invasive imaging and characterization of RIP-Tag2 cancers is important because this unique tumor model continues to be used extensively as a general prototype for the pathways, parameters, and molecular mechanisms of multistage tumorigenesis (24). Recognized strengths of this islet cell tumor model are that these cancers arise in their natural tissue microenvironment, the pancreas, and progress through multiple stages, as do human cancers (5). Since RIP-Tag2 tumors are VEGF-driven, highly vascularized tumors they have been chosen frequently to examine the effects of numerous angiogenesis inhibitors, including VEGF, PDGF and FGF inhibitors (22,23,25,26). Unlike xenograft tumor models that grow superficially, these orthotopic intra-abdominal cancers have necessitated invasive techniques for monitoring their status in the past. Recently, Cao and coworkers have published high quality MR images of RIP-Tag2 cancers, but without dynamic imaging or quantitative contrast agent kinetic-based tumor characterizations (27).
In the present study we applied a dynamic MRI imaging technique combined with analysis using a simple mathematical model of tumor tissue permeability with the goal to not only identify and size RIP-Tag2 islet cell tumors but also to estimate quantitatively their blood volumes and their vessel permeability. Future application for this MRI technique in RIP-Tag2 mice could be advantageous for defining effects, timing, and interactions of angiogenesis inhibitors. Our study differs from that of Cao and coworkers in several respects; they used gadobutrol (Gadovist™, Bayer), a relatively small-molecular contrast agent in 8 to 12-week old RIP-Tag2 mice while we examined 14 to 16 week old RIP-Tag2 tumors enhanced with albumin-(Gd-DTPA)30, a macromolecular contrast medium (MMCM) (12). Older mice were chosen to yield larger tumors, which are more easily imaged. The macromolecular albumin-based contrast agent was chosen for its past successful application in other MRI studies for quantitative assays of tumor vascularity (7-10).
Macromolecular solutes including proteins and MMCM have been shown consistently to remain largely intravascular in normal tissues but to diffuse through the abnormal endothelial barriers into the interstitial extra-vascular spaces of virtually all types of cancer—animal and human (28,29). As exemplified in Figure 2, the combined use of MMCM and dynamic imaging can generate data of sufficient quality to define the kinetic behavior of the contrast agent in large blood vessels, represented by the inferior vena cava, and within the pancreatic tumors. Fitting a two-compartment tumor tissue model to these dynamic data permitted the estimation of both fPV and KPS (19).
MRI assays of vascular richness, represented quantitatively by the fractional plasma volume (fPV), correlated significantly (r = 0.79, p < 0.001) with the microscopic estimates of the combined percent area-densities of lectin-stained, perfused, endothelial-lined blood vessels and TER119-stained erythrocytes present in non-endothelial-lined extra-vascular blood lakes. If the area densities of the blood lakes were ignored by comparing fPV to lectin-area density alone, no significant correlation (r = 0.10, p = 0.66) was observed, thus, underscoring the overall importance of the blood lakes in this tumor model. These results further indicate that the macromolecular contrast agent molecules can and do distribute, like plasma, beyond the confines of cell-lined blood vessels as may occur in cancers.
Extravascular cell-lined lakes of erythrocytes, a conspicuous and consistent feature of RIP-Tag2 tumors, are also reported in some human malignancies (4). In Ewing sarcoma the presence and number of blood lakes was observed to correlate with patient survival indicating that blood lakes may be a useful sign of poor prognosis (30). Using India ink or FITC-conjugated dextran as tracers, a communication between tumor vasculature and non-endothelial cell-lined spaces was demonstrated in human Ewing sarcomas implanted in nude mice (30). The correlation between the fPV and area-densities of perfused blood vessels and extravascular blood lakes suggest that the contrast media distributes in both these two blood-containing compartments. Immunohistochemically stained microscopic sections demonstrated only a partial co-localization of erythrocyte-filled blood lakes with the biotin-labeled macromolecular contrast medium (MMCM) after one hour of circulation, suggesting two separately definable populations of blood lakes. The areas in which blood lakes and MMCM co-localized could be consistent with these blood lakes being sites of acute, active hemorrhage allowing both erythrocytes and macromolecules to distribute from blood vessels into extravascular, non-endothelial-lined spaces, whereas those extra-vascular blood lakes that were not accessible after one hour of circulation to the MMCM may be sites of non-active, former micro-hemorrhage. Based on these data, one can speculate on the nature of a discontinuous connection between blood vessels and blood lakes. Perhaps the sites of erythrocyte extravasation on the tumor blood vessels may open, close, and re-open over time.
In summary, the present study establishes the feasibility of dynamic quantitative MMCM-enhanced MRI for the RIP-Tag2 pancreatic islet cell mouse cancers and for estimating non-invasively their vascular permeability and vascular density. The validity of the MRI plasma volume estimates is supported by a positive correlation with immunohistochemical microscopic analyses. This MRI technique, although somewhat limited by several potential technical obstacles including small size and motion, can be used in future studies of RIP-Tag2 cancers designed to more completely understand this seminal angiogenic tumor model.
Acknowledgments
Funded by NIH grants RO1 CA082923, HL-24136, HL-59157 and CA103850.
REFERENCES
- 1.Hanahan D. Heritable formation of pancreatic beta-cell tumours in transgenic mice expressing recombinant insulin/simian virus 40 oncogenes. Nature. 1985;315(6015):115–122. doi: 10.1038/315115a0. [DOI] [PubMed] [Google Scholar]
- 2.Bergers G, Hanahan D, Coussens LM. Angiogenesis and apoptosis are cellular parameters of neoplastic progression in transgenic mouse models of tumorigenesis. Int J Dev Biol. 1998;42(7):995–1002. [PubMed] [Google Scholar]
- 3.Ludlow JW. Interactions between SV40 large-tumor antigen and the growth suppressor proteins pRB and p53. Faseb J. 1993;7(10):866–871. doi: 10.1096/fasebj.7.10.8344486. [DOI] [PubMed] [Google Scholar]
- 4.Hashizume H, Baluk P, Morikawa S, McLean JW, Thurston G, Roberge S, Jain RK, McDonald DM. Openings between defective endothelial cells explain tumor vessel leakiness. Am J Pathol. 2000;156(4):1363–1380. doi: 10.1016/S0002-9440(10)65006-7. [DOI] [PMC free article] [PubMed] [Google Scholar]
- 5.Hanahan D, Christofori G, Naik P, Arbeit J. Transgenic mouse models of tumour angiogenesis: the angiogenic switch, its molecular controls, and prospects for preclinical therapeutic models. Eur J Cancer. 1996;32A(14):2386–2393. doi: 10.1016/s0959-8049(96)00401-7. [DOI] [PubMed] [Google Scholar]
- 6.Preda A, van Vliet M, Krestin GP, Brasch RC, van Dijke CF. Magnetic resonance macromolecular agents for monitoring tumor microvessels and angiogenesis inhibition. Invest Radiol. 2006;41(3):325–331. doi: 10.1097/01.rli.0000186565.21375.88. [DOI] [PubMed] [Google Scholar]
- 7.Raatschen HJ, Simon GH, Fu Y, Sennino B, Shames DM, Wendland MF, McDonald DM, Brasch RC. Vascular permeability during antiangiogenesis treatment: MR imaging assay results as biomarker for subsequent tumor growth in rats. Radiology. 2008;247(2):391–399. doi: 10.1148/radiol.2472070363. [DOI] [PMC free article] [PubMed] [Google Scholar]
- 8.Wilmes LJ, Pallavicini MG, Fleming LM, Gibbs J, Wang D, Li KL, Partridge SC, Henry RG, Shalinsky DR, Hu-Lowe D, Park JW, McShane TM, Lu Y, Brasch RC, Hylton NM. AG-013736, a novel inhibitor of VEGF receptor tyrosine kinases, inhibits breast cancer growth and decreases vascular permeability as detected by dynamic contrast-enhanced magnetic resonance imaging. Magn Reson Imaging. 2007;25(3):319–327. doi: 10.1016/j.mri.2006.09.041. [DOI] [PubMed] [Google Scholar]
- 9.Fournier LS, Novikov V, Lucidi V, Fu Y, Miller T, Floyd E, Shames DM, Brasch RC. MR monitoring of cyclooxygenase-2 inhibition of angiogenesis in a human breast cancer model in rats. Radiology. 2007;243(1):105–111. doi: 10.1148/radiol.2431050658. [DOI] [PubMed] [Google Scholar]
- 10.Wiart M, Fournier LS, Novikov VY, Shames DM, Roberts TP, Fu Y, Shalinsky DR, Brasch RC. Magnetic resonance imaging detects early changes in microvascular permeability in xenograft tumors after treatment with the matrix metalloprotease inhibitor Prinomastat. Technol Cancer Res Treat. 2004;3(4):377–382. doi: 10.1177/153303460400300408. [DOI] [PubMed] [Google Scholar]
- 11.Cyran CC, Sennino B, Chaopathomkul B, Fu Y, Rogut VS, Shames DM, Wendland MF, McDonald DM, Brasch RC. Magnetic resonance imaging for monitoring the effects of thalidomide on experimental human breast cancers. Eur Radiol. 2009;19(1):121–31. doi: 10.1007/s00330-008-1111-x. [DOI] [PMC free article] [PubMed] [Google Scholar]
- 12.Ogan MD. Albumin labeled with Gd-DTPA: an intravascular contrast-enhancing agent for magnetic resonance blood pool imaging: preparation and characterization. Invest Radiol. 1988;23(12):961. [PubMed] [Google Scholar]
- 13.Schmiedl U, Brasch RC, Ogan MD, Moseley ME. Albumin labeled with Gd-DTPA. An intravascular contrast-enhancing agent for magnetic resonance blood pool and perfusion imaging. Acta Radiol Suppl. 1990;374:99–102. [PubMed] [Google Scholar]
- 14.van Dijke CF, Mann JS, Rosenau W, Wendland MF, Roberts TP, Roberts HC, Demsar F, Brasch RC. Comparison of MR contrast-enhancing properties of albumin-(biotin)10-(gadopentetate)25, a macromolecular MR blood pool contrast agent, and its microscopic distribution. Acad Radiol. 2002;9(Suppl 1):S257–260. doi: 10.1016/s1076-6332(03)80451-8. [DOI] [PubMed] [Google Scholar]
- 15.Cyran CC, Sennino B, Chaopathomkul B, Fu Y, Rogut V, Shames DM, Wendland MF, McDonald DM, Brasch RC. Magnetic resonance imaging assays for dimethyl sulfoxide effect on cancer vasculature. Invest Radiol. 2008;43(5):298–305. doi: 10.1097/RLI.0b013e318164b71d. [DOI] [PMC free article] [PubMed] [Google Scholar]
- 16.Turetschek K, Floyd E, Helbich T, Roberts TP, Shames DM, Wendland MF, Carter WO, Brasch RC. MRI assessment of microvascular characteristics in experimental breast tumors using a new blood pool contrast agent (MS-325) with correlations to histopathology. J Magn Reson Imaging. 2001;14(3):237–242. doi: 10.1002/jmri.1179. [DOI] [PubMed] [Google Scholar]
- 17.Schwickert HC, Roberts TP, Shames DM, van Dijke CF, Disston A, Muhler A, Mann JS, Brasch RC. Quantification of liver blood volume: comparison of ultra short TI inversion recovery echo planar imaging (ULSTIR-EPI), with dynamic 3D-gradient recalled echo imaging. Magn Reson Med. 1995;34(6):845–852. doi: 10.1002/mrm.1910340609. [DOI] [PubMed] [Google Scholar]
- 18.Roberts TP, Brasch RC, Schwickert HC, Shames DM, vanDijke CF, Stiskal M, Mann JS, Muhler A, Demsar F. Quantification of tissue gadolinium concentration using magnetic resonance imaging: comparison of ultrashort inversion time inversion recovery echoplanar and dynamic three-dimensional spoiled gradient-recalled approaches with in vitro measurements. Acad Radiol. 1996;3(Suppl 2):S282–285. doi: 10.1016/s1076-6332(96)80557-5. [DOI] [PubMed] [Google Scholar]
- 19.Daldrup H, Shames DM, Wendland M, Okuhata Y, Link TM, Rosenau W, Lu Y, Brasch RC. Correlation of dynamic contrast-enhanced magnetic resonance imaging with histologic tumor grade: comparison of macromolecular and small-molecular contrast media. Pediatr Radiol. 1998;28(2):67–78. doi: 10.1007/s002470050296. [DOI] [PubMed] [Google Scholar]
- 20.Daldrup HE, Shames DM, Husseini W, Wendland MF, Okuhata Y, Brasch RC. Quantification of the extraction fraction for gadopentetate across breast cancer capillaries. Magn Reson Med. 1998;40(4):537–543. doi: 10.1002/mrm.1910400406. [DOI] [PubMed] [Google Scholar]
- 21.Cobelli C, Foster D, Toffolo G. Tracer Kinetics in Biomedical Research. Kluwer Academic/Plenum Publishers; New York: 2000. [Google Scholar]
- 22.Inai T, Mancuso M, Hashizume H, Baffert F, Haskell A, Baluk P, Hu-Lowe DD, Shalinsky DR, Thurston G, Yancopoulos GD, McDonald DM. Inhibition of vascular endothelial growth factor (VEGF) signaling in cancer causes loss of endothelial fenestrations, regression of tumor vessels, and appearance of basement membrane ghosts. Am J Pathol. 2004;165(1):35–52. doi: 10.1016/S0002-9440(10)63273-7. [DOI] [PMC free article] [PubMed] [Google Scholar]
- 23.Mancuso MR, Davis R, Norberg SM, O’Brien S, Sennino B, Nakahara T, Yao VJ, Inai T, Brooks P, Freimark B, Shalinsky DR, Hu-Lowe DD, McDonald DM. Rapid vascular regrowth in tumors after reversal of VEGF inhibition. J Clin Invest. 2006;116(10):2610–2621. doi: 10.1172/JCI24612. [DOI] [PMC free article] [PubMed] [Google Scholar]
- 24.Bergers G, Javaherian K, Lo KM, Folkman J, Hanahan D. Effects of angiogenesis inhibitors on multistage carcinogenesis in mice. Science. 1999;284(5415):808–812. doi: 10.1126/science.284.5415.808. [DOI] [PubMed] [Google Scholar]
- 25.Bergers G, Song S, Meyer-Morse N, Bergsland E, Hanahan D. Benefits of targeting both pericytes and endothelial cells in the tumor vasculature with kinase inhibitors. J Clin Invest. 2003;111(9):1287–1295. doi: 10.1172/JCI17929. [DOI] [PMC free article] [PubMed] [Google Scholar]
- 26.Sennino B, Falcon BL, McCauley D, Le T, McCauley T, Kurz JC, Haskell A, Epstein DM, McDonald DM. Sequential loss of tumor vessel pericytes and endothelial cells after inhibition of platelet-derived growth factor B by selective aptamer AX102. Cancer Res. 2007;67(15):7358–7367. doi: 10.1158/0008-5472.CAN-07-0293. [DOI] [PMC free article] [PubMed] [Google Scholar]
- 27.Cao X, Jia G, Zhang T, Yang M, Wang B, Wassenaar PA, Cheng H, Knopp MV, Sun D. Non-invasive MRI tumor imaging and synergistic anticancer effect of HSP90 inhibitor and glycolysis inhibitor in RIP1-Tag2 transgenic pancreatic tumor model. Cancer Chemother Pharmacol. 2008;62(6):985–994. doi: 10.1007/s00280-008-0688-8. [DOI] [PubMed] [Google Scholar]
- 28.Dvorak HF, Nagy JA, Dvorak JT, Dvorak AM. Identification and characterization of the blood vessels of solid tumors that are leaky to circulating macromolecules. Am J Pathol. 1988;133(1):95–109. [PMC free article] [PubMed] [Google Scholar]
- 29.Gerlowski LE, Jain RK. Microvascular permeability of normal and neoplastic tissues. Microvasc Res. 1986;31(3):288–305. doi: 10.1016/0026-2862(86)90018-x. [DOI] [PubMed] [Google Scholar]
- 30.van der Schaft DW, Hillen F, Pauwels P, Kirschmann DA, Castermans K, Egbrink MG, Tran MG, Sciot R, Hauben E, Hogendoorn PC, Delattre O, Maxwell PH, Hendrix MJ, Griffioen AW. Tumor cell plasticity in Ewing sarcoma, an alternative circulatory system stimulated by hypoxia. Cancer Res. 2005;65(24):11520–11528. doi: 10.1158/0008-5472.CAN-05-2468. [DOI] [PubMed] [Google Scholar]