Abstract
The majority of genetic variants associated with common human diseases map to enhancers, non-coding elements that shape cell-type-specific transcriptional programs and responses to extracellular cues1–3. Systematic mapping of functional enhancers and their biological contexts is required to understand the mechanisms by which variation in non-coding genetic sequences contributes to disease. Functional enhancers can be mapped by genomic sequence disruption4–6, but this approach is limited to the subset of enhancers that are necessary in the particular cellular context being studied. We hypothesized that recruitment of a strong transcriptional activator to an enhancer would be sufficient to drive target gene expression, even if that enhancer was not currently active in the assayed cells. Here we describe a discovery platform that can identify stimulus-responsive enhancers for a target gene independent of stimulus exposure. We used tiled CRISPR activation (CRISPRa)7 to synthetically recruit a transcriptional activator to sites across large genomic regions (more than 100 kilobases) surrounding two key autoimmunity risk loci, CD69 and IL2RA. We identified several CRISPRa-responsive elements with chromatin features of stimulus-responsive enhancers, including an IL2RA enhancer that harbours an autoimmunity risk variant. Using engineered mouse models, we found that sequence perturbation of the disease-associated Il2ra enhancer did not entirely block Il2ra expression, but rather delayed the timing of gene activation in response to specific extracellular signals. Enhancer deletion skewed polarization of naive T cells towards a pro-inflammatory T helper (TH17) cell state and away from a regulatory T cell state. This integrated approach identifies functional enhancers and reveals how non-coding variation associated with human immune dysfunction alters context-specific gene programs.
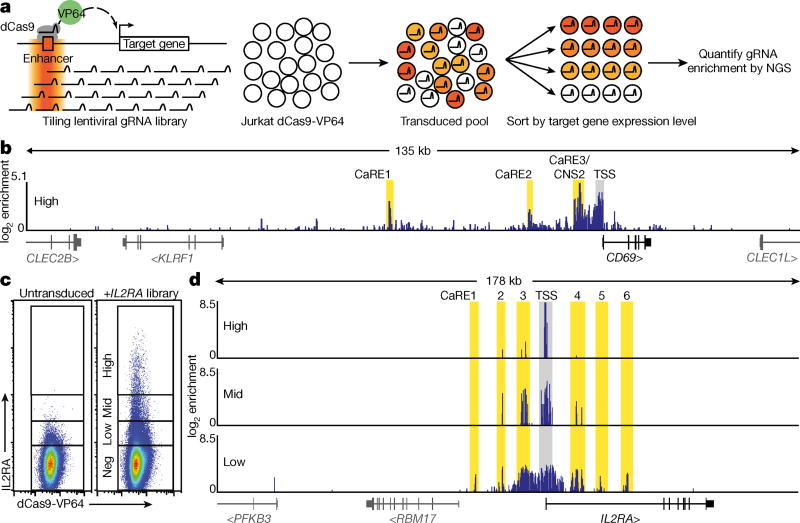
We adopted CRISPRa for high-throughput functional enhancer discovery with large libraries of guide RNAs (gRNAs) that tile genomic loci of interest (Fig. 1a). We first validated the CRISPRa method for enhancer discovery at the CD69 locus, which contains a previously characterized stimulation-responsive enhancer8. CD69 is a cell surface receptor that is rapidly induced on T cells in response to T cell receptor (TCR) stimulation9. We asked whether CRISPRa could identify CD69 cis-regulatory elements in resting cells, even in the absence of TCR stimulation. We transduced resting Jurkat T cells stably expressing catalytically inactive Cas9 fused to the transcriptional activator VP64 (dCas9-VP64) with a pooled lentiviral library of gRNAs (10,780 gRNAs) that targeted sites at all Streptococcus pyogenes Cas9 protospacer adjacent motifs (PAMs) throughout a 135 kb region at the CD69 locus, starting 100 kb upstream of the transcription start site (TSS) and extending through the gene body and 25 kb downstream (Fig. 1). We sorted transduced cells into four bins of CD69 expression and measured the distribution of gRNAs in the sorted populations (Fig. 1b and Extended Data Figs 1, 2). As expected, the cells with high CD69 expression were enriched for gRNAs targeting the CD69 TSS10 (Fig. 1b). We also observed enrichment for gRNAs at three regions well outside the TSS-centric CRISPRa window. We refer to these sites as CRISPRa-responsive elements (CaREs). One of the three CD69 CaREs represents a previously characterized stimulation-responsive enhancer referred to as conserved non-coding sequence 2 (CNS2)8. Hence, tiling a transcriptional activator (dCas9-VP64) to non-coding sequences can identify stimulation-responsive enhancers in unstimulated cells.
Figure 1. Discovery of putative enhancers with a tiling CRISPRa screen.
a, Schematic of the CRISPRa screen workflow. b, Genomic coordinates of gRNAs plotted against enrichment into the ‘CD69 high’ sorted population. Fold-enrichment over gRNA abundance in unsorted cells is plotted in 5-gRNA sliding windows. Peaks of guide activity are highlighted. c, Flow cytometry distribution of IL-2Ra expression on Jurkat-dCas9-VP64 cells transduced with the IL2RA tiling gRNA library. d, Genomic coordinates of gRNAs plotted against enrichment into the IL-2Ra ‘high’, ‘mid’, and ‘low’ sorted population, plotted as in b.
We next applied our enhancer-discovery approach to the IL2RA locus. IL2RA encodes a subunit of the high-affinity interleukin-2 (IL-2) receptor (IL-2Ra, also known as CD25). Genome-wide association studies (GWAS) have implicated non-coding variants in the IL2RA locus as risk factors for at least eight autoimmune disorders, underscoring the important role of IL2RA regulation in human immune homeostasis1. However, the functional impact of IL2RA disease variants remains unclear because of the complex regulatory landscape at the IL2RA locus that is responsive to multiple signals. In resting conventional T cells, IL2RA is not only induced by antigen stimulation via the TCR, but is also potently regulated by a number of other signals. Regulators of IL2RA expression include the cytokine IL-2, which upregulates the receptor as part of a positive feedback loop11,12. IL2RA regulation is also dependent on cellular programming. FOXP3+ regulatory T cells (Treg cells), which are required to suppress auto-reactive T cells and prevent the development of multi-organ autoimmunity, constitutively express high levels of IL2RA and depend on it for survival13. We hypothesized that multiple extracellular and cell-type-specific signals are integrated to regulate gene expression through effects on distinct enhancer elements within the T cell super-enhancer at the IL2RA locus14,15. Whereas coding mutations in the gene affect all cell types that express IL-2Ra16, disease-associated non-coding variants could selectively affect IL2RA induction in conventional T cells in response to a specific signal, or impair constitutive expression in Treg cells. We sought to map functional IL2RA enhancer elements and determine how known disease risk variants affect enhancer function.
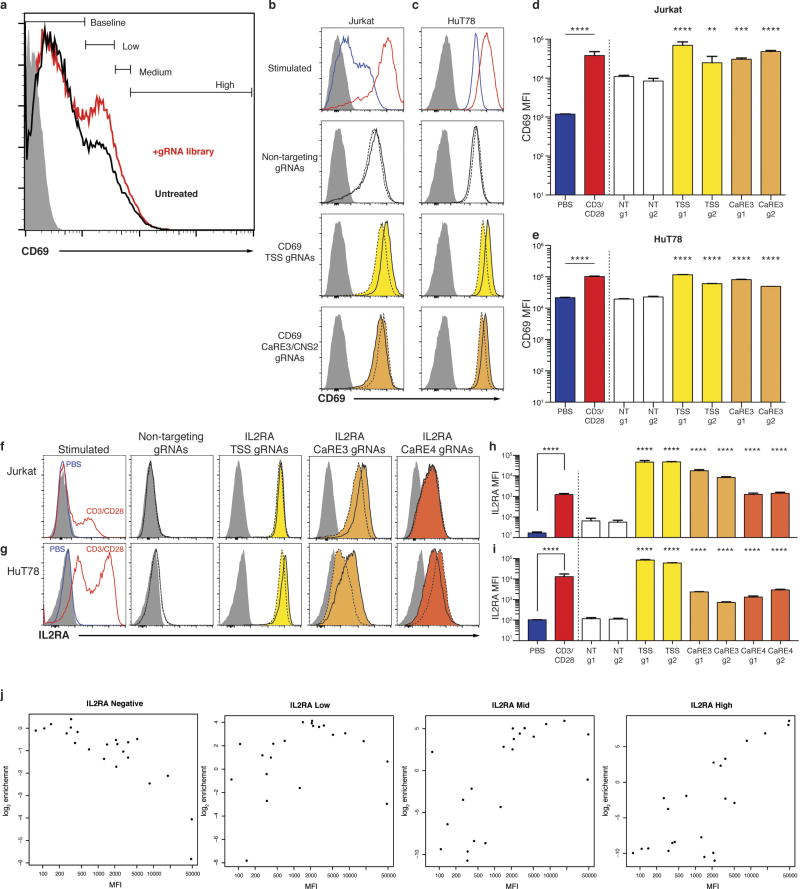
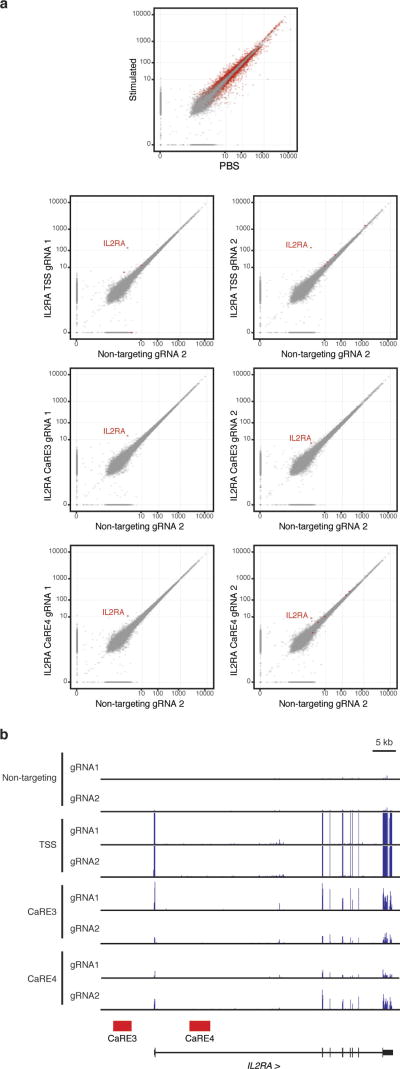
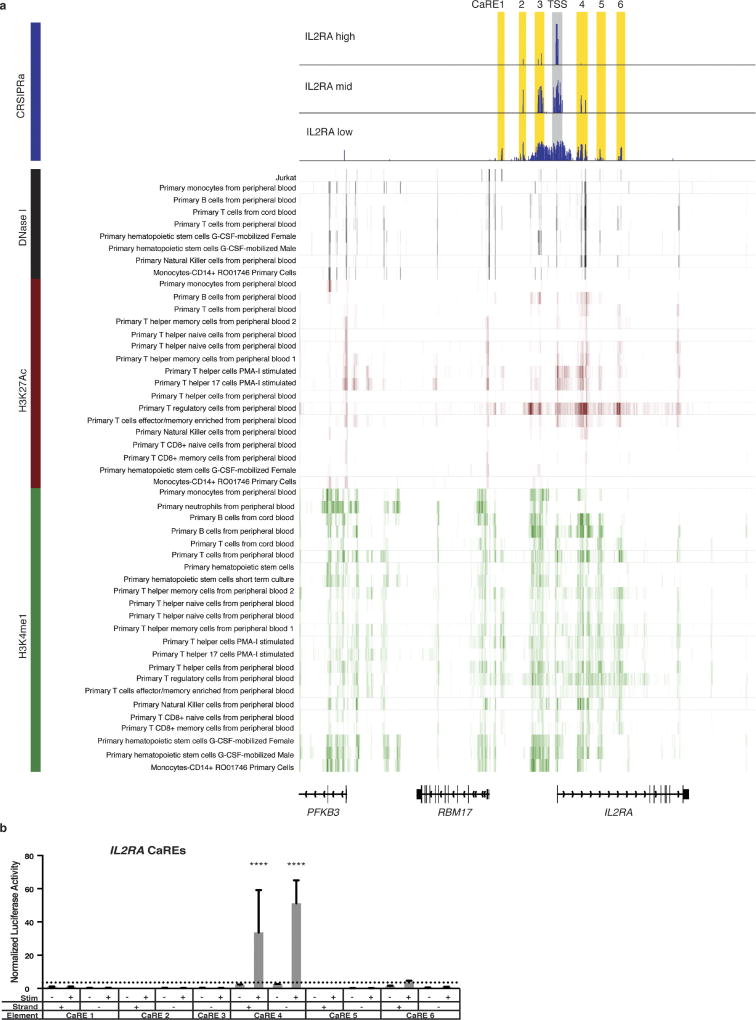
To discover IL2RA CaREs, we transduced Jurkat-dCas9-VP64 cells with a library of 20,412 gRNAs tiling 178 kb around the IL2RA locus (Fig. 1c). Transduced cells were sorted into four bins of expression (‘negative’, ‘high’, ‘mid’, and ‘low’). Analysis of gRNAs enriched in each bin revealed six CaREs leading to different levels of IL-2Ra expression: three in the first intron and three upstream of the promoter (Fig. 1d). Recruitment of VP64 by individual gRNAs to CaRE3 and CaRE4 trans-activated IL-2Ra to levels comparable to those resulting from T cell activation (Extended Data Fig. 1). In addition, RNA-sequencing (RNA-seq) of unstimulated HuT78 cells stably expressing dCas9-VP64 and gRNAs targeting the IL2RA TSS, CaRE3 or CaRE4 showed selective IL2RA induction, with transcripts originating at the TSS and no evidence of downstream intergenic or intronic transcripts originating at the gRNA target site (Extended Data Fig. 3). In sum, our unbiased transcriptional activation approach identified novel elements within the IL2RA super-enhancer where recruitment of a transcriptional activator is sufficient to induce IL-2Ra expression on resting cells.
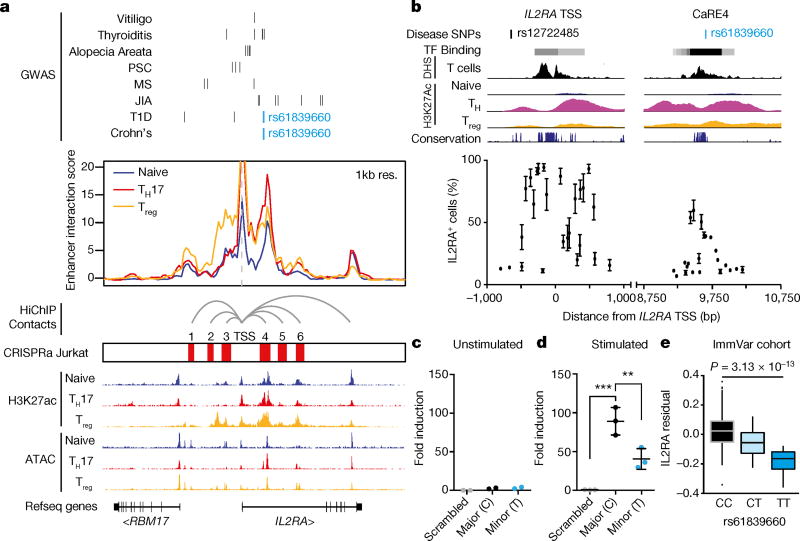
We next investigated the biological significance of the IL2RA CaREs. Enhancers are often marked by signature histone modifications, chromatin accessibility and looping to promoters. We initially focused on chromatin state in human T cells because IL2RA regulation has a role in T cells and because GWAS variants linked to autoimmunity reside within enhancers preferentially active in CD4+ T cells1. We analysed data generated with HiChIP, a recently developed method that maps active enhancers on the basis of H3K27 acetylation signature and simultaneously identifies long-range chromatin interactions17. All six IL2RA CaREs overlap with H3K27 acetylated elements that loop to the IL2RA TSS in primary human CD4+ T cell subsets, consistent with direct gene regulatory function (Fig. 2a).
Figure 2. Identification of a stimulation-dependent disease-associated IL2RA enhancer.
a, The IL2RA locus showing fine mapped autoimmunity SNPs (type 1 diabetes data from ref. 20, Crohn’s disease data from ref. 18, others from ref. 1) from genome wide association studies (GWAS), HiChIP enhancer interaction score with inferred IL2RA promoterenhancer loops and accessibility from primary human CD4+ T cells (naive, TH17 or Treg) and the overlap of these chromatin features with the IL-2Ra CaREs. b, Zoomed-in view of the IL-2Ra TSS and CaRE4 showing candidate autoimmunity SNPs in the region, DNase hypersensitivity and H3K27ac from primary human T cells (Epigenome Roadmap) and vertebrate conservation (PhastCons 46-way). Sequences within these regions were targeted in Jurkat-dCas9-VP64 cells by nucleofecting gRNA expression plasmids. IL2RA expression on nucleofected blue fluorescent protein (BFP)-positive cells was analysed 48 h after nucleofection. c, d, Jurkat cells were nucleofected with Luciferase reporter constructs containing a minimal promoter downstream of the CaRE4 reference sequence, a scrambled sequence or CaRE4 with rs61839660 (SNP). Luciferase activity was measured 1 day later (c) or after 20 h of anti-CD3/CD28 stimulation (d). All data are presented as mean ± s.d. and are representative of at least two independent experiments. **P ≤ 0.01, ***P ≤ 0.001 by one-way ANOVA with Holm–Sidak multiple comparisons test was used to compare scrambled and SNP enhancer sequences to reference sequence in the Luciferase assays. e, IL2RA QTL analysis on activated CD4+ T cells from 178 individuals in the ImmVar cohort reveals that the rs61839660 SNP is associated with reduced IL2RA expression. The effects after conditioning on rs2476491 are shown here.
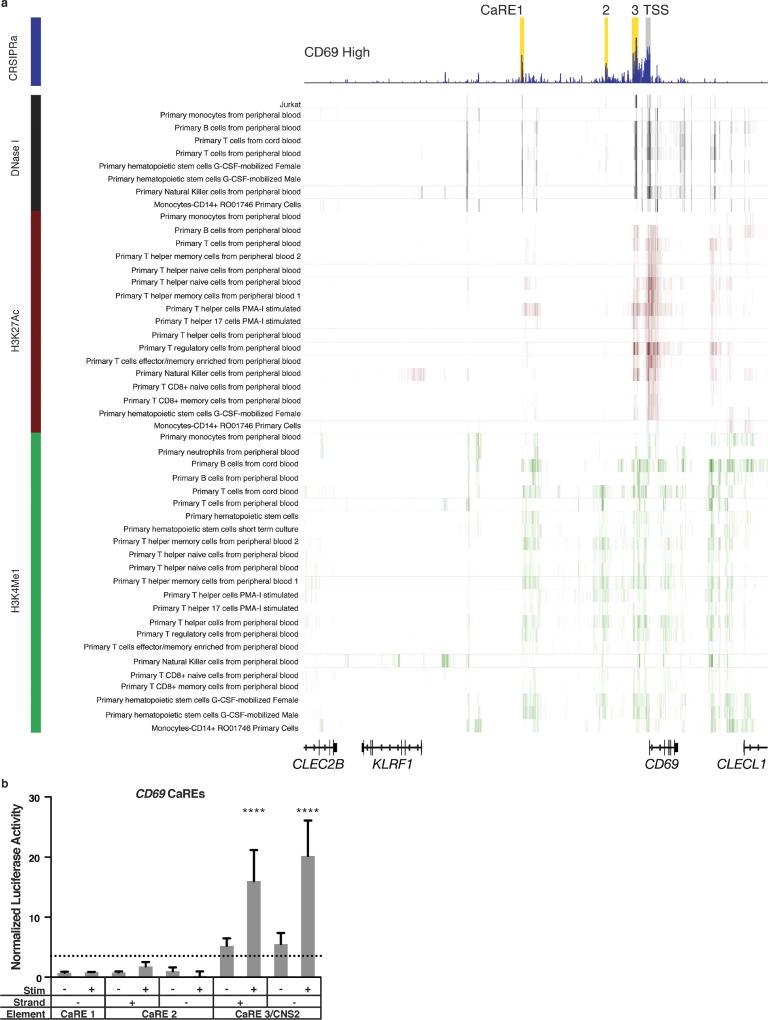
Whereas chromatin marks and three-dimensional configuration establish genomic features characteristically associated with potential enhancers, CRISPRa provides complementary functional data on the sufficiency of specific sites to serve as cis-regulatory elements for a target gene of interest. Although CaREs were mapped in a Jurkat T cell line, some corresponded with enhancer loops that are preferentially active in either Treg cells or pro-inflammatory TH17 cells. Additional chromatin accessibility and histone modification mapping in human immune cell subsets corroborates that CaREs overlap with putative endogenous regulatory elements (Fig. 2a and Extended Data Figs 4, 5). We identified CaREs on the basis of functional regulation of IL2RA, but chromatin conformation data suggests they also have the potential to regulate neighbouring genes (Extended Data Fig. 6). Enhancer function could only be validated for a subset of CaREs with a heterologous reporter assay in Jurkats, suggesting that others may only exert gene regulatory functions in restricted cellular contexts (Extended Data Figs 4, 5). Overall, we have shown that recruitment of VP64 identifies genetic elements with key, cell-type-specific chromatin features of physiologic enhancers.
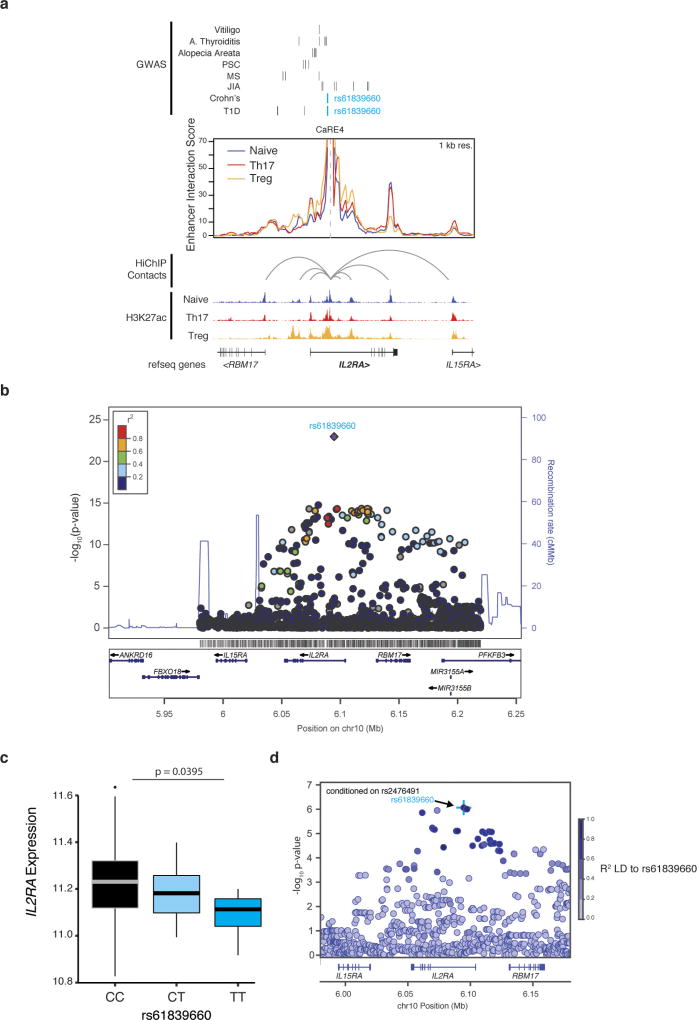
Sequence variation in CaRE4 has been implicated in risk of human autoimmunity (Fig. 2a, b). The single nucleotide polymorphism (SNP) rs61839660, which resides in this element, has been convincingly statistically resolved to a single non-coding variant. This individual SNP accounts for the risk of inflammatory bowel disease at the IL2RA locus18 (Extended Data Fig. 6). Consistent with a critical and complex function in immune regulation, this same SNP paradoxically also contributes to protection from type 1 diabetes19,20.
Fine-mapping of CRISPRa responsiveness confirmed a functional role for the cis-regulatory sequence at the site of the rs61839660 autoimmunity variant. We expressed individual gRNAs surrounding the TSS and within CaRE4 to test their effects on IL2RA transactivation. The strongest transactivation in this region of CaRE4 was observed at a highly conserved accessible region that harbours the autoimmunity SNP and is bound by multiple transcription factors between two peaks of H3K27ac in stimulated T cells that harbours the autoimmunity SNP (Fig. 2b). In an enhancer reporter assay, the conserved element within CaRE4 drove strong luciferase expression in Jurkat T cells, but only in response to stimulation (Fig. 2c, d). Introduction of rs61839660 diminished this stimulation-dependent enhancer function (Fig. 2c, d). These findings link the role of this disease variant to disruption of a stimulation-dependent IL2RA enhancer.
We next assessed if the rs61839660 SNP affects endogenous IL2RA gene regulation in primary human T cells. We analysed transcript data collected from anti-CD3/CD28-stimulated CD4+ T cells from 178 genotyped people21. These data confirm that rs61839660 is a response expression quantitative trait locus (reQTL), altering the transcriptional response to stimulation. Notably, the minor variant for rs61839660 is associated with reduced levels of IL2RA transcript in stimulated T cells (Fig. 2e and Extended Data Fig. 6), confirming the functional effect of sequence variation in CaRE4 on human T cell gene regulation.
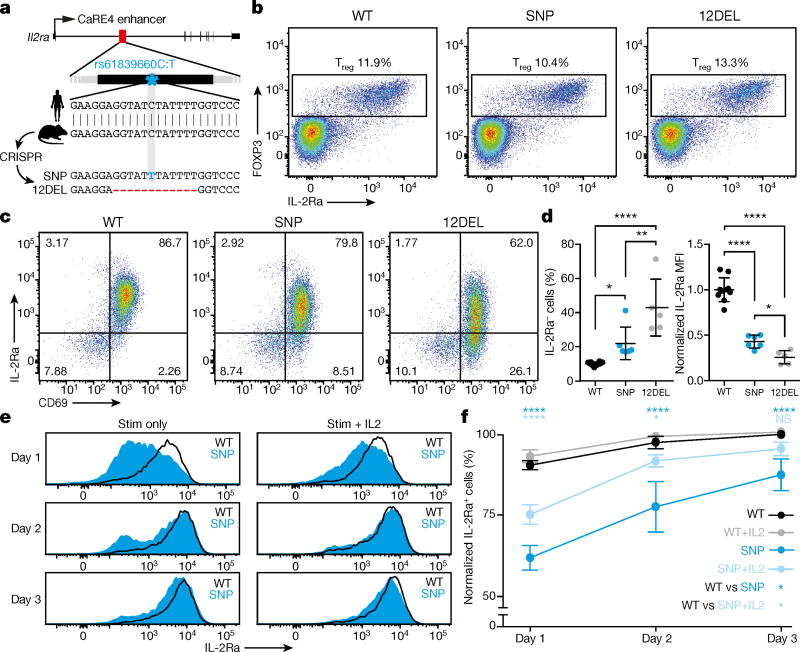
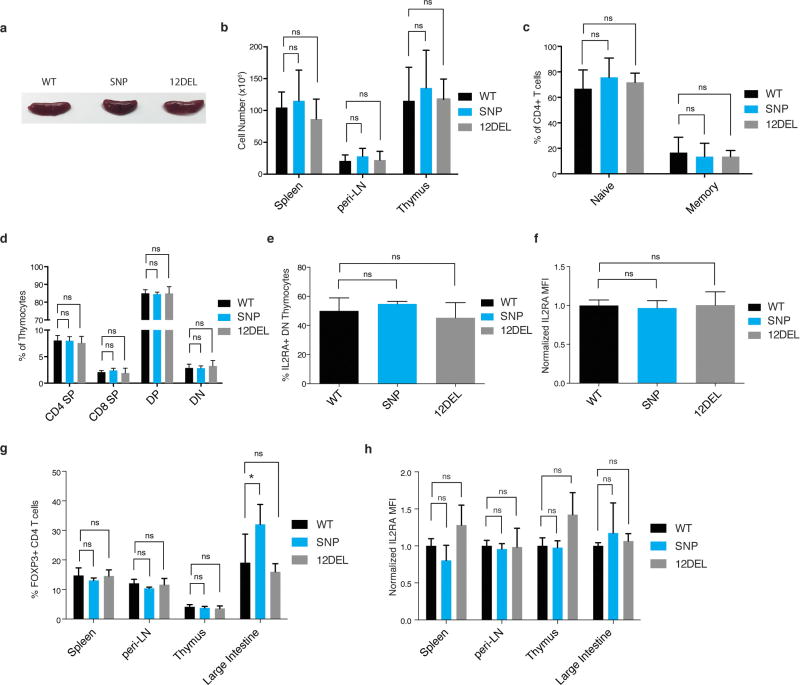
We then directly tested the in vivo effects of sequence variation in the enhancer in a mouse model. The IL2RA CaRE4 enhancer is highly conserved, which allowed us to use Cas9 genome editing to generate mice with the human autoimmune-associated SNP knocked in or with a 12 bp deletion at the site (12DEL) (Fig. 3a). Founders were backcrossed and bred to homozygosity. In vivo phenotyping of enhancer-edited mice revealed no evidence of overt immune dysregulation (Extended Data Fig. 7). T cell development was normal, with no differences in thymic cellularity or developmental stages (Extended Data Fig. 7). Furthermore, the enhancer does not appear to be required for IL-2Ra expression in Treg cells at steady state as SNP and 12DEL Treg cells had normal surface expression (Fig. 3b and Extended Data Fig. 7).
Figure 3. In vivo modelling of sequence variation in Il2ra enhancer.
a, Generation of rs61839660 knock-in (SNP) and 12 bp deletion (12DEL) B6 mice using CRISPR to edit the conserved IL2RA enhancer in zygotes. b, Normal Treg cell surface staining in peripheral lymph node (peri-LN) CD4+ T cells. c, Surface staining of IL-2Ra and CD69 on naive T cells stimulated with plate-bound anti-CD3/CD28 antibodies for 1 day. d, Quantification of percentage IL-2Ra− cells and IL-2Ra mean fluorescence intensity (MFI) as in c. Data in d derived from SNP (n = 6), 12DEL (n = 5) and wild-type littermate (n = 10) mice. e, Three-day time course of naive T cells isolated from spleen and peri-LN stimulated with plate-bound anti-CD3/CD28 antibodies alone (stim) or in combination with 50 U ml−1 IL-2 (stim + IL-2). f, Quantification of flow cytometry data as in e normalized against day 3 wild-type levels. Data in f derived from SNP (n = 3) and wild-type littermate (n = 3) mice. All data are presented as mean ± s.d. and are representative of at least two independent experiments. * P ≤ 0.05, ** P ≤ 0.01, **** P ≤ 0.0001 by two-way ANOVA followed by Fisher’s LSD test.
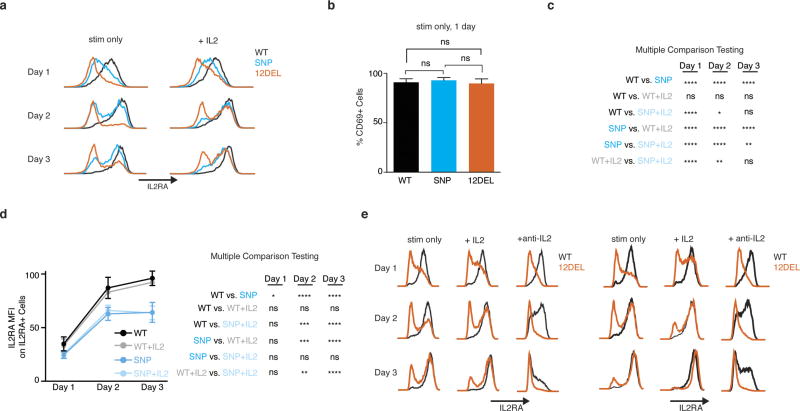
Given the stimulation-dependent enhancer activity in human cells in vitro, we reasoned that the CaRE4 enhancer might regulate IL2RA induction on naive CD4+ T cells following stimulation. We isolated naive T cells (CD4+CD62L+CD44−) from edited and wild-type mice and activated them in vitro with anti-CD3/CD28 antibodies. Remarkably, naive T cells from both SNP and 12DEL mice had significantly reduced IL-2Ra surface expression compared to wild-type mice 24 h after activation (Fig. 3c, d). The deficit was more pronounced in 12DEL cells, but the SNP alone resulted in significant reduction of IL-2Ra levels (approximately 50% of wild-type IL-2Ra, P ≤ 0.0001 by one-way ANOVA and Fisher’s least significant difference (LSD)) (Fig. 3d). Reduced IL-2Ra levels were not due to a general defect in response to stimulation, as CD69 expression was induced to levels comparable to wild-type cells 24 h after stimulation (Extended Data Fig. 8).
As disruption of CaRE4 did not ablate IL-2Ra expression, we asked whether mutant T cells were able to eventually recover IL-2Ra levels after stimulation. Indeed, three days after stimulation, the percentage of cells expressing IL-2Ra from SNP mice was much closer to that of wild-type cells than it had been at day one, although measurable defects in the percentage of cells expressing IL-2Ra and intensity of expression persisted (Fig. 3e, f and Extended Data Fig. 8). The disease-associated single nucleotide change within CaRE4 has subtle effects on final levels of IL-2Ra, but exerts a pronounced effect on the timing of induction.
Multiple extracellular signals can induce Il2ra. Having shown that the intronic enhancer alters response to T cell stimulation, we next tested if IL-2, another critical signal that regulates Il2ra, could compensate for the effect of the disease variant. IL-2 promoted induction of IL-2Ra on the surface of cells from the SNP mice (Fig. 3e, f). Blocking IL-2 in the culture using an anti-IL-2 antibody had the opposite effect and severely impaired IL-2Ra expression on enhancer-edited cells (Extended Data Fig. 8). Our results suggest that the human rs61839660 disease-associated variant impairs the function of an intronic enhancer that regulates IL-2Ra induction in response to anti-CD3/CD28 stimulation of conventional T cells. IL-2 signals partially compensate for mutations in the stimulus-responsive enhancer, suggesting that IL-2 response is mediated through additional cis-regulatory elements.
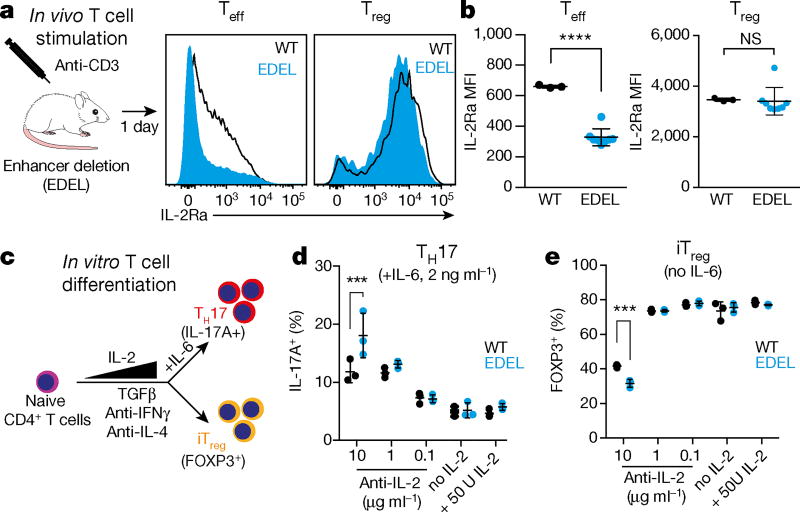
We sought to determine the in vivo response of enhancer mutant cells to acute stimulation. We deleted the entire Il2ra enhancer on the autoimmune-prone non-obese diabetic background to dissect subtle phenotypes that may be missed with the SNP and 12DEL mutations. This enhancer deletion (EDEL) strain also had no obvious T cell phenotypes at steady state (Extended Data Fig. 9). When EDEL mice were treated with anti-CD3 monoclonal antibody to stimulate T cells in vivo, we observed significant differences in IL-2Ra induction on conventional T cells (Fig. 4a, b and Extended Data Fig. 9). By contrast, Treg cells continued to express wild-type levels of IL-2Ra, although subtle changes in Treg contribution to the CD4+ population in the spleen were observed (Fig. 4a, b and Extended Data Fig. 9). These findings confirm in vivo that the intronic enhancer controls the acute induction of IL-2Ra in conventional T cells by the TCR pathway.
Figure 4. Il2ra enhancer controls IL-2Ra induction in response to TCR stimulation in vivo and skews T cell differentiation in vitro.
a, Wild-type and homozygous enhancer deletion (EDEL) non-obese diabetic mice were dosed with 50µg anti-CD3 antibody (clone 145-2C11). IL-2Ra surface expression was assessed on CD4+FOXP3− (Teff) and CD4+FOXP3+ (Treg) T cells from spleen 1 day after treatment. b, Quantification of IL-2Ra MFI on Teff and Treg cells from wild-type (n = 3) and EDEL (n = 8) littermate mice as in a. Data are representative of two independent experiments. c, Naive T cells from wild-type (n = 3) and EDEL (n = 3) mice were differentiated into TH17 and induced Treg cells (iTreg) under various cytokine conditions. The outcome of the differentiation was assessed by measuring the percentage of IL-17+ cells (d) and FOXP3+ cells (e). All data are presented as mean ± s.d. *** P ≤ 0.001, **** P ≤ 0.0001 by one-way ANOVA followed by Holm–Sidak multiple comparisons test.
We asked how impaired IL-2Ra induction could lead to cellular phenotypes associated with autoimmune disease. As naive CD4+ T cells polarize in response to stimulation, IL-2 provides a critical signal that restrains secretion of the pro-inflammatory IL-17 in TH17 cells and promotes induction of Treg cells22. We hypothesized that impaired IL2RA activation in the context of enhancer mutation could reduce IL-2 signals to skew cells towards IL-17 secretion and away from Treg induction. In TH17- and Treg-polarizing cytokine conditions, we assessed IL-17 secretion in cells treated with a range of IL-2 concentrations or antibodies to inhibit IL-2 signalling (Fig. 4c and Extended Data Fig. 10). Notably, only under conditions in which IL-2 signals were limited by antibody, we found that Il2ra enhancer deletion increased the percentage of IL-17-secreting cells, a hallmark of Crohn’s disease pathology23 (Fig. 4d and Extended Data Fig. 10). In the absence of IL-6, the enhancer deletion caused reduced induced Treg cells to form only when IL-2 concentrations were limited by antibody (Fig. 4e and Extended Data Fig. 10).
Treg cells are highly dependent on IL-2 signalling for survival13,24. In Treg-polarizing conditions in which IL-2 was limited, we found evidence of decreased cell viability, which was exacerbated by the enhancer mutation (Extended Data Fig. 10). Viability differences were not observed in other conditions tested, consistent with a selective effect on differentiating induced Treg cells (Extended Data Fig. 10). Taken together, enhancer mutations that impair induction of the high affinity IL-2Ra receptor can disrupt critical IL-2 signals and shift CD4+ T cell polarization towards a pro-inflammatory state.
Here we show that CRISPRa is a powerful approach for unbiased enhancer discovery at a target locus that can rapidly map functional enhancers without prior knowledge of their exact biological contexts. Although we focused on immune-related genes, we anticipate this approach will have general utility as an enhancer discovery platform and can be used for functional annotation of the vast non-coding genomic space. Our functional enhancer mapping approach complements publicly available chromatin maps and enabled us to discover a disease-associated enhancer that controls the timing of gene expression. Some enhancers may be missed with CRISPRa, perhaps especially very distal regulatory elements, and further investigation will be required to determine the limits of the method. Candidate regulatory regions identified by CRISPRa should be validated with genome editing in addition to chromatin data.
Our findings reveal that human non-coding disease variants can shape the kinetics of genetically encoded responses. Immune homeostasis depends not only on the level of IL-2Ra expression in Treg cells, but also on proper dynamics of IL-2Ra induction in conventional T cells. Further study is needed to determine the full set of cell types and responses that are altered by the rs61839660 SNP. Ongoing clinical trials are testing the use of anti-CD3 antibodies and IL-2 to treat various autoimmune and inflammatory conditions25–27. Understanding how genetic variation interacts with exogenous signals to regulate IL-2Ra induction may provide mechanistic insights relevant to such therapies and inform patient stratification decisions. The data presented here critically identifies a functional context for a genetic autoimmunity risk factor, and suggests a new model of how common non-coding genetic variants control stimulation-responsive temporal gene regulation in health and disease.
Methods
Data reporting
No statistical methods were used to predetermine sample size. The experiments were not randomized and the investigators were not blinded to allocation during experiments and outcome assessment.
Cell culture
Cell culture was performed at 37°C in a humidified atmosphere containing 5% CO2. Jurkat cells (Clone E6-1) were obtained from the Berkeley Cell Culture Facility for CRISPRa experiments. HuT78 cells were a gift from Art Weiss (UCSF, San Francisco, CA). Cell line identify for CRISPRa screen and arrayed VP64 experiments was authenticated by short tandem repeat (STR) analysis and verified mycoplasma free using the MycoAlert Mycoplasma Detection Kit (Lonza). Jurkat and HuT78 cells were cultured is RPMI-1640 medium (Gibco) supplemented with 10% fetal bovine serum (FBS), 100 U ml−1 penicillin (Gibco), 100µg ml−1 streptomycin (Gibco), and 1 mM sodium pyruvate (Gibco).
Generation of dCas9-VP64 cells
Jurkat and HuT78 cells were transduced with a lentiviral dCas9-VP64-2A–GFP expression vector (Addgene 61422). Single GFP+ cells were sorted by FACS into the wells of a 96-well plate, and clones with bright uniform GFP expression were selected for use in future experiments.
Antibodies
All antibodies used for staining or cell stimulation are listed in Supplementary Table 4.
Primers
All primers used in this study are listed in Supplementary Table 5
Guide RNAs
All gRNAs used here are listed in Supplementary Table 6.
Tiling gRNA library generation
For each gene of interest, the window of tiling gRNA libraries extended from 100 kb upstream of the transcription start site through 25 kb downstream of the end of the gene. The hg19 coordinates of the CD69 library window were chromosome 12: 9,880,082–10,013,497. The hg19 coordinates of the IL2RA library window were chromosome 10: 6,027,657–6,204,333.
gRNAs were designed against all NGG protospacer adjacent motifs in the window, excluding sequences containing BstXI or BlpI/Bpu1102l cut sites. Each library contained 2,244 negative control gRNAs taken from the genome-scale CRISPRi/a libraries described in Gilbert et al.10. Protospacer sequences flanked by restriction enzyme sites and PCR adaptors were synthesized by as pooled oligonucleotides by Agilent Technologies. Pooled gRNA libraries were then cloned into the lentiviral expression vector ‘pCRISPRia-v2’ (Addgene 84832) as described in Horlbeck et al.28.
Tiling transcriptional activation screen
Protocols for the pooled lentiviral CRISPRa screens were adapted from Gilbert et al.10. Lentivirus was produced by transfecting HEK293T with standard packaging vectors using TransIT-LTI Transfection Reagent (Mirus, MIR 2306). Viral supernatant was collected 48–72 h following transfection, filtered through a 0.45µm PES syringe filter, snap-frozen, and stored at −80°C for future use.
Jurkat-dCas9-VP64 cells were infected with lentiviral gRNA libraries by resuspending cells at 2 × 10⁶ cells per ml in fresh media containing titered lentivirus and 4µg ml−1 polybrene. Cells were spin-infected for 2 h at 1,000g, 33°C, followed by resuspension in fresh media at 0.25–0.5 × 10⁶ cells per ml. To limit the number of cells expressing multiple gRNAs, lentivirus was titered to infect only 10–20% of cells. Cells were cultured in media containing 0.75 or 1.5µg ml−1 puromycin for days 2–5 after infection to remove uninfected cells. The number of initially infected cells was at least 500× the number of gRNAs in the library, and at least this many cells were maintained throughout the course of the experiment.
7–10 days after infection cells were sorted on the basis of IL-2Ra or CD69 expression. Briefly, cells were resuspended in sterile sort buffer (PBS + 2% FBS) containing either IL-2Ra–PE or CD69–PE antibody at a 1:25 dilution. Cells were stained for 30 min on ice, washed twice with sort buffer, and passed through a 70-µm mesh. Cells were sorted into four bins on the basis of IL-2Ra or CD69 expression using a BD Influx cell sorter. The total number of cells collected was at least 500× the number of gRNAs in the library. Additional unsorted cells totalling 500× the number of gRNAs in the library were collected at this time. Duplicate infections and sorts were performed for each library. Collected cells were centrifuged at 500g for 5 min, and cell pellets were stored at − 80°C until genomic DNA was isolated.
Genomic DNA was isolated from sorted cells using NucleoSpin Blood kits (Macherey-Nagel), or by Proteinase K digestion and isopropanol precipitation for samples with fewer than 106 cells. PCR was used to amplify gRNA cassettes with Illumina sequencing adapters and indexes as described in Kampmann et al.29. Genomic DNA samples containing less than 10µg of gDNA were loaded directly into PCR. For genomic DNA samples containing more than 10µg of DNA, samples were first digested for 18 h with SbfI-HF (NEB) to liberate a ~500 bp fragment containing the gRNA cassette. The gRNA cassette was isolated by gel electrophoresis as described in Kampmann et al.29, and the DNA was then used for PCR. Custom PCR primers are listed in Supplementary Table 5. Indexed samples were pooled and sequenced on an Illumina HiSeq-2500 with the custom sequencing primer 5′-GTGTGTTTTGAGACTATAAGTATCCCTTGGAGAACCACCTTGTTG-3′. Sequencing libraries were pooled proportional to the number of sorted cells in each sample. The target sequencing depth was 2,000 reads per gRNA in the library for unsorted ‘background’ samples, and 10 reads per cell in sorted samples.
Screen data analysis
Sequence files were processed to remove low quality reads and reads lacking the gRNA constant region. Reads were then trimmed for the common sequence using the cutadapt script and the command ‘cutadapt -a GTTTAAGAGCTAAGCTG’30. Trimmed reads were then aligned against a database of the guide sequences using bowild-typeie2 with option ‘–norc’31. gRNAs with fewer than 50 reads in either of the background samples were excluded from all downstream processing and data analysis. Read counts for each sample were then normalized to the total number of gRNA read counts in that sample. A pseudo- count of 1 was added to all normalized guide counts. gRNA enrichment was calculated as follows:
mean(log2(IL2RA_gate_rep1/IL2RA_background_rep1), log2(IL2RA_gate_rep2/IL2RA_background_rep2))
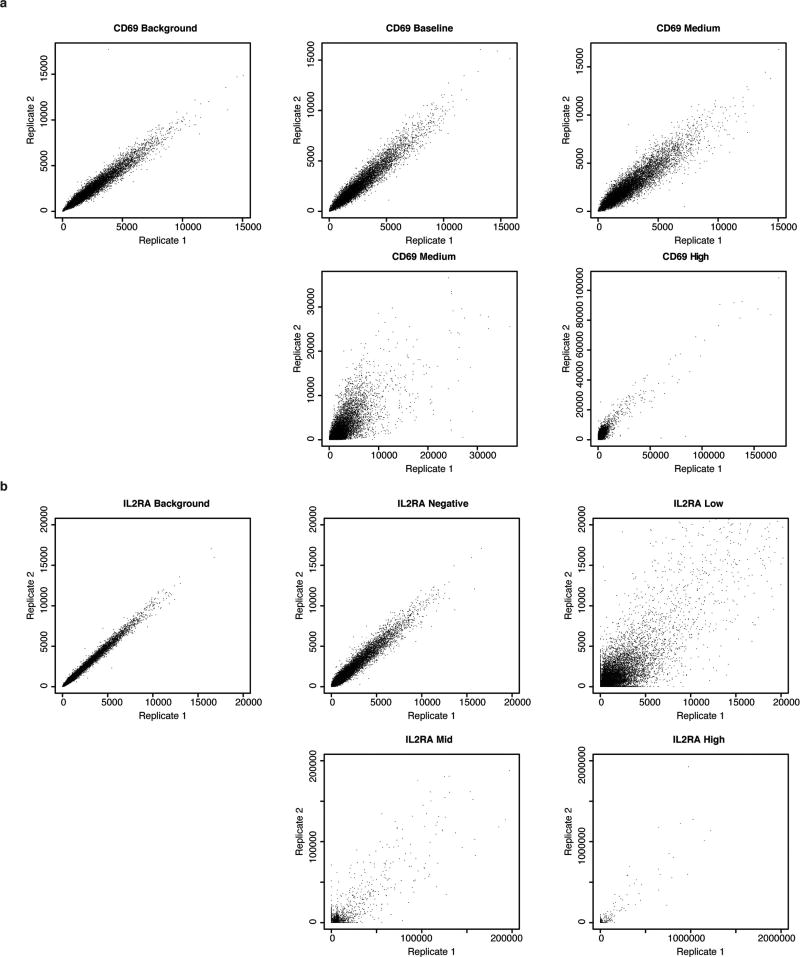
The mean gRNA enrichment score was then calculated using a 5-gRNA sliding window and visualized with the Integrative Genomics Viewer (Broad Institute). Non-targeting control gRNAs and gRNAs that map perfectly to multiple sequences within the gRNA library window were excluded from visualization. Raw and processed data for CRISPRa screen are included in Supplementary Table 1. For each sorted cell population, normalized read counts for a given gRNA were well correlated between the two replicates of the screen (Extended Data Fig. 2).
Screen validation
For screen validation using individual gRNAs, gRNAs were cloned into the same expression plasmid used for the gRNA library. Lentivirus was produced as described above and used to infect Jurkat and HuT78 cells expressing dCas9-VP64. Expression of IL-2Ra and CD69 on infected cells was analysed by flow cytometry. A complete list of gRNAs used in CRISPRa follow-up experiments is provided in Supplementary Table 6.
Transient gRNA expression
For the transient gRNA expression experiment shown in Fig. 2b, gRNAs were cloned into the same expression plasmid used for the gRNA library. 2 × 10⁵ Jurkat-dCas9-VP64 cells were nucleofected with 1µg of sgRNA plasmid with a 4-D Nucleofector (Lonza) using 20µl of Nucleofector Buffer SE and nucleofection program CL-120. IL-2Ra expression on nucleofected cells was analysed by flow cytometry 48 h after nucleofection.
Human subjects
This study was approved by the Stanford University Administrative Panels on Human Subjects in Medical Research, and written informed consent was obtained from all participants.
Primary T cell isolation
Normal donor human peripheral blood cells were obtained fresh from AllCells. CD4+ T cells were enriched from peripheral blood using the RosetteSep Human CD4+ T Cell Enrichment Cocktail (StemCell Technology). For CD4+ T helper cell subtypes, naive T cells were sorted as CD4+IL-2Ra−CD45RA+, TH17 cells were sorted as CD4+IL-2Ra−CD45RA−CCR6+CXCR5−, and Treg cells were sorted as CD4+IL-2Ra+CD127lo. For HiChIP experiments, 500,000–1,000,000 cells were sorted into RPMI + 10% FCS. For ATAC-seq experiments, 55,000 cells were sorted into RPMI + 10% FCS. Post-sort purities of > 95% were confirmed by flow cytometry for each sample.
HiChIP protocol
The HiChIP protocol was performed as previously described17 with the following modifications. For approximately 500,000–1,000,000 cells per T cell subtype per replicate, we performed two minutes of sonication, no Protein A bead preclearing, used 4µg of H3K27ac antibody (Abcam ab4729), and captured the chromatin-antibody complex with 34 ul of Protein A beads (Thermo Fisher). Qubit quantification post ChIP ranged from 5 to 25 ng depending on the cell type and amount of starting material. The amount of Tn5 used and PCR cycles performed were on the basis of the post-ChIP Qubit amounts, as previously described17. HiChIP samples were size selected by PAGE purification (300–700 bp) for effective paired-end tag mapping, and therefore were removed of all primer contamination which would contribute to recently reported ‘index switching’ on the Illumina HiSeq 4000 sequencer32.
HiChIP data processing and virtual 4C visualization
HiChIP paired-end reads were aligned to the hg19 genome using the HiC-Pro pipeline33. Default settings were used to remove duplicates, assign reads to MboI restriction fragments, filter for valid interactions, and generate binned interaction matrices. Virtual 4C (v4C) profiles were generated from 1 kilobase resolution HiChIP interaction matrices by filtering the matrix for all bin-pairs in which one bin matched a single anchor bin of interest. Depth-normalization was achieved by scaling counts by the total number of filtered reads in each experiment. WashU Epigenome Browser sessions contained publically available H3K27ac ChIP-seq and ChromHMM data from the Roadmap Epigenome Project34. Browser shots from WashU track sessions were then included in v4C representations. HiChIP contacts are represented as inferred loops that have been manually drawn to aid in visualization of the data (Fig. 2a and Extended Data Fig. 6). HiChIP data for the IL2RA promoter and IL2RA CaREs are provided in Supplementary Table 7.
ATAC-seq
Cells were isolated and subjected to ATAC-seq as previously described16. Briefly, 55,000 cells were pelleted, resuspended in 50µl lysis buffer (10 mM Tris-HCl, pH 7.4, 3 mM MgCl2, 10 mM NaCl, 0.1% NP-40 (Igepal CA-630)), and immediately centrifuged at 500g for 10 min at 4°C. The nuclei pellets were resuspended in 50µl transposition buffer (25µl 2× TD buffer, 22.5µl dH20, 2.5µl Illumina Tn5 transposase), and incubated at 37°C for 30 min. Transposed DNA was purified with MinElute PCR Purification Kit (Qiagen), and eluted in 10µl EB buffer.
Luciferase assays
CaRE sequences were synthesized as gBlock Gene Fragments (IDT) or PCR amplified from Jurkat cell genomic DNA, then cloned into the Firefly Luciferase (Fluc) reporter vector pGL4.23 (Promega), upstream of a generic minimal promoter. The details of each construct are listed in Supplementary Table 8. All plasmids have been deposited with Addgene (Addgene IDs 91835-91852).
For the experiments shown in Fig. 2, each FLuc construct (700 ng) was electroporated with a Renilla luciferase plasmid (pGL4.74, 70 ng) into 5 × 10⁵ Jurkat cells using the 4-D Nucleofector, 20µl Nucleofection Buffer SE and Nucleofection Program CL-120. Cells were rested overnight and then activated using plate bound anti-CD3 (clone UCHT1, 10µg ml−1, TONBO Biosciences) and anti-CD28 (clone CD28.2, 10µg ml−1, TONBO Biosciences) antibodies for 22 h. Luciferase expression was assessed using the Dual-Glo Luciferase Assay (Promega) on a 96 well plate luminometer. FLuc activity was normalized to Renilla activity and is reported as fold induction over empty pGL4.23 vector.
Experiments shown in Extended Data Figs 4 and 5 were performed similarly, with the following modificatons. Equimolar amounts of each FLuc construct (~600 ng per sample) were electroporated with a Renilla luciferase plasmid (pGL4.74, 150 ng) into 5 × 10⁵ Jurkat cells using the 4-D Nucleofector with 96-well shuttle, 20µl Nucleofection Buffer SE and nucleofection program CL-120. Cells were rested for 18 h. Cells were then split between an antibody coated stimulation plate (as above) and a PBS control plate. Luciferase expression was assessed using the Dual-Glo Luciferase Assay (Promega) on a 96-well plate luminometer after 24 h of stimulation. FLuc activity was then normalized to Renilla luciferase activity for each well.
RNA-seq
HuT78 cells expressing dCas9-VP64 and individual gRNAs were grown in normal media. HuT78 cells expressing dCas9-VP64 but no gRNA were stimulated with plate-bound anti-CD3 and anti-CD28 or PBS control plates for 48 h. Conditions for coating tissue culture plates with antibody were identical to those used for the luciferase reporter experiments shown in Extended Data Figs 4 and 5. Cells were collected and total RNA was isolated from samples using the RNeasy Mini Kit (QIAGEN, cat. 74104) according to the manufacturer’s instructions with the following options: cells were pelleted and re-suspended in RLT buffer with β-mercaptoethanol and homogenized using QIAshredder (QIAGEN, cat. 79654). On-column DNase digestion was performed with the RNase-Free DNase Set (QIAGEN, cat. 79254). RNA samples were analysed with a NanoDrop spectrophotometer and all samples had a 260/280 and 260/230 ratio of 1.80 or higher. RNA integrity was measured with the AATI Fragment Analyzer (Advanced Analytical Technologies), and all samples had an RNA Quality score (RQN) of 10.0. RNA concentration was measured using the Qubit RNA BR Assay (ThermoFisher Scientific, cat. Q10210). RNA-seq libraries from biological duplicate samples were prepared using the TruSeq RNA Library Preparation Kit v2, Set A (Illumina, cat. RS-122-2001) and Set B (cat. RS-122-2002), following the Illumina TruSeq sample Preparation v2 Guide: Low Sample (LS) Protocol. The samples were pooled and sequenced with the Illumina HiSeq4000.
RNA-seq sequencing data was analysed using kallisto35 with reference to version 80 of the Ensembl annotation of the human genome, and taking 30 bootstrap samples to estimate inferential variance of the abundance estimates. The resulting abundance estimate data was then analysed with sleuth36 using a model with covariates indicating presence or absence of stimulation, each targeting guide, and a generic ‘any guide’ covariate to capture the non-specific effects of lentiviral transduction and gRNA expression (Supplementary Table 9). Gene-level abundance estimates were computed by summing transcripts per million estimates for transcripts for each gene. Wald tests were then performed at a gene level for each covariate with hits being called at a false-discovery rate of 10%. Data from these experiments are included in Supplementary Tables 2 and 3.
To test stringently for expression from cryptic promoters induced by the CRISPRa treatment, reads in each sequencing sample were aligned to a repeat-masked version of the IL2RA region using HISAT237. The resulting alignments were then tested with bedtools38 for overlap with 1 kb regions centred around the IL2RA CaRE3 and CaRE4 guides, but no such reads were detected in any of CaRE-targeting samples.
We are aware of the recently reported ‘index switching’ on the Illumina HiSeq 4000 sequencer and analysis of the non-targeted condition showed low to no IL2RA expression suggesting that this was not a problem32.
ChIP-seq and DNase-seq data
ChIP-seq and DNase-seq data were obtained from the Roadmap Epigenomics Project and ENCODE. Details of the samples plotted are in Supplementary Table 10.
Generation of CRISPR mouse models
12DEL mouse
12DEL mice were generated by the UCSF Mouse Genetic core by microinjection of Cas9 ribonucleoprotein (PNA Bio) into C57BL/6 zygotes. Briefly, Cas9 (50 ngµl−1), mIL-2Ra-CaRE4 gRNA-1 (25 ngµl−1), and ssDNA HDR template (50 ngµl−1) were mixed in injection buffer (10 mM Tris, 0.1 mM EDTA) and incubated on ice for 10 min, as per the manufacturer’s instructions. The mixture was microinjected into the cytoplasm of C57BL/6 single-cell zygotes isolated from super-ovulated females. We did not observe knock-in of the SNP in the progeny, but one founder carried a 12 bp deletion in the Il2ra intronic enhancer. The 12DEL mouse line was established by backcrossing this founder for at least one generation before breeding to homozygosity. gRNA and HDR template sequences are listed in Supplementary Table 5.
SNP mouse
SNP knock-in mice were generated by the Jackson Laboratory (Bar Harbour, ME, USA) by microinjection of gRNA and Cas9 mRNA. Briefly, Cas9 mRNA (100 ngµl−1), mIL-2Ra-CaRE4 gRNA-1 (50 ngµl−1), and ssDNA HDR template (100 ngµl−1) were mixed and injected into C57BL/6 zygotes. Three founders with the knock-in SNP were identified by PCR amplicon sequencing and confirmed by sequencing of TOPO-cloned PCR products. The SNP mouse lines were established by backcrossing founders for at least one generation before breeding to homozygosity. gRNA and HDR template sequences were identical to those used to generate the 12DEL mouse line and are listed in Supplementary Table 5.
EDEL mouse
Enhancer deletion mice were generated by the Jackson Laboratory (Bar Harbour, ME, USA) by microinjection of gRNA and Cas9 mRNA. Briefly, Cas9 mRNA (100 ngµl−1), mIL-2Ra-CaRE4 gRNAs 2–5 (50 ngµl−1) were mixed and injected into NOD/ShiLtJ zygotes. Three founders with the enhancer deletion were identified by PCR amplicon size and confirmed by sequencing of TOPO-cloned PCR products. Immunophenotyping showed consistent phenotypes across three founders (not shown). Data shown is from one founder. The EDEL mouse lines were established by backcrossing founders for at least one generation before breeding to homozygosity. gRNAs are listed in Supplementary Table 5.
Mouse genotyping
All founders were initially genotyped by Sanger sequencing genomic DNA from proteinase K digested tail tissue. PCR amplification of the CaRE4 enhancer was carried out using HotStart Taq (Bioline USA Inc.) and primers (mIL-2Ra-CaRE4-F, mIL-2Ra-CaRE4-R) that span the edited site. PCR amplicons were then sequenced with the mIL-2Ra-CaRE4-F primer.
Mouse experiments
All mice were maintained in the UCSF specific-pathogen-free animal facility in accordance with guidelines established by the Institutional Animal Care and Use Committee and Laboratory Animal Resource Center. Experiments were done with animals aged between 2 to 4 months, unless otherwise noted. Wild-type littermate mice were used as controls for all experiments.
Cell preparation
Briefly, spleen, peripheral lymph nodes (peri-LNs), thymus and large intestine was collected from each mouse. Spleen, peri-LNs, and thymus were dissociated in 1× PBS with 2% FBS and 1 mM EDTA. The mixture was then passed through a 70-µm filter. ACK lysis was used to deplete red blood cells from splenocytes.
Lamina propria lymphocytes were isolated from the large using the lamina propria dissociation kit (Miltenyi Biotec, cat. 130-097-410) and a gentleMACS dissociator (Miltenyi Biotec).
Staining
All antibody stains were performed at a 1:100 dilution in 30µl of 1× PBS. To pellet the cells, centrifugation was performed at 400g for 5 min. For immunophenotyping, 2,000, 000 cells were stained per tissue sample. Cells were first stained with a viability dye at a 1:1,000 dilution in 1× PBS for 20 min at 4°C, then washed with EasySep Buffer (1× PBS, 2% FBS, 1 mM EDTA). Cells were then resuspended in the appropriate surface staining antibody cocktail and incubated for 30 min at 4°C, then washed with 1× PBS. Cells were then fixed, permeabilized, and stained for transcription factors using the FOXP3 staining kit (eBioscience, cat. 00-5523-00) according to the manufacturer’s instructions. Antibody staining panels are listed in Supplementary Table 4.
IL-2Ra induction in anti-CD3/anti-CD28-stimulated naive T cell
Naive T cells were isolated from spleen and lymph nodes with CD4+ negative selection (StemCell Technologies) followed by fluorescence activated cell sorting for CD4+IL-2Ra−CD44−CD62L+ cells. 80,000 to 100,000 cells we activated per well of a 96-well plate coated with 2µg ml−1 anti-CD3 and anti-CD28. For some conditions 10µg ml−1 anti-IL-2 blocking antibody or 50 U ml−1 IL-2 was added. Cell analysis by flow cytometry was performed every day for 3 days.
In vivo T cell stimulation with anti-mouse CD3
NOD EDEL (n = 8) and wild-type littermate controls (n = 3) between 3–4 months of age were used for these experiments. All mice were checked for diabetes and were found to be normoglycemic. Animals were anaesthetized with isofluorane. 50µg anti-CD3 was injected retro-orbitally in 100µl volume. Mice were killed 24 h later for isolation of spleen, peripheral lymph nodes, mesenteric lymph nodes and large intestine. Large intestine was processed using a lamina dissociation kit described above. Cells were stained with antibodies for flow cytometry (Supplementary Table 4).
Mouse T cell differentiation
Naive CD4+ T cells were isolated from spleen and lymph nodes of NOD EDEL mice and wild-type littermate controls with a CD4+ negative selection kit (StemCell Technologies, cat. 19752) followed by fluorescence- activated cell sorting of CD4+IL-2Ra−CD44−CD62L+ cells. Wild-type (n = 3) and EDEL (n = 3) were matched by age and sex. All mice were normoglycemic. Naive CD4+ T cells were activated in 96-well plates coated with anti-CD3 (1µg ml−1) and anti-CD28 (0.5µg ml−1) monoclonal antibodies at 37°C for ~72 h at an initial density of 0.75 × 10⁶ cells per well and then were allowed to rest for 48–72 h in medium. For T-helper-polarizing conditions, 0 ng ml−1 (Treg), 2 ng ml−1 (TH17 low) or 20 ng ml−1 (TH17 high) recombinant mouse IL-6 (PeproTech), 5 ng ml−1 recombinant human TGF-β (PeproTech), 10µg ml−1 anti-IL-4 (11B11; BioXCell), and 10µg ml−1 anti-IFN-γ (XMG1.2; BioXCell) were added to the culture throughout the 5 days. IL-2 concentration was additionally titrated across all polarizing conditions: 10µg ml−1, 1µg ml−1, 0.1µg ml−1 anti-IL-2 (S4B6; eBioscience) or 20 ng ml−1 recombinant IL-2 (National Cancer Institute). All cultures used DMEM high glucose media supplemented with 10% FCS, pyruvate, nonessential amino acids, MEM vitamins, l-arginine, l-asparagine, l-glutamine, folic acid, β-mercaptoethanol, penicillin and streptomycin. After 5 days, cells were stimulated for 4 h with a cocktail of PMA and ionomycin, in the presence of brefeldin A. Cells were then stained for CD4, IL-2Ra, IL-17A, RORγt and FOXP3 (Supplementary Table 4).
Analysis of gene regulatory effects of naturally occurring rs61839660 variant in human T cells
Nanostring expression data from the ImmVar cohort was reanalysed and normalized as previously described21. The data was residualized against biological covariates and the first 6 principal components. As the SNP is found in appreciable frequencies only in individuals of European American background, only Caucasian samples (n = 178) were analysed. Linear regression was applied to the data using a modified ‘scikit-learn f_regression’ function. The data was residualized against the primary associated SNP and second round of regression was performed in the same manner. The FDR was calculated using R ‘qvalue’ package. Visualization was performed with matplotlib, seaborn, and ggplot2 packages. Figure 2e shows the SNP effects conditioned on rs2476491. The effects without conditioning are shown in Extended Data Fig. 6c.
Data availability
Data from the CRISPRa screen (accession number: GSE98178; Fig. 1) and RNA-sequencing (accession number: GSE98178; Extended Data Fig. 3) are available at NCBI GEO. HiChIP interaction matrices for the IL2RA promoter and IL2RA CaREs (Fig. 2a, Extended Data Fig. 6a) are available in Supplementary Table 7. Bedgraph files for ATAC-seq in Fig. 2a are available as Source Data.
Extended Data
Extended Data Figure 1. Upregulation of target gene expression on gRNA-expressing cells.
a, Distribution of CD69 expression on Jurkat-dCas9-VP64 cells transduced with the CD69 tiling gRNA library. b, c, Representative flow cytometry plots of CD69 expression on Jurkat (b) or HuT78 cells (c) transduced with dCas9-VP64 and individual gRNAs. For each target region or control, solid black lines represent gRNA 1 and dashed black lines represent gRNA 2. Shaded grey histograms represent isotype control staining. Cells stimulated for 48 h with plate-bound anti-CD3/CD28 antibodies are shown for comparison. d, e, Isotype-subtracted geometric MFI of data in b and c. f, g, Representative flow cytometry plots of IL-2Ra expression on Jurkat (f) and HuT78 cells (g) as in d. h, i, Isotype-subtracted geometric MFI of data in f and g. Statistical tests were performed on log-transformed MFI values. PBS and anti-CD3/CD28-treated samples were compared using an unpaired two-tailed Student’s t-test. TSS and CaRE gRNA samples were compared to each non-targeting (NT) gRNA sample using one-way ANOVA followed by Sidak’s multiple comparisons test. Data are presented as mean ± s.d., n = 3 biological replicates. Data in b–i are representative of at least 2 independent experiments. ** P ≤ 0.01, *** P ≤ 0.001, **** P ≤ 0.0001. j, Jurkat dCas9-VP64 cells were transduced with individual gRNAs from the IL-2Ra library, and surface IL-2Ra expression was measured by flow cytometry. The isotype-subtracted geometric MFI of the transduced cells is plotted against gRNA enrichment in the indicated bin in the IL-2Ra screen.
Extended Data Figure 2. Correlation of results across CRISPRa screen replicates.
a, b, Normalized read counts for gRNAs in the indicated cell populations are compared between biological replicates of the CD69 screen (a) and IL-2Ra screen (b).
Extended Data Figure 3. Activation of CaREs by CRISPRa specifically upregulates IL2RA.
a, Transcriptome comparison of HuT78 cells expressing dCas9-VP64 transduced with individual gRNAs targeting the IL2RA TSS, CaRE3 or CaRE4 versus a non-targeting sgRNA. Cells stimulated for 48 h with plate-bound CD3 and CD28 antibodies were also analysed. Scatter plots show gene-level abundance estimates averaged over two replicates for each condition. Genes called as differentially expressed for each targeting guide, as described in Methods, are highlighted in red in their respective plot. For visualization purposes, transcripts per million values have been scaled by the transformation x→x1/10. b, RNA-seq read coverage for IL2RA non-targeting, TSS, CaRE3 and CaRE4 gRNA samples.
Extended Data Figure 4. Chromatin features and enhancer activity of CD69 CaREs.
a, Results of the CD69 CRISPRa screen are overlapped with DNase I hypersensitivity, H3K27ac, and H3K4me1 datasets from various primary human haematopoietic cell types. Data are shown for the indicated reference epigenomes from the Roadmap Epigenomics Project. Jurkat DNase HS data are from ENCODE. b, Jurkat cells were nucleofected with luciferase reporter constructs containing sequences from CD69 CaREs upstream of a generic minimal promoter. 18 h after nucleofection, cells were split between a stimulation plate coated with anti-CD3/CD28 antibodies or a PBS control plate. Cells were lysed after 24 h of stimulation, followed by measurement of luciferase activity. Data are presented as mean ± s.d., n = 4 biological replicates. Data are representative of two independent experiments. The dotted line represents the threshold of relevant luciferase activity defined as two times the value from a sequence-scrambled IL-2Ra CaRE4 control construct. **** P ≤ 0.0001 by one-way ANOVA followed by Dunnet’s multiple comparisons test.
Extended Data Figure 5. Chromatin features and enhancer activity of IL2RA CaREs.
a, Results of the IL2RA CRISPRa screen are overlapped with with DNase I hypersensitivity, H3K27ac, and H3K4me1 datasets from primary human haematopoietic cell types. Data from the Roadmap Epigenomics Project. Jurkat DNase HS data are from ENCODE. b, Jurkat cells were nucleofected with luciferase reporter constructs containing IL2RA CaRE sequences upstream of a generic minimal promoter. 18 h after nucleofection, cells were split to a stimulation plate coated with anti-CD3/CD28 or a PBS control plate. Cells were lysed 24 h later and luciferase activity was measured. Data are presented as mean ± s.d., n = 4 biological replicates, representative of two independent experiments. Dotted line represents relevant luciferase activity defined as two times activity of sequence-scrambled IL2RA CaRE4 control. **** P ≤ 0.0001 by one-way ANOVA followed by Dunnet’s multiple comparisons test.
Extended Data Figure 6. IL2RA CaRE4 harbours a risk variant that is linked to Crohn’s disease and reduced IL2RA expression in stimulated CD4+ T cells.
a, HiChIP looping data anchored at IL2RA CaRE4 reveals that in addition to interacting with the IL2RA promoter, CaRE4 physically associates with other sites in the IL2RA locus as well as the promoters of IL15RA and RBM17. b, IL2RA regional association plot. P values of variants associated to Crohn’s disease were taken from the inflammatory bowel diseases fine-mapping study18, including all SNPs and indels in the 1000 Genomes phase 1 project. New SNPs and INDELs from the 1000 Genomes phase 3 and the UK10K projects were not included in this figure, but none of these has high LD with rs61839660 that could explain the SNP association. Genes within 150 kbp of IL2RA (from UCSC Genome Browser human GRCh37 assembly) were plotted. Figure generated using Locuszoom (http://locuszoom.org). c, Reduced IL2RA levels in stimulated primary human T cells with the natural rs61839660 variant. The minor ‘T’ allele of rs61839660 is associated with reduced IL2RA levels in stimulated primary human T cells without conditioning. d, rs61839660 is the mostly highly associated SNP with IL2RA levels in stimulated primary human T cells at 48 h after conditioning on rs2476491.
Extended Data Figure 7. Il2ra enhancer-edited mice show no steady-state immune dysfunction.
Enhancer-edited mice and littermate controls were immunophenotyped at 2–4 months of age. a, Spleens from wild-type, SNP and 12DEL mice. b, Total number of cells in spleen, peripheral lymph nodes (peri-LNs) and thymus. c, Percentage of naive (CD4+CD62L+CD44−) and memory (CD4+CD62L−CD44+) CD4+ T cells isolated from spleen and peri-LNs. d, Percentage of thymocytes in T cell developmental stages from the thymus. Data shown for CD4/CD8 single-positive, double-positive, and double-negative populations. e, f, Quantification of percentage IL-2Ra+ double-negative thymocytes and IL-2Ra MFI on IL-2Ra+ double-negative thymocytes. g, Percentage of Treg cells of CD4+ T cells in tissues of enhancer edited mice and littermate controls at 2–4 months of age. h, Quantification of IL-2Ra surface staining (geometric MFI) on FOXP3+ cells. All data are presented as mean ± s.d. and are representative of at least two independent experiments. Data are biological replicates of wild-type (n = 7), SNP (n = 4), and 12DEL (n = 5) mice (a–f) and of wild-type (n = 6), SNP (n = 4), and 12DEL (n = 5) mice (g, h). A non-parametric one-way ANOVA (* P ≤ 0.05) followed by Dunn’s multiple comparison test was used to compare enhancer-edited mice to wild-type controls.
Extended Data Figure 8. IL-2Ra induction in stimulated SNP and 12DEL T cells.
a, Wild-type, SNP and 12DEL cells that were stimulated only (‘stim’ (anti-CD3/CD28)) or stim + 50 U ml−1 IL-2 over 3 days. b, Percentage of CD69+ cells by surface levels on wild-type and enhancer edited cells 1 day after stimulation. c, Statistical analysis using Fisher’s LSD at each day of stimulation time course comparing wild-type and SNP naive T cells, with or without IL-2. d, IL-2Ra MFI on IL-2Ra+ T cells with stim or stim + 50 U ml−1 IL-2 over 3 days. Table shows the Fisher’s LSD statistical analysis at each day of T cell stimulation time course. e, IL-2Ra MFI on 12DEL naive T cells with stim, with stim + IL-2 or 10µg ml−1 anti-IL-2 blocking antibody. Data displayed in c, d and e are representative of two independent experiments. Data in d are from wild-type (n = 3) and SNP (n = 3) gender matched littermate controls. All data are normalized to IL-2Ra MFI on wild-type stim only cells at day 3. A two-way ANOVA with multiple comparisons testing followed by Fisher’s LSD test was used for statistical analysis. Data in e are from wild-type (n = 2) and 12DEL (n = 2) littermate controls. * P ≤ 0.05, ** P ≤ 0.01, *** P ≤ 0.001, **** P ≤ 0.0001.
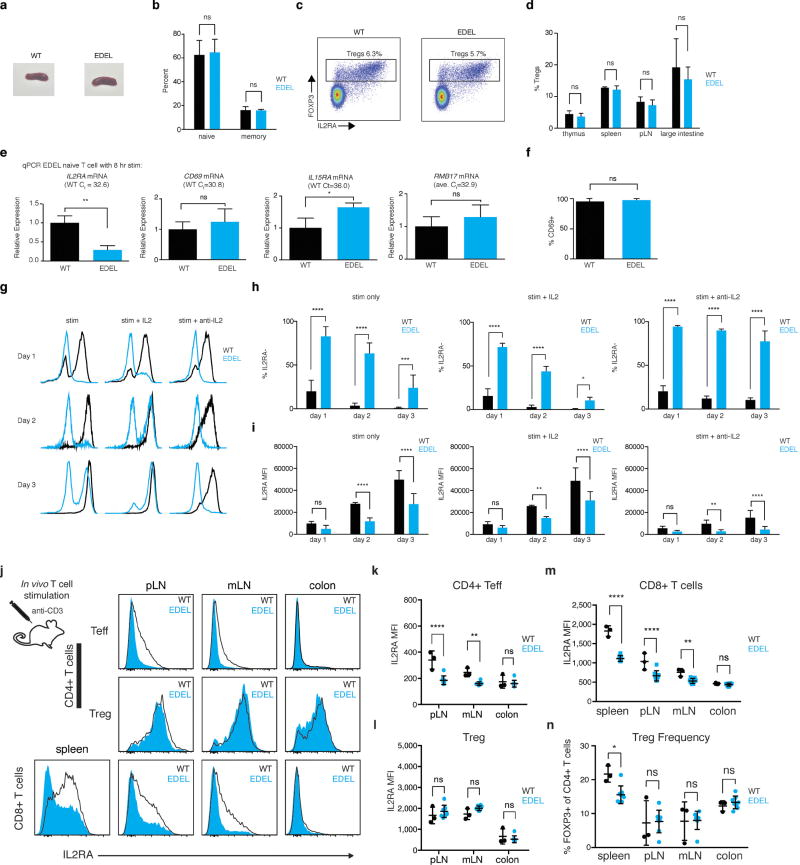
Extended Data Figure 9. Characterization of Il2ra enhancer deletion (EDEL) on the NOD background.
a, Representative spleens from wildtype and EDEL mice. b, Naive (CD62L+CD44−) and memory (CD44+CD62L−) compositions of CD4+ T cells in wild-type and EDEL. c, Representative lymph node staining showing Treg (CD4+FOXP3+) and Teff (CD4+FOXP3−) compartments. d, Quantification of Treg cell abundance across multiple different tissues. e, As we did not uncover defects in steady state T cells, we isolated naive T cells and activated them in vitro with anti-CD3/CD28 antibodies. qPCR on naive T cells from wild-type or EDEL mice 8 h after stimulation. Relative transcript levels for Il2ra, CD69 (control), Il15ra (adjacent gene), and Rbm17 (adjacent gene) are shown. The average Ct value for each transcript on wild-type cells is shown. f, CD69 protein surface expression on wild-type and EDEL naive T cells 1 day after stimulation with anti-CD3/CD28. g, Representative flow plot of 3 day time course with naive T cells stim only (anti-CD3/CD28), stim + 50 U ml−1 IL-2 or stim + 10µg ml−1 anti-IL-2. (h) Quantification of percentage of IL-2Ra− cells in the time course. i, Quantification of IL-2Ra MFI on IL-2Ra+ cells. Data were generated from two independent experiments with wild-type (n = 6) and EDEL (n = 6) mice. EDEL and wild-type mice were treated with 50µg anti-CD3 to assess the in vivo T cell response to stimulation. Mice were killed one day after treatment and IL-2Ra surface levels were checked by flow cytometry on T cells from spleen, peripheral lymph nodes (pLN), mesenteric lymph nodes (mLN) and colon. j, Representative IL-2Ra MFI histograms on CD4+ and CD8+ T cells from various tissues. k–m, Quantification of IL-2Ra MFI on CD4+FOXP3− Teff, CD4+FOXP3+ Treg and CD8+ T cells from different tissues. n, Abundance of regulatory T cells in tissues following acute stimulation with anti-CD3 antibody. Data are representative of two experiments. EDEL (n = 8) and wild-type (n = 3) littermate mice were used for experiments. A two-way ANOVA with Holm–Sidak multiple comparisons test was used for statistical analysis. * P ≤ 0.05, ** P ≤ 0.01, **** P ≤ 0.0001.
Extended Data Figure 10. Il2ra enhancer deletion promotes TH17 and inhibits iTreg CD4+ T cell differentiation in IL-2-limiting conditions.
Naive CD4+ T cells were activated with anti-CD3/anti-CD28 and differentiated in the presence of TGFβ, anti-IL-4, anti-IFNγ with high (20 ng ml−1), medium (2 ng ml−1) or no IL-6. The IL-2 activity was varied within each IL-6 concentration by adding IL-2-blocking antibody (10 ng ml−1, 1 ng ml−1 or 0.01 ng ml−1), no IL-2 or 50 U ml−1 IL-2. a–e, Five days after initial activation flow cytometry was used to assess IL-17A for TH17 differentiation (a), FOXP3 for iTreg differentiation (b), viability (c), and IL-2Ra induction (d, e). Experiments were carried out with wild-type (n = 3) and EDEL (n = 3) age matched and sex matched littermate controls. A two-way ANOVA with Holm–Sidak multiple comparisons test was used for statistical analysis. ** P ≤ 0.01, *** P ≤ 0.001.
Supplementary Material
Acknowledgments
We thank members of Marson and Corn laboratories, as well as A. Abbas, S. Qi, L. Gilbert, J. Hiatt, M. Lee, V. Nguyen, J. Weissman, J. Roose, M. Gavin and W. Leonard for suggestions and technical assistance. This research was supported by NIH grants DP3DK111914-01 (A.M., M.S.A., C.Y.), R01HG0081410-01 (A.M, W.G.), R01HL109102 (K.M.A., A.M.), P50-HG007735 (H.Y.C., W.J.G.), Scleroderma Research Foundation (H.Y.C.), the UCSF Sandler Fellowship (A.M.), a gift from Jake Aronov (A.M.), a National Multiple Sclerosis Society grant (A.M.; CA 1074-A-21), and the Marcus Program in Precision Medicine Innovation (A.M.). A.M. holds a Career Award for Medical Scientists from the Burroughs Wellcome Fund and is a Chan Zuckerberg Biohub Investigator. J.E.C. is supported by the Li Ka Shing Foundation. B.G.G. is supported by the IGI-AstraZeneca Postdoctoral Fellowship. K.M.A. is a Leukemia & Lymphoma Society Scholar. J.D.G. is a National Science Foundation Predoctoral Fellow. K.S. is supported by a DFG Postdoctoral Fellowship. We thank Jackson Laboratories for generating the SNP and EDEL mice and Agilent for generating oligo pools for cloning of the CRISPRa gRNA library. We thank UC Berkeley High Throughput Screening Facility and Flow Cytometry Facility. This work used the Vincent J. Coates Genomics Sequencing Laboratory at UC Berkeley, supported by NIH S10 Instrumentation Grants S10RR029668 and S10RR027303. We also relied on the Flow Cytometry Core at UCSF, supported by the Diabetes Research Center grant NIH P30 DK063720.
Footnotes
Supplementary Information is available in the online version of the paper.
Author Contributions D.R.S., B.G.G, J.E.C. and A.M. designed the study and wrote the manuscript. B.G.G., M.B., N.L.B., T.M., G.J.R. and G.L.C. performed and analysed CRISPRa screens. B.G.G., D.R.S., N.N., J.S.C. and H.M. performed luciferase reporter cloning and experiments. D.R.S., T.L.R., J.D.G., Y.L., A.C., M.L.N., Z.L., J.M.W, E.B., F.V.G, V.R.T, R.E.G., M.S. and K.S. contributed to functional experiments on CaRE4 and rs61839660. M.R.M., A.T.S., W.J.G. and H.Y.C. generated and analysed HiChIP data. D.S.L. and C.Y. performed ImmVar QTL analysis. H.H., R.L., K.K.F. and M.J.D. contributed to fine-mapping analysis of rs61839660 disease association. D.R.S, J.D.G. and K.M.A. contributed to T cell differentiation. M.S. and J.A.B. advised on functional studies in murine models. D.R.S. and B.G.G. are joint first authors. J.E.C. and A.M. are co-corresponding and co-senior authors.
The authors declare competing financial interests: details are available in the online version of the paper.
References
- 1.Farh KK-H, et al. Genetic and epigenetic fine mapping of causal autoimmune disease variants. Nature. 2015;518:337–343. doi: 10.1038/nature13835. [DOI] [PMC free article] [PubMed] [Google Scholar]
- 2.Maurano MT, et al. Systematic localization of common disease-associated variation in regulatory DNA. Science. 2012;337:1190–1195. doi: 10.1126/science.1222794. [DOI] [PMC free article] [PubMed] [Google Scholar]
- 3.Ernst J, et al. Mapping and analysis of chromatin state dynamics in nine human cell types. Nature. 2011;473:43–49. doi: 10.1038/nature09906. [DOI] [PMC free article] [PubMed] [Google Scholar]
- 4.Canver MC, et al. BCL11A enhancer dissection by Cas9-mediated in situ saturating mutagenesis. Nature. 2015;527:192–197. doi: 10.1038/nature15521. [DOI] [PMC free article] [PubMed] [Google Scholar]
- 5.Korkmaz G, et al. Functional genetic screens for enhancer elements in the human genome using CRISPR–Cas9. Nat. Biotechnol. 2016;34:192–198. doi: 10.1038/nbt.3450. [DOI] [PubMed] [Google Scholar]
- 6.Rajagopal N, et al. High-throughput mapping of regulatory DNA. Nat. Biotechnol. 2016;34:167–174. doi: 10.1038/nbt.3468. [DOI] [PMC free article] [PubMed] [Google Scholar]
- 7.Komor AC, Badran AH, Liu DR. CRISPR-based technologies for the manipulation of eukaryotic genomes. Cell. 2017;168:20–36. doi: 10.1016/j.cell.2016.10.044. [DOI] [PMC free article] [PubMed] [Google Scholar]
- 8.Laguna T, et al. New insights on the transcriptional regulation of CD69 gene through a potent enhancer located in the conserved non-coding sequence 2. Mol. Immunol. 2015;66:171–179. doi: 10.1016/j.molimm.2015.02.031. [DOI] [PubMed] [Google Scholar]
- 9.Ziegler SF, Ramsdell F, Alderson MR. The activation antigen CD69. Stem Cells. 1994;12:456–465. doi: 10.1002/stem.5530120502. [DOI] [PubMed] [Google Scholar]
- 10.Gilbert LA, et al. Genome-scale CRISPR-mediated control of gene repression and activation. Cell. 2014;159:647–661. doi: 10.1016/j.cell.2014.09.029. [DOI] [PMC free article] [PubMed] [Google Scholar]
- 11.Leonard WJ, Krönke M, Peffer NJ, Depper JM, Greene WC. Interleukin 2 receptor gene expression in normal human T lymphocytes. Proc. Natl Acad. Sci. USA. 1985;82:6281–6285. doi: 10.1073/pnas.82.18.6281. [DOI] [PMC free article] [PubMed] [Google Scholar]
- 12.Kim HP, Imbert J, Leonard WJ. Both integrated and differential regulation of components of the IL-2/IL-2 receptor system. Cytokine Growild-typeh Factor Rev. 2006;17:349–366. doi: 10.1016/j.cytogfr.2006.07.003. [DOI] [PubMed] [Google Scholar]
- 13.Fontenot JD, Rasmussen JP, Gavin MA, Rudensky AY. A function for interleukin 2 in Foxp3-expressing regulatory T cells. Nat. Immunol. 2005;6:1142–1151. doi: 10.1038/ni1263. [DOI] [PubMed] [Google Scholar]
- 14.Hnisz D, et al. Super-enhancers in the control of cell identity and disease. Cell. 2013;155:934–947. doi: 10.1016/j.cell.2013.09.053. [DOI] [PMC free article] [PubMed] [Google Scholar]
- 15.Hnisz D, et al. Convergence of developmental and oncogenic signaling pathways at transcriptional super-enhancers. Mol. Cell. 2015;58:362–370. doi: 10.1016/j.molcel.2015.02.014. [DOI] [PMC free article] [PubMed] [Google Scholar]
- 16.Goudy K, et al. Human IL-2Ra null mutation mediates immunodeficiency with lymphoproliferation and autoimmunity. Clin. Immunol. 2013;146:248–261. doi: 10.1016/j.clim.2013.01.004. [DOI] [PMC free article] [PubMed] [Google Scholar]
- 17.Mumbach MR, et al. HiChIP: efficient and sensitive analysis of protein-directed genome architecture. Nat. Methods. 2016;13:919–922. doi: 10.1038/nmeth.3999. [DOI] [PMC free article] [PubMed] [Google Scholar]
- 18.Huang H, et al. Fine-mapping inflammatory bowel disease loci to single-variant resolution. Nature. 2017;547:173–178. doi: 10.1038/nature22969. [DOI] [PMC free article] [PubMed] [Google Scholar]
- 19.Huang J, Ellinghaus D, Franke A, Howie B, Li Y. 1000 Genomes-based imputation identifies novel and refined associations for the Wellcome Trust Case Control Consortium phase 1 Data. Eur. J. Hum. Genet. 2012;20:801–805. doi: 10.1038/ejhg.2012.3. [DOI] [PMC free article] [PubMed] [Google Scholar]
- 20.Onengut-Gumuscu S, et al. Fine mapping of type 1 diabetes susceptibility loci and evidence for colocalization of causal variants with lymphoid gene enhancers. Nat. Genet. 2015;47:381–386. doi: 10.1038/ng.3245. [DOI] [PMC free article] [PubMed] [Google Scholar]
- 21.Ye CJ, et al. Intersection of population variation and autoimmunity genetics in human T cell activation. Science. 2014;345:1254665. doi: 10.1126/science.1254665. [DOI] [PMC free article] [PubMed] [Google Scholar]
- 22.Laurence A, et al. Interleukin-2 signaling via STAT5 constrains T helper 17 cell generation. Immunity. 2007;26:371–381. doi: 10.1016/j.immuni.2007.02.009. [DOI] [PubMed] [Google Scholar]
- 23.Fujino S, et al. Increased expression of interleukin 17 in inflammatory bowel disease. Gut. 2003;52:65–70. doi: 10.1136/gut.52.1.65. [DOI] [PMC free article] [PubMed] [Google Scholar]
- 24.Furtado GC, Curotto de Lafaille MA, Kutchukhidze N, Lafaille JJ. Interleukin 2 signaling is required for CD4+ regulatory T cell function. J. Exp. Med. 2002;196:851–857. doi: 10.1084/jem.20020190. [DOI] [PMC free article] [PubMed] [Google Scholar]
- 25.Chatenoud L, Bluestone JA. CD3-specific antibodies: a portal to the treatment of autoimmunity. Nat. Rev. Immunol. 2007;7:622–632. doi: 10.1038/nri2134. [DOI] [PubMed] [Google Scholar]
- 26.Kuhn C, Weiner HL. Therapeutic anti-CD3 monoclonal antibodies: from bench to bedside. Immunotherapy. 2016;8:889–906. doi: 10.2217/imt-2016-0049. [DOI] [PubMed] [Google Scholar]
- 27.Klatzmann D, Abbas AK. The promise of low-dose interleukin-2 therapy for autoimmune and inflammatory diseases. Nat. Rev. Immunol. 2015;15:283–294. doi: 10.1038/nri3823. [DOI] [PubMed] [Google Scholar]
- 28.Horlbeck MA, et al. Nucleosomes impede Cas9 access to DNA in vivo and in vitro. eLife. 2016;5:2767. doi: 10.7554/eLife.12677. [DOI] [PMC free article] [PubMed] [Google Scholar]
- 29.Kampmann M, Bassik MC, Weissman JS. Functional genomics platform for pooled screening and generation of mammalian genetic interaction maps. Nat. Protocols. 2014;9:1825–1847. doi: 10.1038/nprot.2014.103. [DOI] [PMC free article] [PubMed] [Google Scholar]
- 30.Marcel M. Cutadapt removes adapter sequences from high-throughput sequencing reads. EMBnet.journal. 2011;17:10–12. [Google Scholar]
- 31.Langmead B, Salzberg SL. Fast gapped-read alignment with Bowtie 2. Nat. Methods. 2012;9:357–359. doi: 10.1038/nmeth.1923. [DOI] [PMC free article] [PubMed] [Google Scholar]
- 32.Sinha R, et al. Index switching causes ‘spreading-of-signal’ among multiplexed samples in Illumina HiSeq 4000 DNA Sequencing. 2017 Preprint at https://doi.org/10.1101/125724.
- 33.Servant N, et al. HiC-Pro: an optimized and flexible pipeline for Hi-C data processing. Gen. Biol. 2015;16:259–270. doi: 10.1186/s13059-015-0831-x. [DOI] [PMC free article] [PubMed] [Google Scholar]
- 34.Roadmap Epigenomics Consortium. Integrative analysis of 111 reference human epigenomes. Nature. 2015;518:317–330. doi: 10.1038/nature14248. [DOI] [PMC free article] [PubMed] [Google Scholar]
- 35.Bray NL, Pimentel H, Melsted P, Pachter L. Near-optimal probabilistic RNA-seq quantification. Nat. Biotechnol. 2016;34:525–527. doi: 10.1038/nbt.3519. [DOI] [PubMed] [Google Scholar]
- 36.Pimentel HJ, Bray N, Puente S, Melsted P, Pachter L. Differential analysis of RNA-Seq incorporating quantification uncertainty. 2016 doi: 10.1038/nmeth.4324. Preprint at https://doi.org/10.1101/058164. [DOI] [PubMed]
- 37.Kim D, Langmead B, Salzberg SL. HISAT: a fast spliced aligner with low memory requirements. Nat. Methods. 2015;12:357–360. doi: 10.1038/nmeth.3317. [DOI] [PMC free article] [PubMed] [Google Scholar]
- 38.Quinlan AR, Hall IM. BEDTools: a flexible suite of utilities for comparing genomic features. Bioinformatics. 2010;26:841–842. doi: 10.1093/bioinformatics/btq033. [DOI] [PMC free article] [PubMed] [Google Scholar]
Associated Data
This section collects any data citations, data availability statements, or supplementary materials included in this article.
Supplementary Materials
Data Availability Statement
Data from the CRISPRa screen (accession number: GSE98178; Fig. 1) and RNA-sequencing (accession number: GSE98178; Extended Data Fig. 3) are available at NCBI GEO. HiChIP interaction matrices for the IL2RA promoter and IL2RA CaREs (Fig. 2a, Extended Data Fig. 6a) are available in Supplementary Table 7. Bedgraph files for ATAC-seq in Fig. 2a are available as Source Data.


