

SUMMARY
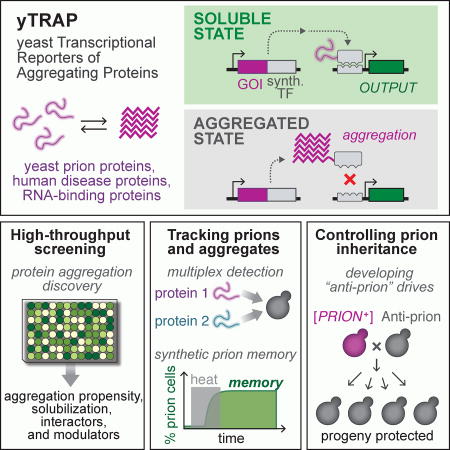
Protein aggregation is a hallmark of many diseases, but also underlies a wide range of positive cellular functions. These phenomena have been difficult to study due to a lack of quantitative and high-throughput cellular tools. Here we develop a synthetic genetic tool to sense and control protein aggregation. We apply the technology to yeast prions, developing sensors to track their aggregation states and employing prion fusions to encode synthetic memories in yeast cells. Utilizing high-throughput screens, we identify prion-curing mutants and engineer “anti-prion drives” that reverse the non-Mendelian inheritance pattern of prions and eliminate them from yeast populations. We extend our technology to yeast RNA-binding proteins (RBPs) by tracking their propensity to aggregate, searching for co-occurring aggregates, and uncovering a group of coalescing RBPs through screens enabled by our platform. Our work establishes a quantitative, high-throughput, and generalizable technology to study and control diverse protein aggregation processes in cells.
IN BRIEF
A new tool for tracking and quantifying protein aggregation and prion inheritance in live cells.
INTRODUCTION
Cellular aggregates are associated with many diseases, including neurodegeneration (Aguzzi and Lakkaraju, 2016), type II diabetes (Mukherjee et al., 2015), systemic amyloidosis (Blancas-Mejia and Ramirez-Alvarado, 2013), and even aging (Lopez-Otin et al., 2013). However, it is also becoming clear that protein aggregates have beneficial functions in many biological processes. These include signal transduction in the human immune system (Cai et al., 2014; Franklin et al., 2014), synaptic regulation and memory (Majumdar et al., 2012), RNA regulation in the cellular stress response (Han et al., 2012; Protter and Parker, 2016), melanin production (Fowler et al., 2006), and microbial biofilm formation (Taglialegna et al., 2016).
Broadly, aggregation is the assembly of proteins into large complexes that can grow without a fixed endpoint. Aggregates can differ from one another in conformational diversity, size, and the diversity of components. All these factors render typical structural techniques inapplicable. Correspondingly, methods to describe protein aggregation in vivo are largely qualitative and ad hoc. Quantitative and high-throughput techniques to study aggregation are urgently needed to discover treatments for pathological aggregates and interrogate functional aggregates.
Since their discovery as the causative agents of transmissible neurodegenerative disorders, prions have served as model protein aggregates. Prions are self-propagating protein conformations found across model organisms, from bacteria to mammals. Much of what we know about prions comes from studies in yeast, where some endogenous proteins can switch from non-prion conformations to prion aggregate conformations, resulting in dramatic changes in protein activity. This switching produces new, heritable phenotypes (Halfmann et al., 2012; True and Lindquist, 2000). Because the aggregated prion conformation is transmitted through the cytoplasm, they and their associated phenotypes are inherited in a non-Mendelian fashion (Wickner, 1994). Tools to detect and manipulate prions in a variety of contexts are necessary to comprehensively explore their adaptive traits, and potentially exploit them to engineer new cellular functionalities.
The ability of most yeast prions to adopt the prion state in cells is mediated by ‘prion domains’ (PrDs) that can nucleate and propagate amyloid conformations. The observation that many known yeast prions harbor PrDs rich in glutamine (Q) and/or asparagine (N) residues has motivated the development of algorithms to look for such sequences across all proteomes (Alberti et al., 2009).
In the human proteome, 240 genes contain prion-like, Q/N-rich sequences (March et al., 2016). These genes are heavily enriched for RNA-binding and RNA-processing activity, including many aggregation-prone proteins associated with fatal neurodegenerative diseases (Harrison and Shorter, 2017). However, natural assemblies/aggregates of RNA-binding proteins (RBPs) are important for RNA storage, processing, and degradation (Protter and Parker, 2016). RBP assemblies are also involved in the regulation of synaptic long-term potentiation (Majumdar et al., 2012), memory in yeast (Caudron and Barral, 2013), and the cellular stress response (Riback et al., 2017). Factors involved in the transition of RBPs from their natural context into disease-associated aggregates remain poorly understood, as do the immediate consequences of aggregation.
Here, we use synthetic biology to develop a versatile genetic toolkit for quantitatively sensing and controlling protein aggregation states in cells. yTRAP (yeast Transcriptional Reporting of Aggregating Proteins) is based on coupling the solubility state of a protein-of-interest to the regulation of synthetic transcriptional outputs. We first use yTRAP to construct prion sensors and track prion states in live cells. Next, we use yTRAP in conjunction with a potent inducer of the [PSI+] prion to engineer synthetic memory in yeast cells. Additionally, using yTRAP to screen mutant libraries of prions, we select for mutant prion alleles that cure endogenous [PRION+] states. Using these alleles, we construct “anti-prion drive” systems to cure prions and reverse the dominant inheritance of prion states in mating partners and progeny. We then employ yTRAP as a screening platform to detect factors that influence the aggregation of yeast RBPs, including the closest yeast homolog of hnRNPA1, Hrp1, and investigate the consequences of its aggregation. Our results establish a generalizable cell-based technology to observe, screen, and manipulate protein aggregation phenomena.
RESULTS
Development of a genetic tool that sensitively detects protein aggregation states
To detect protein aggregation in living cells, we developed a genetic tool termed yTRAP (yeast Transcriptional Reporters of Aggregating Proteins). The yTRAP cassette is composed of: (1) a ‘yTRAP fusion’ of the protein-of-interest with a synthetic transcriptional activator (synTA), constitutively expressed at low levels; (2) a reporter gene regulated by a synTA-responsive promoter (Figures 1A and S1A). The system functions by linking transcriptional activation of the reporter to the solubility of the yTRAP fusion. In the soluble state, the synTA binds to its cognate promoter and induces strong expression of the reporter gene. Aggregation of the fusion protein limits the availability of the synTA to regulate its promoter, thus reducing the transcriptional output of the system. The synthetic fusion can either join existing aggregates endogenous to the cell, or be the sole source of a heterologous aggregating protein. Moreover, the synTAs utilize engineered zinc finger proteins that target synthetic binding sequences (BS); the modular design of these regulators enables yTRAP fusions to be readily constructed for any protein and the customization of transcriptional outputs (Khalil et al., 2012).
Figure 1. Development of a genetic tool to detect protein aggregation states in cells.
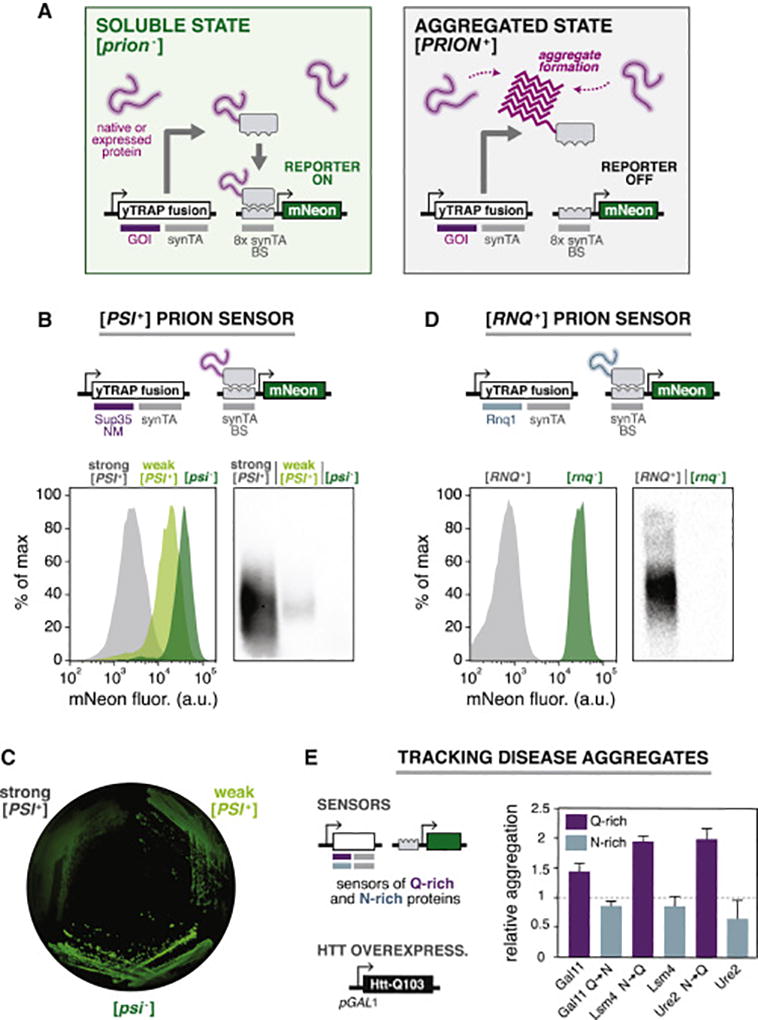
(A) The yTRAP system functions by transmitting the aggregation state of proteins to synthetic transcriptional outputs. The system consists of a “yTRAP fusion” of a gene-of-interest (GOI) to a synthetic transcriptional activator (synTA), and a reporter gene controlled by a synTA-responsive promoter. The fusion functions as a cellular probe of protein solubility. It strongly activates the reporter in the soluble state (left), but not in an aggregated state (right). BS: ‘binding site’ of the synTA.
(B) Top: Genetic design of the [PSI+] prion sensor. Bottom left: Histograms of the sensor output for yeast strains harboring different variants of the prion: strong [PSI+], weak [PSI+], and [psi−]. Bottom right: SDD-AGE analysis of prion aggregates in the same strains.
(C) Fluorescence image of an agar plate showing the sensor output for yeast colonies harboring different variants of [PSI+].
(D) Top: Genetic design of the [RNQ+] prion sensor. Bottom left: Histograms showing the sensor output for [RNQ+] and [rnq−] cells. Bottom right: SDD-AGE analysis of prion aggregates in the same strains.
(E) Left: yTRAP sensors were constructed for a panel of asparagine (N) or glutamine (Q) rich protein domains in a strain with inducible polyQ-expanded Huntingtin Exon1 (Htt-Q103). Right: Relative aggregation of each sensor was measured after overexpression of Htt-Q103 (n=3, error bars, SD).
We first determined the yTRAP reporter output for different levels of soluble synTA. Using an estradiol-inducible system (Aranda-Diaz et al., 2017), we titrated synTA protein level in the cell and measured the corresponding reporter output using flow cytometry. This revealed a linear relationship between soluble synTA protein levels and reporter outputs across a ~50-fold dynamic range, with only 1.5% basal expression of the reporter gene in the absence of synTA (Figure S1B).
To validate the tool we applied yTRAP to detect the well-established yeast prion [PSI+], formed by self-templating aggregates of Sup35. The yTRAP fusion consists of the Sup35 prion domain (NM) fused to a synTA. Sup35, like several other prion proteins, can adopt multiple self-templating amyloid conformations, producing varied ratios of soluble/aggregated protein in the cell. We introduced the PSI sensor into three yeast strains representing variants of this prion: strong [PSI+], weak [PSI+], and [psi−]. Each variant was clearly distinguishable by a variety of visualization techniques, with stronger aggregation yielding less yTRAP signal (Figures 1B, C, D, S1C). We confirmed that the yTRAP fusion protein was incorporated into amyloid aggregates in cells harboring the [PSI+] prion but not in cells harboring the non-prion [psi−] state using semi-denaturing detergent agarose gel electrophoresis (SDD-AGE) (Figure 1B) (Halfmann and Lindquist, 2008). Previous methods to detect a prion state have relied on the use of genetic backgrounds that change cellular phenotypes upon changes to the prion state. (Halfmann et al., 2012; True and Lindquist, 2000). Uniquely, yTRAP allows batch or single-cell measurement of aggregation state independent of the genetic background (Figure S1E). Taken together, these results demonstrate that yTRAP is a highly-sensitive genetic sensor that can quantitatively distinguish between prion states.
yTRAP enables interrogation of diverse prion and aggregation-prone elements
Finding reliable, natural phenotypes for yeast prions other than [PSI+] has been challenging. yTRAP overcomes this challenge by coupling solubility to synthetic transcriptional outputs, rapidly enabling the construction of sensors for a variety of different proteins. To demonstrate the adaptability of yTRAP, we assembled a sensor for a second yeast prion, [RNQ+], by encoding a yTRAP fusion using Rnq1 (“RNQ sensor”, Figure 1D). Many wild and laboratory strains of yeast harbor the [RNQ+] prion, also known as [PIN+]. However, it has been a particularly difficult prion to track due to the lack of growth phenotypes conferred by the prion. When we introduced the RNQ sensor into a [RNQ+] strain, we observed a low-fluorescence state (Figure 1D). After curing the strain of the [RNQ+] prion by transient inhibition of Hsp104 (Derkatch et al., 1997), the sensor’s output switched to a high-fluorescence state. Incorporation of the yTRAP fusion protein into the amyloid state in [RNQ+], but not [rnq−] cells was confirmed by SDD-AGE analysis (Figure 1D).
Extending this general approach, we built sensors for a panel of other yeast prion proteins: Swi1, Mot3-PrD, and New1-PrD (Alberti et al., 2009; Du et al., 2008; Osherovich and Weissman, 2001). Importantly, with these sensors, we were able to not only detect existing prion states, but also to isolate newly-formed prion states and subsequently observe their curing by Hsp104 inhibition (Figures S1C and S1F). These results establish a synthetic, “plug-and-play” toolkit for detecting and isolating prion states, applicable for different prions and across genetic backgrounds.
Next, we explored whether yTRAP could be used to interrogate the aggregation of human disease proteins using the huntingtin protein associated with Huntington’s disease as a model system. Individuals with longer polyglutamine (polyQ) tracts produce more aggregation-prone protein. We compared the solubility of yTRAP sensors for a highly polyQ-expanded huntingtin exon 1 (Htt-Q103, containing 103 glutamine residues) to a shorter expansion (Htt-Q25). Both yTRAP fusion proteins were expressed at the same level, yet yTRAP sensor outputs confirmed that Htt-Q103 was more aggregated than Htt-Q25 (Figure S1G).
PolyQ aggregates have been shown to sequester other cellular proteins, a property that likely contributes to their toxicity (Gong et al., 2012; Park et al., 2013; Wang et al., 2007). We generated yTRAP sensor strains for a panel of previously-characterized Q- and N-rich yeast protein fragments, pairs of which differ only in Q/N content (Halfmann et al., 2011), and measured the change in yTRAP signal in response to Htt-Q103 overexpression. Note that although both Q- and N-rich proteins are aggregation prone, only Q-rich proteins were previously observed to co-localize with Htt-Q103 (Kayatekin et al., 2014). As assessed by yTRAP, Q-rich proteins showed a marked shift to an aggregated state when Htt-103Q was expressed, while matched N-rich control proteins were unaffected (Figure 1E). Our results support the model that Q-rich proteins are particularly susceptible to sequestration by polyQ-expanded huntingtin, and illustrate the potential of yTRAP to screen for factors that influence disease-relevant aggregation.
Positive detection of aggregation and multiplex tracking of prion states
The yTRAP tool is built from programmable synthetic components. As a result, yTRAP-based genetic circuits can be constructed to produce custom sensor programs. For example, we designed a sensor system with reverse output logic, which turns ON upon aggregate formation. In the ‘reverse-yTRAP’ scheme, the synTA-responsive promoter controls expression of a TetR repressor (fused to mKate2), which in turn regulates a Tet-repressible reporter (Figures S2A and S2B). When the yTRAP fusion protein is soluble, TetR-mKate2 is expressed and the reporter is repressed. This repression is relieved when the yTRAP fusion is aggregated. We built and introduced a Rnq1 reverse-yTRAP sensor into [RNQ+] and [rnq−] cells, revealing strongly separated high green / low red and low green / high red fluorescent states, respectively (Figure S2A). By adding a second fluorescent output, which gains signal upon aggregation, the reverse-yTRAP system enhances measurement sensitivity, especially in detection of the onset of aggregation.
The study of prions in high throughput has been limited to interrogating the behavior of individual prions, partly because each yeast prion has required a tailored genetic background for detection. By unlocking additional synthetic transcriptional channels, yTRAP enables the tracking of multiple prion proteins at the single-cell level. To do this, we designed a ‘dual prion sensor’ by utilizing two orthogonal pairs of synTAs / responsive promoters (Khalil et al., 2012). The dual prion sensor consists of two cassettes, each encoding (1) a yTRAP fusion comprising a protein-of-interest fused to a distinct synTA and (2) a corresponding synTA-controlled unique reporter (Figures 2A and S2C). We used this framework to develop a dual PSI / RNQ sensor (Figure 2A–B). With the availability of a suite of orthogonal synTA-promoter pairs (Khalil et al., 2012), we envision these yTRAP combinations can be expanded to allow greater numbers of proteins to be simultaneously monitored.
Figure 2. A dual prion sensor enables multiplex detection and isolation of [PSI+] and [RNQ+] states.
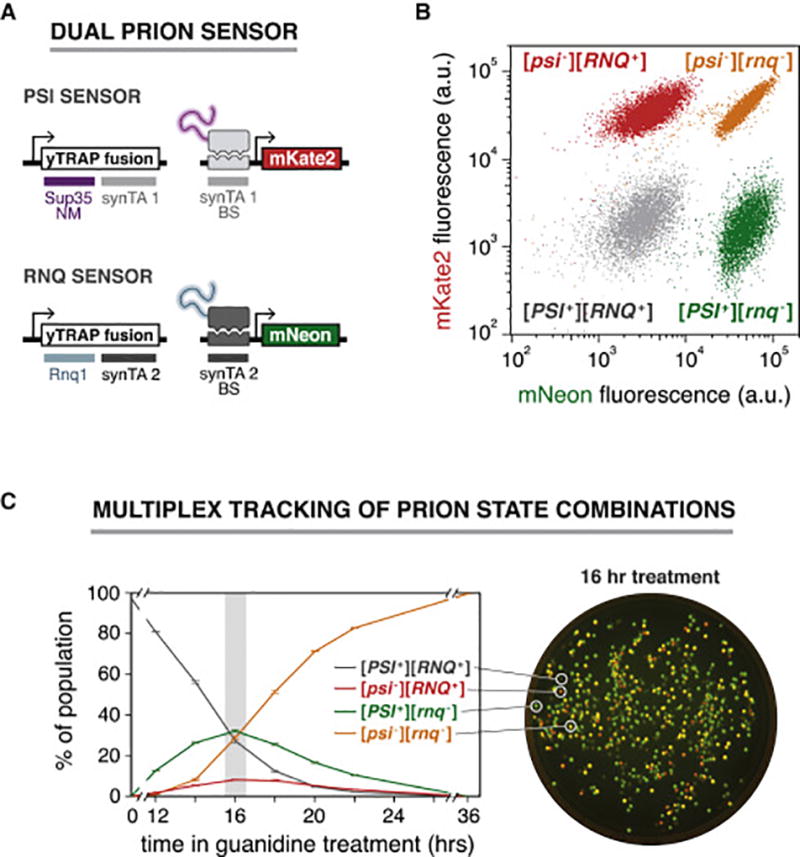
(A) Genetic design of the dual prion sensor for [PSI+] and [RNQ+]. Each prion protein is coupled to a distinct transcriptional output channel through orthogonal synTA / promoter pairs.
(B) Flow cytometry measurements of the dual PSI / RNQ sensor for four yeast strains harboring all four combinations of the [PSI+] and [RNQ+] prions.
(C) Left: Time course measurements of dual prion sensor cells tracking the conversion from a [PSI+] [RNQ+] population to a fully cured [psi−] [rnq−] population by Hsp104 inhibition (n=3, error bars, SD). Right: Overlaid fluorescence image of an agar plate showing the heterogeneous population of prion states following 16 hours of treatment.
We next sought to apply the dual PSI / RNQ sensor to simultaneously track the behavior of these two prions in response to a stimulus. We subjected a population of [PSI+] [RNQ+] cells to guanidine hydrochloride treatment, took samples at different durations of treatment, and allowed them to recover in growth media lacking guanidine for a minimum of six generations. We then assessed prion states using flow cytometry (Figure 2C, left). We could readily distinguish combinations of prion / non-prion states that were sampled by the population as it progressed from entirely [PSI+] [RNQ+] to [psi−] [rnq−] (Figure 2C). At every time point, the number of cells cured of [RNQ+] was always greater than the number cured of [PSI+], indicating that [RNQ+] is more readily cured by guanidine hydrochloride, as has been previously reported (Derkatch et al., 2000).
A hyper-inducing prion fusion enables construction of synthetic memory
yTRAP transmits the heritable prion state of the cell into distinct transcriptional outputs. To harness this property as synthetic cellular memory, we required a means to engineer “programmed” prion switching. We sought to control [PSI+] prion induction by cross-seeding Sup35 with pre-existing Rnq1 amyloids.
Cross-seeding has previously been shown to increase [PSI+] induction efficiency to ~10% using a Sup35NM-Rnq1 fusion (NM-Rnq1) (Choe et al., 2009). We sought to improve its efficiency by tethering the two amyloid-forming domains even closer together, creating N-Rnq1-M (Figure 3A). We transiently expressed this fusion in cells harboring the dual PSI / RNQ sensor, and compared its efficiency in inducing [PSI+] with NM-Rnq1 and Sup35NM alone (NM). Strikingly, N-Rnq1-M was able to induce [PSI+] in >99% of the population, as compared with 2% of cells for NM and 10% for NM-Rnq1 (Figures 3B, S3A, B). Moreover, unlike NM-Rnq1 overexpression which cured [RNQ+] in most cells, N-Rnq1-M overexpression showed very little curing of the [RNQ+] prion (Figure S3C). This unexpected [RNQ+] curing effect by NM-Rnq1, but not N-Rnq1-M, may explain their large difference in [PSI+] induction potential, and highlights the importance of tracking multiple prions at once.
Figure 3. Designing a hyper-inducing prion fusion to encode synthetic cellular memory.
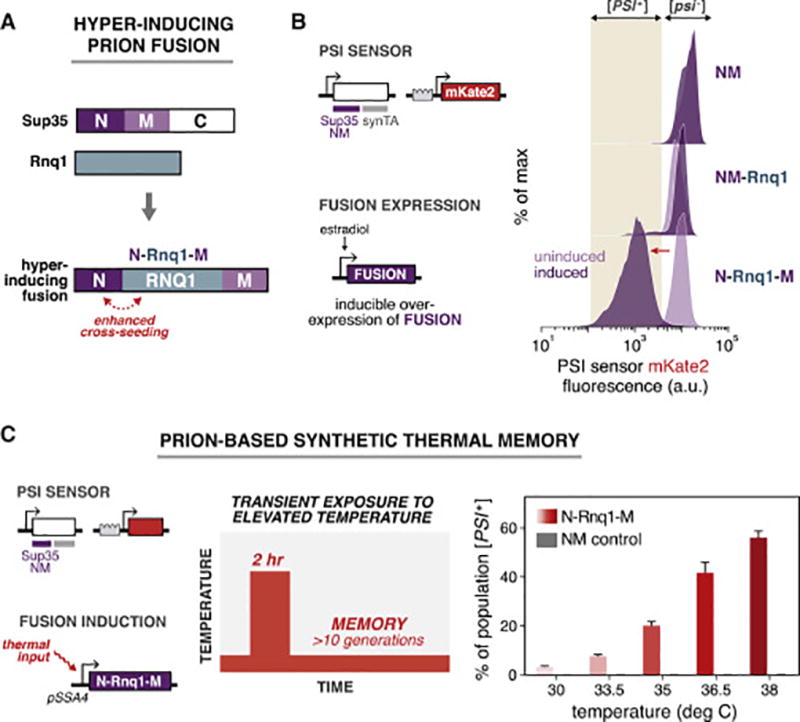
(A) Architecture of the hyper-inducing prion fusion, which is a fusion of the Sup35 N domain, the full Rnq1 protein, and the Sup35 M domain.
(B) Left: Yeast strains were constructed to harbor the dual PSI / RNQ sensor and a construct for induction of [PSI+]-inducing proteins N-Rnq1-M, NM-Rnq1, and NM. Right: Histograms of the PSI sensor output before (light purple) and after (dark purple) transient expression of prion-inducing fusions.
(C) Left: A synthetic thermal memory circuit. N-Rnq1-M is placed under the control of the temperature-responsive SSA4 promoter in a Sup35NM [psi−] sensor strain. Middle: Heat treatment during the thermal memory experiment. Right: Percentage of the population converted to the [PSI+] state after transient exposure to different temperatures. NM (gray bars) expression was used as a negative control for the N-Rnq1-M fusion (red gradient). (n=3, error bars, SD).
Equipped with a hyper-inducing prion fusion, we next sought to build a synthetic memory device based on [PSI+] induction. We hypothesized that by linking expression of N-Rnq1-M to the presence of an environmental signal, we could create and heritably store signals in the prion state of cells. Using temperature as a proof-of-principle, we constructed strains that express N-Rnq1-M or NM under the control of the heat-responsive SSA4 promoter (Figure 3C). We subjected cultures of these strains to a two-hour stimulus of elevated temperature between a range of 30°C–38°C. We then recovered the cells for over 10 generations at 25°C and measured the percentage of the population that switched to [PSI+]. As the temperature increased, so did the proportion of the N-Rnq1-M expressing population that had induced and maintained the [PSI+] prion (Figure 3C). In contrast, the NM-inducing control strain showed no [PSI+] induction for any temperature.
A high-throughput genetic screen identifies prion-curing alleles
On account of the many disease-associated protein aggregates (Aguzzi and Lakkaraju, 2016), identifying means to prevent aggregation or remove aggregates is of paramount importance. yTRAP coupled with fluorescence-activated cell sorting (FACS) enables rapid high-throughput screening of pooled libraries of mutants for rare alleles that prevent aggregation in trans. To demonstrate this, we used yTRAP to screen for mutant prion alleles that cure [PSI+] and [RNQ+] (Figure 4A). We mated cells containing libraries of Sup35 and Rnq1 mutants (Huang et al., 2013) to the respective [PSI+] and [RNQ+] yTRAP sensor strains and performed two successive rounds of FACS enrichment for highly fluorescent cells. We then isolated and sequenced the enriched plasmids (Table S1). We re-tested each prion-curing mutant allele by transiently overexpressing it in a [PSI+] [RNQ+] strain harboring the dual prion sensor.
Figure 4. Prion-curing mutations identified using a high-throughput genetic screen.
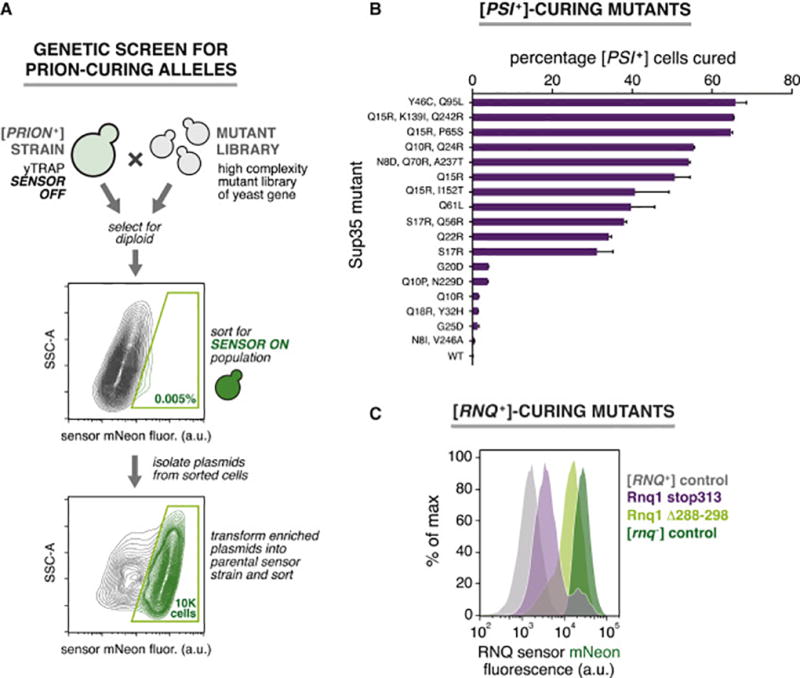
(A) yTRAP FACS screen for prion-curing alleles. Two successive rounds of sorting for enriched for mutant prion alleles that cure endogenous prions.
(B) Curing efficiencies of [PSI+]-curing mutants (n=2, error bars, range between duplicates).
(C) Flow cytometry histograms of yTRAP signal following transient expression of [RNQ+]-curing mutants.
We recovered many of the previously reported prion-curing alleles of Sup35 (DePace et al., 1998), including Q10R, Q15R, and Q24R (Figure 4B). We also recovered several new alleles, notably the first that do not involve the introduction of a charged residue: Q61L and the double mutant Y46C, Q95L.
The screen for [RNQ+]-curing alleles yielded two variants: Δ288–298, and a nonsense mutation resulting in a truncated protein at amino acid 313 (stop313; Figure 4C). The Δ288–298 deletion spans an oligopeptide repeat and was previously identified as a naturally occurring allele in S. cerevisiae (Resende et al., 2003). In the Yeast Genome Database, 4 of 45 sequenced genetic backgrounds of S. cerevisiae possessed this allele. None of the strains harbored the stop313 mutation, nor any of the discovered Sup35 mutations. Interestingly, following transient expression, both of the RNQ1 mutations caused an increase in yTRAP signal that did not overlap with the [rnq−] control (Figure 4C). These mutants heritably remodeled the prion to a more soluble state. A small percentage of the population that had overexpressed Rnq1 stop313 were cured of [RNQ+], indicated by a small high-fluorescence peak. The Δ288–298 mutation caused an overall shift in the population, with a very broad profile indicating a diversity of inherited weaker [RNQ+] or [rnq−] states.
Because these experiments were conducted in the PSI / RNQ dual prion sensor, we could evaluate the effect of each variant on the other prion protein as well. The wild type Sup35 and the majority of the [PSI+]-curing Sup35 mutants also cured [RNQ+] (Figure S4). The two exceptions were the double mutant S17R, Q56R and the double mutant Q10R, Q24R. Our results illustrate the potential of yTRAP to enable high-throughput screens for aggregation-modifying factors.
Anti-prion drive systems engineered using prion-curing alleles
Gene drives are genetic systems that bias the standard Mendelian inheritance of a particular gene to increase its prevalence in a population (DiCarlo et al., 2015). Prion-curing mutant alleles offer a unique opportunity to reverse the typical 4:0 phenotypic inheritance of the [PSI+] and [RNQ+] prions. If a strain is engineered to express a prion-curing mutant, it will cure the prion that is present in its mating partner instead of acquiring a prion state, and future progeny will not inherit the prion (Figure 5A). We term this mode of inheritance an “anti-prion drive” (APD), as it biases the inheritance of prion phenotypes from 4:0 toward 0:4.
Figure 5. Engineered anti-prion drive systems eliminate prions from mating partners and progeny.
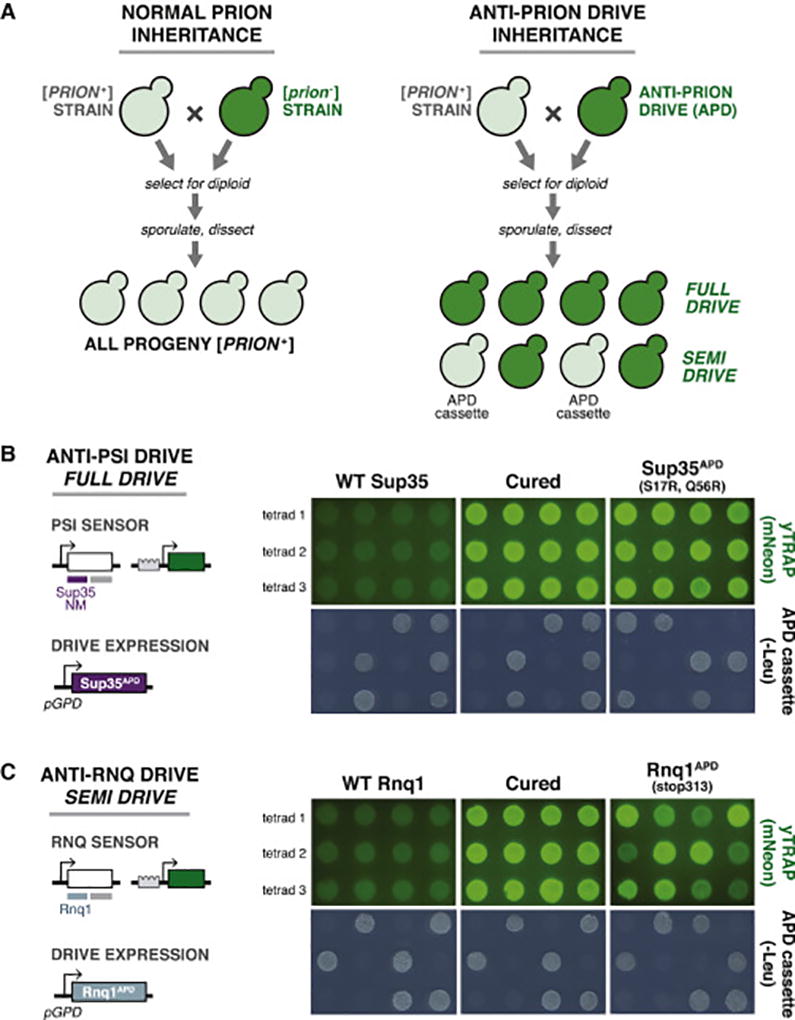
(A) Diagram of typical, dominant prion inheritance (left) and anti-prion drive inheritance (right) through mating and sporulation. Rather than 4:0 inheritance typical for [PSI+] and [RNQ+], an anti-prion drive will cause reversal of this inheritance pattern, resulting in 0:4 segregation (“full drive”) or curing of the prion in spores that do not inherit the drive expression cassette (“semi drive”).
(B) Left: Genetic design of the anti-PSI drive system. The drive strain harbored a PSI sensor and a cassette encoding constitutive expression of a [PSI+]-curing allele (Sup35NMAPD=S17R, Q56R). Right: Three dissected tetrads after mating the anti-[PSI+] drive strain to a [PSI+] strain. Fluorescence images of spores showed the prion state via yTRAP. Wild type Sup35 was used as a negative control in place of the prion-curing mutation. Guanidine curing of the wild type spores (“Cured”) was used as a positive control for curing. -Leu media selected for spores containing the drive cassette.
(C) Left: Genetic design of the anti-RNQ drive system. The drive strain harbored a RNQ sensor and a cassette encoding constitutive expression of a [RNQ+]-curing allele (Rnq1APD=stop313). Right: The drive eliminated [RNQ+] from spores that do not inherit the drive cassette (“semi drive”). As above for Sup35NM, wild type Rnq1 and its guanidine-cured derivatives were used as controls.
We used the Sup35 S17R, Q56R double mutant to construct an “anti-PSI drive” due to its efficient and highly selective [PSI+]-curing potential (Figures 4B and S4), and the stop313 Rnq1 mutant to construct an “anti-RNQ drive”. We cloned each prion-curing allele or a wild type control into a plasmid with strong constitutive expression, and integrated these into the genome of a strain harboring the respective yTRAP sensor (Figures 5B and 5C). We then mated these strains to the corresponding [PRION+] strain also harboring the yTRAP sensor. We selected for diploids, sporulated them, and dissected tetrads to determine the segregation frequency of the phenotype (Figures 5B and 5C).
The anti-PSI drive cured every tetrad of the prion state (“full drive”): spores had the same fluorescence as prion-cured controls (Figures 5B and S5B). The anti-RNQ drive also caused curing of the [RNQ+] prion, but acted as a “semi drive”. The spores that segregated with the APD cassette exhibited intermediate yTRAP fluorescence (Figure 5C), indicative of acquiring a weaker variant of the [RNQ+] prion; these spores could be further cured to a [rnq−] state (Figure S5D). In contrast, spores that no longer had the anti-RNQ construct were completely cured of the [RNQ+] prion, and were not further cured on guanidine hydrochloride-containing media (Figure S5D). This unusual inheritance pattern was confirmed by western blotting for Rnq1 following supernatant/pellet fractionation of cell extracts (Figure S5E). For both the anti-PSI and anti-RNQ drives, all dissected tetrads showed the expected 2:2 segregation of the APD cassette, which allows growth on medium lacking leucine (Figure 5B, -Leu). These results suggest a mechanism of [RNQ+] curing by the stop313 mutant, whereby the mutant causes a change in the prion conformation to one that requires the stop313 Rnq1 protein to propagate. Once that mutant allele is removed and only the wild type Rnq1 protein remains, the new prion variant is no longer propagated.
One of the RNQ1 mutant alleles identified in our screen, Δ288–298, is a naturally-occurring variant (Figure 4C). To explore the effect of this natural allele when mated with [RNQ+] partners, we tested it in the same context as the drives above. Interestingly, we found that this allele did not cure any prions in progeny cells, but rather functioned as a “prion-remodeling drive” (RD), capable of altering the solubility of Rnq1 in all progeny (Figures S5F and S5G). Specifically, spores that did not inherit the Δ288–298 RNQ1 allele were heritably changed to a more soluble state of [RNQ+] (Figure S5G). Spores that did inherit the drive cassette showed an even greater degree of solubility. This process is reminiscent of genetic recombination, where two different parental chromosomes are mixed to produce a new, diverse haplotype. In an analogous manner, two parents with different prion alleles or conformations may interact to produce a new prion conformation that was not present in either parent.
Generation of a yTRAP sensor library for RNA-binding proteins
The phenomenon of protein aggregation extends to many areas of biology beyond the amyloid-like aggregation observed with yeast prions—from aberrant aggregates of disease-associated misfolded proteins to controlled phase transitions in cellular droplets. yTRAP has allowed us to overcome challenges associated with traditional methods of analyzing yeast prions. We next sought to address challenges in studying protein aggregation more broadly with yTRAP.
The aggregation of RBPs has gained recent attention as a causal agent in neurodegeneration (Li et al., 2013) and in the formation of functional, membraneless RNP bodies (March et al., 2016). To enable quantitative analysis of RBP aggregation, we created a yTRAP sensor library encompassing every known yeast RBP with an experimentally confirmed physical interaction with RNA (Table S2), constituting ~150 sensor strains (Figure S6A). We observed that the relative protein abundance of these RBP-synTA fusions does not correlate with their yTRAP signal (Figure S6B), confirming that yTRAP signal is not merely a readout of protein concentration. We also determined that none of the RBPs are likely to be in a prion state by default in this strain, as transient chaperone inhibition did not cause a heritable change in yTRAP signal (Figure S6C). With this collected panel of sensors, one experiment can quantitatively compare the aggregation of each RBP after chemical or genetic perturbation.
Screening for aggregation propensity of RNA-binding proteins
We first tested the intrinsic aggregation propensity of each RBP by measuring changes in its yTRAP signal upon overexpression of the protein (Figure 6A). Increasing the concentration of an aggregation-prone protein favors its aggregation as per the law of mass action. Hrp1, a component of the cleavage and polyadenylation factor (CPF) complex, showed the greatest signal loss when overexpressed. We confirmed that this loss of yTRAP signal for Hrp1 and another top candidate, Ngr1, was accompanied by microscopic foci formation (Figure 6B). Hrp1 is the closest yeast homolog of human hnRNPA1, the aggregation of which is associated with both MSP and ALS (Harrison and Shorter, 2017). Thus, we decided to focus on Hrp1 for further analysis.
Figure 6. Hrp1 is a particularly aggregation-prone RBP that can induce the aggregation of others.
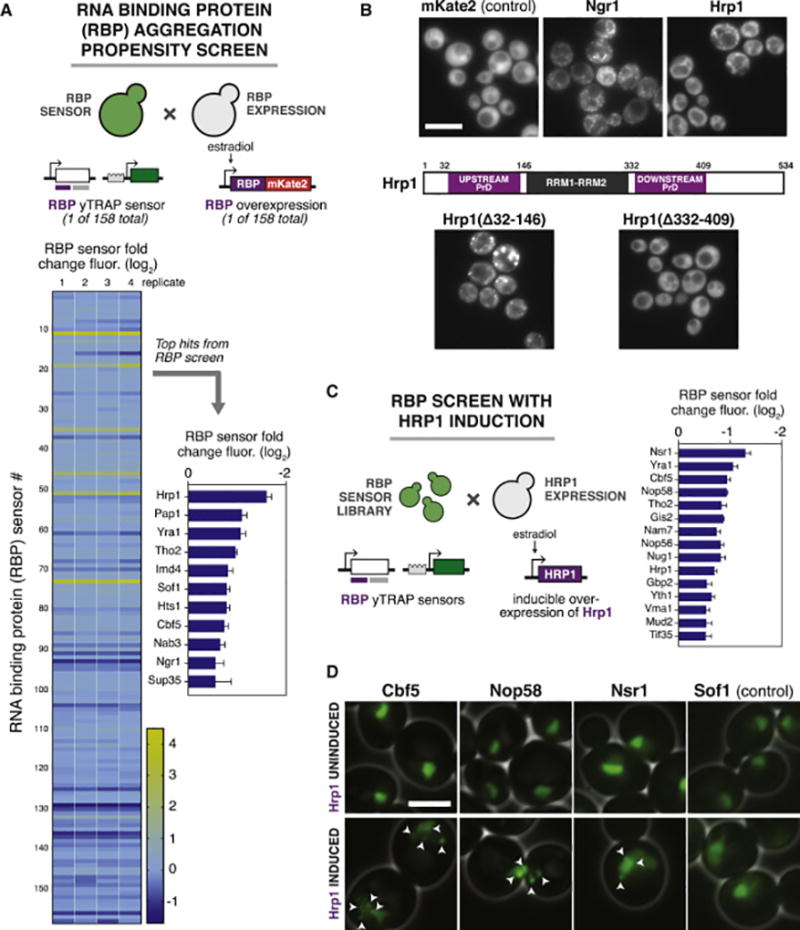
(A) A screen for the aggregation propensity of yeast RBPs. Top: Diploids were formed to overexpress each RBP in a strain that detects its own yTRAP signal. Bottom left: Heat map of aggregation propensity. Bottom right: Bar chart of the top hits (n=4, error bars, SD).
(B) Microscopy of aggregation-prone RBPs. Top: Overexpression of mKate2-tagged Ngr1 and Hrp1 compared to an untagged mKate2 control. Middle: The domain architecture of Hrp1. Q/N-rich domains resembling prion domains (PrDs) are indicated by purple boxes. Bottom: Microscopy of overexpressed, mKate2-tagged Hrp1 harboring the indicated deletions of upstream or downstream PrDs. Scale bar=10 µm.
(C) High throughput measurement of RBP aggregation in response to Hrp1 overexpression. Left: Diploids were formed to overexpress Hrp1 in each yTRAP RBP sensor. Right: Bar chart of the sensor strains showing the most significant aggregation hits in response to Hrp1 overexpression (n=3, error bars, SD).
(D) Microscopy of Hrp1-induced aggregation. Indicated proteins were tagged with mNeonGreen at their endogenous locus for visualization. Sof1, which showed no change in yTRAP signal following Hrp1 overexpression, was used as a negative control. Uninduced and induced fluorescent images for each RBP were identically contrast-scaled. White arrows indicate foci. Scale bar=5 µm.
We observed aggregation of Hrp1 during a short burst of overexpression, however its sustained overexpression was detrimental to cell growth (Figure S6D). Hrp1 is predicted to possess two separate PrDs (Figure 6B), which may be responsible for the observed aggregation (Alberti et al., 2009) and toxicity. To test this, we deleted each region separately and overexpressed them with fluorescent tags. Overexpression of Hrp1 in which the downstream PrD was deleted resulted in almost no aggregation or toxicity (Figures 6B and S6D). In contrast, removal of the upstream PrD increased both aggregation and toxicity. Furthermore, Hrp1 missing the upstream PrD sequestered endogenous Hrp1 into co-localized aggregates (Figures S6E) (we confirmed that fluorescent channel “bleedthrough” was negligible and not confounding (Figure S6F)). Thus, the upstream PrD acts as a solubilizing element, while the downstream PrD is responsible for both aggregation and toxicity.
Next, we utilized the yTRAP RBP sensor library to identify co-occurring aggregates in high throughput. We examined the effect of Hrp1 overexpression on every member of the RBP yTRAP sensor library (Figure 6C). Top hits that aggregated during Hrp1 overexpression were tagged at their endogenous locus with mNeonGreen to track their localization. Microscopic imaging showed distinct foci formation of Nsr1, Cbf5, and Nop58 – all factors involved in ribosome biogenesis – upon Hrp1 overexpression (Figure 6D). These results demonstrate that yTRAP can be used to efficiently identify proteins and pathways that are perturbed upon a proteotoxic stress without a priori knowledge.
Genome-wide screen for modulators of Hrp1 aggregation
We hypothesized that the cell may utilize the ability of Hrp1 to aggregate as a natural way to modulate its function. We therefore conducted a genome-wide overexpression screen in the context of the Hrp1 yTRAP sensor to identify genes that could be involved in this pathway and affect Hrp1 aggregation. We used an estradiol-inducible system to express all yeast ORFs in the FlexGene library, over 5,500 in total (Hu et al., 2007). We mated each overexpression strain with the Hrp1 yTRAP sensor in an arrayed format, and measured the change in yTRAP signal (Figure 7A).
Figure 7. A genome-wide screen identifies Nab2 as a potent inducer of Hrp1 aggregation, perturbing its 3’ UTR processing function.
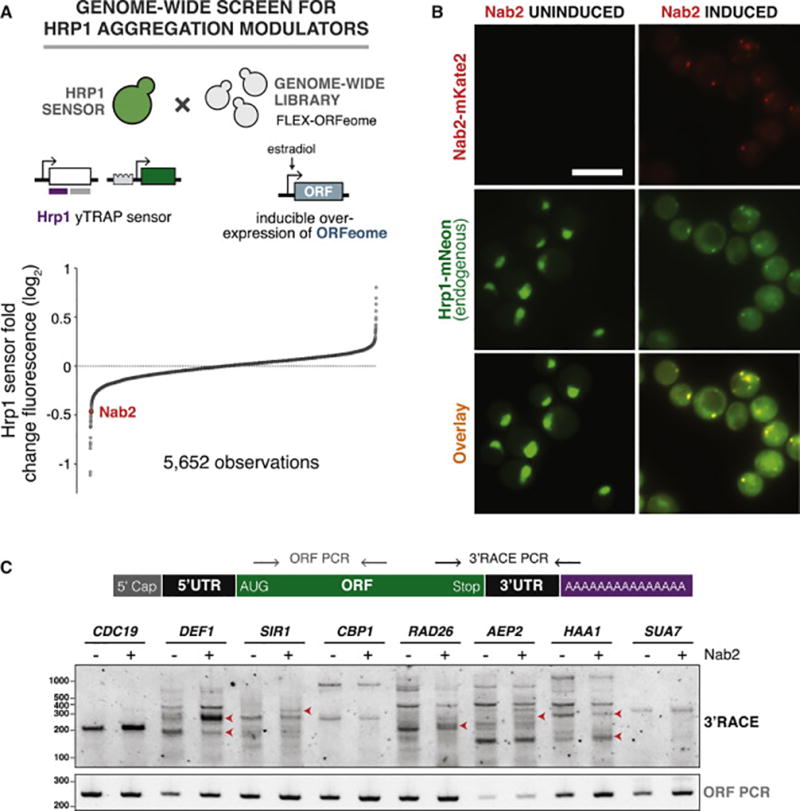
(A) A genome-wide screen for factors that influence Hrp1 aggregation. Top: The Hrp1 yTRAP sensor strain was mated in arrayed format to an inducible library comprised of nearly every yeast ORF. Bottom: Fold-change in Hrp1 yTRAP signal following induction of each ORF, ranked from lowest to highest.
(B) Microscopy of endogenous Hrp1 with (right) and without (left) Nab2 overexpression. Top: Nab2-mKate is visualized in the red fluorescent channel. Middle: Endogenous Hrp1 was tagged with mNeonGreen and visualized in the green fluorescent channel. Bottom: Green and red channels overlay. Uninduced and induced fluorescent images were identically contrast-scaled. Scale bar=10 µm.
(C) The effect of Nab2 overexpression on 3’ cleavage of selected mRNAs. Top: Primers were designed to amplify from the end of each ORF to the start of the polyA tail, amplifying the entire 3’ UTR. A control primer pair amplified a 250 base pair region inside the ORF. Bottom: Agarose gel electrophoresis of PCR reactions from strains with or without Nab2 overexpression. New bands or altered band intensities are marked with red arrows.
We subsequently validated hits that we identified as reducing the Hrp1 yTRAP signal by more than three standard deviations (Figures S7A–C and Table S3). Nab2 emerged as the most potent inducer of Hrp1 aggregation that also caused no change in total levels of Hrp1 (Figures S7B and S7C). Fluorescence microscopy of overexpressed Nab2-mKate2 and endogenous Hrp1 (tagged with mNeonGreen) showed strong aggregation and co-localization of both proteins (Figure 7B). In contrast to the toxicity of Hrp1 aggregation induced by its own overexpression (Figure S6D), Nab2 overexpression led to non-toxic Hrp1 aggregation (Figure S7D). This effect is specific for Hrp1 and Nab2 overexpression had no effect on two physical interactors of Hrp1 in the CPF complex, Rna14 and Rna15 (Figure S7E).
Hrp1 binds UA-rich elements in transcribed mRNAs and aids in orienting the CPF complex to proper mRNA cleavage/polyA sites. We therefore predicted that Nab2-induced aggregation of Hrp1 could affect its function and cause an alteration in 3’ mRNA cleavage sites, and thus their 3’ UTR lengths. To test this prediction, we chose eight genes that have been reported to generate transcripts harboring variable 3’ UTRs (Sparks et al., 1997; Yoon and Brem, 2010) and assessed their 3’ UTR length with and without Nab2 overexpression. Indeed, five of these transcripts had differential cleavage patterns (Figure 7C). These results suggest that Nab2 overexpression can sequester Hrp1 and lead to a change in its activity.
DISCUSSION
yTRAP: a genetic, high-throughput tool for protein aggregation
We have developed a modular, genetic tool that enables quantitative monitoring of cellular aggregates. yTRAP represents a significant advance over existing methods to assay protein aggregates on account of its simplicity, sensitivity, speed, and low cost. A key advantage is the capability to design high-throughput screens on protein aggregation phenomena. As we demonstrated, there are many possible modes of screening. Large panels of sensors can be generated to screen for aggregation or solubilization in response to genetic or other perturbations; alternatively, one can screen the effects of entire genomes on the aggregation of individual sensors. We envision these studies could be further scaled up to screen large libraries of yTRAP sensors against large libraries of genetic or chemical perturbations. In this manner, networks of aggregation and assembly interactions can be mapped out to give a comprehensive view of the cellular “aggregome”.
yTRAP features a synthetic biology design that couples protein solubility to transcriptional activity. This excludes certain proteins, such as integral membrane proteins, from compatibility with the current system. Yet, an advantage of the modular design is that it enables a standard framework for all aggregation events, circumventing the need to construct novel assays for each protein of interest. Outputs can be customized with desired genetic or enzyme-based reporters. yTRAP functionality does not rely on genetic background, specific growth media, or additional reagents. Moreover, yTRAP is an in vivo tool and so does not introduce artifacts associated with lysis or reconstitution of components out of a cellular context. Finally, the orthogonal components of yTRAP should be readily portable to cells of other species. We envision that the generation of transgenic animals containing yTRAP sensors will eventually enable the detection and tracking of aggregation in live animal models.
Probing yeast prions and modulating prion switching
Prion-like mechanisms serve diverse cellular functions in many organisms (Newby and Lindquist, 2013). We used yTRAP to study yeast prions and uncovered several new insights. First, we constructed the first hyper-inducing prion fusion that is able to convert the each cell to the prion state after transient induction. This demonstrates that prion nucleation can be deterministically controlled. As more prion-like elements continue to be discovered, it will be interesting to see whether there exists any similar cross-seeding behavior that may act as natural mechanisms for cellular memory. Second, by screening large libraries of random mutants, we identified many prion-curing alleles that are able to cure wild type prions in trans. Third, we found that a naturally-occurring RNQ1 allele, Δ288–298 (Resende et al., 2003), can remodel the wild type prion after transient exposure. This “protein conformation recombination” process could occur in nature to generate additional phenotypic diversity and enhance adaptation in yeast. Similar processes could be at work in humans as well – a natural allele of the human prion protein, PRNP, appears to be protective against prions and grants immunity to prion disease in mice (Asante et al., 2015). It will be exciting to test more broadly how various alleles and even separate protein components of prion-like assemblies affect their conformations.
Probing the RNA-binding protein aggregome
The speed and ease with which quantitative data can be collected using yTRAP combined with genetic screens in yeast makes it an unparalleled platform for discovery in both pathological and functional aggregation. A disproportionately high number of RBPs in the yeast and human genome contain low complexity domains that resemble the amyloid forming regions of prions (March et al., 2016). The functions and interactions of these low complexity domains have remained mysterious. Mutations in low complexity sequences have emerged as causal factors in neurodegenerative diseases including ALS and MSP (Harrison and Shorter, 2017). Recently, several ground-breaking papers have demonstrated that these low complexity domains function in phase transitions or liquid-liquid phase separations in the cell (Kroschwald et al., 2015; Riback et al., 2017).
We are only beginning to understand the difference between functional aggregation and its harmful counterpart. This is partly because we lacked quantitative in vivo assays of aggregation. Herein we demonstrated that yTRAP can serve as a platform for deciphering aspects of this biology. We performed an unbiased screen for RBP aggregation propensity. The top hit was Hrp1, the homolog of hnRNPA1 in humans for which aggregation is associated with MSP and ALS. Both hnRNPA1 and Hrp1 harbor tandem RNA recognition motifs followed by a low complexity region and a PY (Pro-Tyr) nuclear import sequence. Additionally, both of these proteins shuttle in and out of the nucleus and aggregate almost exclusively in the cytoplasm, similar to other disease-causing RBPs, such as TDP-43 and FUS (Harrison and Shorter, 2017). Furthermore, pathogenic mutations have been identified in the low complexity regions and nuclear localization sequences for both TDP-43 and FUS. Thus, Hrp1 may resemble its human homologs not only functionally, but also in its mode of aggregation and toxicity.
We used several yTRAP screening techniques to interrogate Hrp1 interactions. We examined the consequences of Hrp1 overexpression across the RBP yTRAP library and found that proteins involved in ribosome biogenesis (Nsr1, Nop58, Cbf5) became aggregated. This could be indicative of natural cross-talk or co-assembly of these proteins with Hrp1 as part of their normal function or regulation. The same screening methodology can be applied to any aggregation-prone protein of interest to identify putative interaction partners. We also performed a genome-wide overexpression screen to identify genes that could modulate Hrp1 aggregation. We observed that Nab2 can induce Hrp1 aggregation in a non-toxic manner with biological consequences, causing alterations in mRNA cleavage. Considering that these altered processing events elicited no growth defects, an interesting possibility to consider is that Nab2-induced Hrp1 aggregation occurs naturally to regulate its activity and lead to a different set of 3’ UTR processing sites.
yTRAP and prion synthetic biology
In addition to facilitating new studies and screens for protein aggregation, we propose yTRAP as a platform for synthetic biology, enabling programmable cellular devices to be constructed using prions. To demonstrate this capability, we produced two types of prion-based devices: a synthetic memory device and anti-prion drives.
We demonstrated that a yeast cell can produce and store the memory of heat. Prions have a number of advantages over existing synthetic methods to store information in cells. Their background switching rate can be very low – without overexpression, the spontaneous induction of the [PSI+] prion is approximately 10−7 (Lancaster et al., 2010), on the order of DNA mutations, allowing for high-fidelity storage of information. Furthermore, prion domains can be designed de novo (Toombs et al., 2012), allowing for the potential expansion to many orthogonal prion memories. yTRAP screens could assist in the selection of multiple orthogonal prion domains and specific prion-switching genes. Using dual or further multiplexed yTRAP, a different function could be assigned to each prion switch. This could allow for a rapid expansion in available tools for the construction of complex cellular devices. The input could be reprogrammed using promoter-based logic to detect other desired stimuli, for example environmental contaminants. The output of yTRAP is also fully programmable – any gene could be used to report on the prion-encoded memory.
Anti-prion drives are capable of regulating and curing prion propagation in wild type populations. Just as gene drives bias the inheritance of DNA so that the drive itself is inherited at an increased frequency (DiCarlo et al., 2015), phenotypic drives increase the rate at which a phenotype is inherited by progeny. Yeast prions inherently act as phenotypic drives, converting other proteins of the same kind to their own self-templating conformation and being inherited by all meiotic progeny. The diverse phenotypes conferred by microbial prions could be controlled using anti-prion drives. As more prions are discovered and designed de novo, the toolkit of synthetic biology components will grow.
Concluding remarks
It is becoming increasingly clear that protein aggregation plays key roles in cellular processes, as wide ranging as disease initiation and progression, signaling, and evolution. yTRAP serves both as a means for engineering new tools and a platform for discovery in natural aggregation phenomena.
STAR METHODS
Contact for Reagent and Resource Sharing
Further information and requests for resources and reagents should be directed to and will be fulfilled by the Lead Contact, Ahmad Khalil (khalil@bu.edu).
Experimental Model and Subject Details
Saccharomyces cerevisiae strains used in this study are described in Table S5. Unless otherwise stated, strains were grown with shaking at 30°C in standard growth media. YPD was 1% yeast extract, 2% peptone, 2% glucose. Complete supplement mixture (CSM) media and CSM drop out media was purchased from Sunrise Science Products and made up as per their instructions, supplemented with 6.7g/L yeast nitrogen base and 2% glucose unless otherwise stated.
Method Details
Cloning and vector construction
Plasmids used in this study are listed in Table S4. The basic yTRAP plasmid pGAN147 was constructed by PCR and subsequent Gibson assembly of components into pDML112 (Landgraf et al., 2016) (Figure S1A). Gateway cloning was used to insert genes-of-interest into pGAN147 to form yTRAP fusions. Gateway cloning was also used to insert genes, such as mutant prion-curing alleles, into pAG-series vectors (Alberti et al., 2007) and their derivatives.
Reverse-yTRAP and dual yTRAP plasmids were constructed with standard cloning techniques and Gibson assembly. Reverse-yTRAP required a TetR-repressible promoter (Figure S2A). To obtain a suitable promoter, we generated and screened a small panel of nine variant promoters. Each variant was created by inserting tetO2 sites at the vicinity of promoter control elements such as TATA-box, transcription factor binding sites and the transcriptional start site of the S. cerevisiae ADH1 promoter. [RNQ+] and [rnq−] yeast strains carrying the tetR-mKate2 yTRAP circuit (pGAN230) were used to screen this panel, and the promoter with the greatest dynamic range was selected for use (pSK221).
To enable dual yTRAP, we constructed a second yTRAP sensor plasmid using a second engineered zinc finger and its paired DNA binding site (Khalil et al., 2012) (Figure S2C). This second plasmid was generated from pGAN147, exchanging sites of homology from the HO locus to the LEU2 locus to re-target the integration, and NATr resistance for KanMX.
Prion-inducing fusions were generated by PCR and subsequent Gibson assembly into the estradiol-inducible plasmid pHES835 (Aranda-Díaz et al., 2016). pJMB101 harbors the estradiol-responsive transcription factor composed of the chimeric ZEM regulator (Zif268 - Estradiol Receptor ligand binding domain - Msn2 activation domain) (Aranda-Diaz et al., 2017). For heat-inducible expression, the estradiol-responsive promoter was swapped for the SSA4 promoter by standard cloning techniques.
RBP yTRAP sensors were constructed using Gateway cloning. Individual plasmids were prepared from the yeast MORF collection (movable ORF; GE Dharmacon, Cat# YSC3867) and cloned into the yTRAP destination plasmid pGAN147. The 48 genes that were not available in the MORF collection were amplified from the yeast genome by PCR and cloned separately.
Estradiol-inducible Hrp1 was constructed using pHES835 as above and induced using the ZEM regulator. To induce the GAL1 promoter using estradiol, as was done for the aggregation propensity screen and genome-wide screen for modulators of Hrp1 aggregation, the GEM regulator (Gal4 DNA binding domain - Estradiol Receptor ligand binding domain - Msn2 activation domain) was used instead (Aranda-Diaz et al., 2017).
Yeast strains and growth conditions
Yeast strains used in this study were primarily derived from YJW508 (MATα, leu2-3,112; his3-11,-15; trp1-1; ura3-1; ade1-14; can1-100; [PSI+]; [RNQ+]), YJW584 (MATa, leu2-3,112; his3-11,-15; trp1-1; ura3-1; ade1-14; can1-100; [psi−]; [RNQ+]) (Osherovich and Weissman, 2001), and standard laboratory W303 (MATα, leu2-3,112; his3-11,-15; trp1-1; ura3-1; ade2-1; can1-100; [psi−]; [RNQ+]). A complete list of strains generated in this study is shown in Table S5. Growth media was complete supplement mixture (CSM) media or CSM lacking certain amino acids with either 2% glucose, 2% galactose, 2% raffinose, or 2% glycerol supplemented as the carbon source (glucose was used unless otherwise specified below). YPD plates used for prion curing contained 5 mM guanidine hydrochloride. Media was supplemented with 50 µg/mL adenine hemisulfate (Sigma Aldrich, A9126) to eliminate the color of ade- cells, which otherwise interferes with fluorescence readings. Yeast transformations were conducted using a lithium acetate competent cell protocol as previously described (Knop et al., 1999).
The construction of variant [PSI+] strains in W303, [PSI+] in 74D-694 (MATa ade1-14 leu2-3,112 ura3-52 trp1-289 his3-200) (Chernoff et al., 1995), and [PSI+] in 10B-H49a (MATa ade2-1 SUQ5 lys1-1 his3-11,15 leu1 kar1-1 ura3::KANMX) (Kochneva-Pervukhova et al., 1998), which were used to characterize the sensor, was done as follows: Strains were cured of all prions by passing cells on rich media containing 5 mM guanidine hydrochloride. Prion loss was verified by mating strains to [psi−] tester strains carrying a copper-inducible Sup35NM-GFP plasmid. Diploids containing diffuse fluorescence after a four-hour incubation with 50 µM CUSO4 verified that the original strains did not contain [PSI+]. Prion variants were introduced into recipient strains through cytoduction. To generate cytoductants, the above recipient strains were made rho0 by streaking cells on rich media containing 10 µg/ml ethidium bromide and verified by no growth on glycerol-containing media. Recipient strains were mated in excess to the donor strain (C10B-H49a: Matα SUQ5 ade2-1 lys1-1 his3-11,15 leu1 kar1-1 cyhR) (Kochneva-Pervukhova et al., 1998) that contained the appropriate prion variant and a defective kar1 allele, which inhibits nuclear fusion. Cytoductants were distinguished from donor or diploids by the presence of auxotrophic markers, ability to mate to MATa strains, and growth on media containing glycerol as the sole carbon source. The presence of [PSI+] or [RNQ+] were confirmed by the presence of cytoplasmic aggregates using tester strains. The [PSI+] strains were also confirmed to display a change in color on rich media and grow on SD-Ade media.
Endogenous tagging of yeast genes with mNeonGreen was achieved by homologous recombination with long homology regions (~300 bp) generated by PCR, as previously described (Landgraf et al., 2016). mNeonGreen was amplified with a NAT resistance cassette and assembly PCR was used to add the relevant homology regions at the terminus before transformation. Proper integration was confirmed by colony PCR.
Flow cytometry
Cells were diluted 100-fold from overnight cultures in CSM media into fresh media, and incubated 6 hours at 30°C to reach exponential growth before measurement. Unless otherwise stated, 10,000 – 50,000 events were acquired using a MACSQuant VYB cytometer with a 96-well plate platform (Miltenyi Biotech), and data was processed using FlowJo. Events were gated by forward and side scatter, and median fluorescence values were calculated. In order to exclude dead cells from analysis, 10 ug/mL propidium iodide (Sigma Aldrich Cat. No. P4864) or 1 ug/mL DAPI (Roche Diagnostics Cat. No. 10236276001) stain was used. The B1 channel (525/50 filter) was used to measure green fluorescence. The Y3 channel (661/20 filter) was used to measure red fluorescence or propidium iodide stain. The V1 channel (450/50 filter) was used to measure DAPI.
Western blotting and densitometry
1OD unit of log phase cells were collected by centrifugation and protein was extracted with the following TCA extraction method. Cells were resuspended in 1 mL dH2O, followed by the addition of NaOH to a final concentration of 0.25 M and 2-mercaptoethanol to a concentration of 1% (v/v), and were incubated on ice 15 minutes. TCA was added to a concentration of 6.5% (w/v) and samples were incubated a further 10 minutes on ice before centrifugation at 12,000 rcf to collect precipitated protein. Precipitate was dissolved in HU buffer (200 mM Tris HCl pH 6.8, 8 M urea, 5% SDS, 1.5% DTT, bromophenol blue) and incubated at 65°C for approximately one hour.
Samples were separated by SDS-PAGE and transferred to nitrocellulose membranes using the Invitrogen iBlot2 (7-minute transfer). For primary antibodies, Santa Cruz Mouse monoclonal anti-HA (sc-7392) was used to blot against the 6×HA epitope on the synTA. Rabbit polyclonal anti-PGK1 (ABIN568371; antibodies-online.com) was used as a loading control. For fluorescent secondary antibodies, LI-COR IRDye 800CW donkey anti-mouse (product 926-32212) and LI-COR IRDye 680RD donkey anti-rabbit (product 926-68073) were used. Blots were imaged with the LI-COR Odyssey system. Band quantification / densitometry was performed using the Image Studio Lite software.
SDD-AGE
SDD-AGE was adapted from previous protocols (Halfmann and Lindquist, 2008). Saturated 4mL cultures of yeast grown in YPD were centrifuged and resuspended in 250 µL of lysis buffer (100mM Tris pH 8.0, 20mM NaCl, 10mM beta-mercaptoethanol, 1:50 diluted protease inhibitors (Fisher xyz), 0.025 units/µL benzonase). Approximately 250 µL of acid-washed beads were added, and samples were lysed by bead-beating in a QIAgen sample lyser (10 minutes, 60Hz) using frozen tube holders. Supernatant was collected after a 5 minute centrifugation at 500 rcf, 4°C. 4× sample buffer (2×TAE, 20% glycerol, 8% SDS, bromophenol blue) was diluted 4-fold into lysate, incubated at room temperature for 4 minutes, and loaded into SDD-AGE gels (1.5% agarose, 1× TAE, 0.1% SDS). Gels were run for 4–6 hours at 40 volts, and transferred to nitrocellulose membranes by overnight liquid transfer. Membranes were treated as western blots above. Santa Cruz Mouse monoclonal anti-HA (sc-7392) was used as the primary antibody, and Sigma Aldrich HRP-conjugated rabbit anti-mouse IgG (A-9044) was used as the secondary antibody.
Agar plate fluorescence photography
Photographs were collected using a Bio-Rad Chemi-Doc MP. Colonies were grown for 2 days at 30°C on agar yeast CSM plates and imaged on the second day. For green fluorescence, the blue LED was used for excitation, and the 530/28 nm filter for emission. For red fluorescence, the green LED was used for excitation, and the 605/50 nm filter for emission. The Bio-Rad Image Lab software was used for false-coloring. Overlays were assembled using the transparency parameter in Adobe Photoshop.
Epifluorescence microscopy
Epifluorescence images of Sup35 yTRAP sensors were taken at 100× magnification (Plan Apo 100× oil objective, NA 1.4) using an Eclipse Ti-E inverted microscope (Nikon Instruments, Inc.). Images were acquired in DIC and in fluorescent (GFP) channels. Filters and light sources were automatically controlled by the supplier’s software (NIS-Elements Advanced Research).
For microscopy on induced / uninduced RBPs the following protocol was used: overnight cultures were diluted into CSM media at OD = 0.1 and grown for 2 hours at 30°C prior to induction with 100 nM estradiol. Induction was continued for at least 4 hours before imaging. Cells were imaged live within ten minutes of their preparation on glass slides. Epifluorescence images were taken at 100× magnification (Plan Apo Lambda 100× oil objective, NA 1.45) using an Eclipse Ti-E inverted microscope and a CCD camera (Andor technology). Bright field (BF) images were collected along with images in green and red fluorescence channels. Images were processed with ImageJ, and linear intensity transformations were set identically for induced and uninduced samples.
Fluorescence plate reader measurements
Measurements were performed using an Infinite M1000 PRO microplate reader (Tecan Group Ltd.). Cells were grown to saturation in CSM media. 200 µL of triplicate saturated cultures were added to clear-bottom, flat, black microtiter plates (Corning Product #3631). Absorbance at 600 nm was collected to measure cell density, raw fluorescence (ex. 488/5 nm, em. 520/5 nm) was collected to measure yTRAP signal, and fluorescence was calculated by normalizing raw fluorescence by absorbance.
Isolation of Swi1, Mot3-PrD, and New1-PrD prion states
Galactose-inducible plasmids for Swi1, Mot3-PrD, and New1-PrD were introduced into sensor strains for the same protein. Cells were grown overnight in CSM ura drop-out media supplemented with galactose to induce expression. Subsequently, cultures were plated on glucose agar plates. Colonies on agar plates were photographed in the green fluorescent channel to assess prion state. Low-fluorescence colonies were picked and streaked for further testing. Colonies were confirmed to contain a prion by streaking on guanidine hydrochloride plates – those that were cured and returned to a bright fluorescent state were [PRION+] switched cells.
Relative aggregation measurement
To measure relative aggregation of Htt-Q25 and Htt-Q103 (Figure S1G), triplicate sensor strains for each protein (yGAN016-017) were diluted 100-fold from overnight CSM media cultures and grown for 6 hours at 30°C. yTRAP signal was measured by flow cytometry. Relative aggregation was calculated as the average of the least-aggregated samples divided by each sample: Relative aggregation = (average Htt-Q25 yTRAP signal) / (yTRAP signal).
To measure relative aggregation of Q-/N-rich proteins in response to Htt overexpression (Figure 1E), yTRAP sensor plasmids for these protein domains were transformed into cells containing integrated galactose-inducible Huntingtin exon 1 harboring 103 glutamine residues (Htt-Q103) or into an identical strain lacking Htt-Q103 overexpression constructs (producing yGAN018-029). Triplicate cultures were grown overnight to saturation in CSM media containing raffinose as a carbon source. The following day, each strain was diluted 50-fold into raffinose media and, separately, media containing galactose to induce Htt-Q103. Cells were grown for 6.5 hours at 30°C and then fluorescence was measured by flow cytometry. Aggregation in Htt-Q103-induced samples was calculated by dividing median fluorescence of each strain in raffinose by median fluorescence in galactose. To normalize for the effect of carbon source, the raf/gal ratio of Htt-expressing cells was divided by the raf/gal ratio of control cells, yielding the final relative aggregation value: Relative aggregation = (yTRAP signal of Htt-expressing cells in raffinose / yTRAP signal of Htt-expressing cells in galactose) / (yTRAP signal of no-Htt cells in raffinose / yTRAP signal of no-Htt cells in galactose).
Guanidine-curing time course
The dual PSI / RNQ sensor strain (ySK293) was diluted to OD 0.001 into triplicate 50 mL cultures of CSM media with 5mM guanidine hydrochloride. The zero time point negative control was diluted to OD 0.001 without guanidine hydrochloride. After 12 hours of shaking at 30°C in 500 mL baffled flasks, 50 µL samples were collected from each of the curing flasks and diluted 100-fold into 5 mL of fresh CSM medium lacking guanidine hydrochloride to halt prion curing. Additional samples were collected every two hours until 22 hours after guanidine treatment started. In addition to collecting final, 22-hour samples by dilution into medium lacking guanidine hydrochloride, samples were also diluted 100-fold into fresh media containing 5 mM guanidine hydrochloride to continue curing. The following day, after a total of 36 hours of growth, all samples had grown to stationary phase and were diluted another 100-fold in fresh medium lacking guanidine hydrochloride. After 6 hours of growth, the prion status was assessed by flow cytometry as described above, gating to distinguish populations of prions. One recovered culture that had been treated with guanidine hydrochloride for 16 hours was spread on an agar plate for photography.
Inducing [PSI+] with transient expression of prion fusions
Duplicate colonies harboring estradiol-inducible prion domains and fusions were picked into 500 µL of non-inducing CSM media and grown overnight at 30°C with shaking in a deep-well 96 well plate. Saturated cultures were diluted 100× into 500 µL CSM media with or without 100 nM estradiol. After 24 hours of growth, cultures were centrifuged 5 min at 2000 rcf, and media was beat off. Cultures were resuspended in 500 µL of fresh media, then diluted 100× into non-inducing media and grown 24 hours further. Cultures were then diluted 100-fold and grown 6 hours to reach log phase before measurement by flow cytometry to assess prion state. This allows for 8 to 12 generations of growth in non-inducing conditions, so that only heritable changes in prion state were assessed.
Heat induction and memory experiments
Cultures were grown at 25°C in CSM media. Cultures were pre-screened with flow cytometry for background switching because of leakiness of the SSA4 promoter. Only [psi−] cultures were used in the experiment. Saturated cultures were diluted to OD600 of 0.02 in 96-well PCR plates. Cultures were grown for 4 hours at 25°C, then transferred to an Eppendorf PCR instrument (Mastercycler Pro) incubating a gradient of temperatures for 2 hours. After heat treatment, samples were returned to 25°C for overnight growth. The next day, cultures were diluted 1000× into fresh media and grown 24 hours at 25°C. After this, cultures were diluted 100× further into fresh media and grown 6 hours at 25°C to log phase before flow cytometry measurement as above to assess prion state.
Selection of prion-curing alleles
We used a previously described variomics library (Huang et al., 2013). The mutant libraries for Sup35 and Rnq1 were grown and sporulated in liquid media. To sporulate, diploids were inoculated to a final OD600 of 0.5 in 50mL of sporulation media (1% potassium acetate, 0.005% zinc acetate). They were incubated with shaking for 5 days at 25°C. MATa spores containing the mutant plasmid and chromosomal deletion were selected by growing in liquid media (CSM media -arg-his-leu-ura + 60 ug/mL canavanine + 200 ug/mL G418, supplemented with glucose) for 5 generations. For each step, at least 2 million viable cells were used to maintain 10-fold coverage of the theoretical diversity of 200,000 mutants. The libraries of mutant SUP35 or mutant RNQ1 spores were mated with the respective Sup35 or Rnq1 sensor strains harboring the [PSI+] and [RNQ+] prions. 6 million mutant spores were mixed with 2-fold excess of yTRAP sensor cells to mate. These were plated on YPD agar plates and incubated at 30°C for 16 hours. Cells were then scraped from the plate and collected in dH2O. Aliquots were plated on diploid- and haploid-selective media to determine the mating efficiency. Diploid selective media was CSM media lacking uracil +100 µg/mL nourseothricin + 200 µg/mL G418, supplemented with glucose (nourseothricin selects for the yTRAP sensor, G418 selects for the chromosomal deletion, media lacking uracil selects for the mutant plasmid covering the chromosomal deletion). Haploid selective media was CSM media -his-leu-ura+200 µg/mL G418, supplemented with glucose. Diploid cells containing both the mutant plasmid and the yTRAP sensor were present in larger numbers than haploids containing only the mutant plasmid, so we estimated that mating was greater than 50% efficient. The pool of scraped cells was diluted in diploid-selective media and grown 6 hours to OD 1.0. At this point, cells were diluted 100-fold into diploid-selective media and grown a further 13 hours until FACS sorting (OD ~ 1.0).
FACS sorting was performed using a FACS Aria II (BD Biosciences). The top 0.005% of most fluorescent cells (indicating a non-prion state) were collected (300–400 cells). 5 million – 9 million cells were examined in each pool. After sorting, cells were recovered for 2.5 hours in CSM media lacking ura. 100 µg/mL nourseothricin and 200 µg/mL G418 were then added to maintain selection for diploid cells. Cultures were shaken 2 days at 30°C until reaching saturation. Plasmids were purified from each sample as previously described (Chen et al., 2013). Plasmids were amplified by electroporation into bacteria followed by subsequent miniprep.
Mutant plasmids were retransformed into haploid [PSI+] or [RNQ+] yTRAP sensor strains for a second round of selection. Empty plasmids were also transformed separately to serve as negative controls. Transformants were grown in selective liquid media for 40 hours with intermittent dilution to keep cells from reaching stationary phase, and then subjected to a second FACS sort. Collection gates were set so that all cells from control strains containing empty plasmids would be excluded, and only cells with greater fluorescence were collected. 20,000 cells were collected for both libraries and recovered as before. Plasmids were purified from yeast and transformed into bacteria. 24 clones of each library were prepped and sequenced (Table S1).
Prion-curing by transient expression of mutant alleles
Estradiol-inducible mutant plasmids were transformed into the PSI / RNQ dual-sensor strain yGAN036. The strain also contains a pAG303GPD-Sup35C plasmid, which eliminates toxicity from Sup35NM expression. Estradiol induction was performed as follows: overnight cultures in CSM media lacking uracil were diluted 1000× into CSM media lacking uracil supplemented with 5 nM estradiol. After 24 hours of induction, cultures were measured by flow cytometry to determine effects on solubility during overexpression (Table S1). Cultures were also diluted 1000× into fresh media lacking estradiol to recover and examine heritable effects. After 24 hours of recovery, cultures were diluted 100× into fresh media and grown 6 hours before measurement by flow cytometry (Figure 4B and 4C, Table S1).
The Saccharomyces Genome Database was used to search for known strains that harbor our selected mutant prion-curing alleles in SUP35 and RNQ1. The Rnq1 Δ288–298 mutation was harbored in 4 of the 45 available yeast strains: 217_3, PW5, DBVPG6044, and YJM789.
Anti-prion drive mating, sporulation, and tetrad dissection
Plasmids harboring the ‘drive cassettes’ (pGAN257-261) or wild type controls were transformed into MATa sensor strains for the respective prion (forming yGAN060-064). The anti-PSI drive was derived from a clone with high expression of the drive cassette. Strains used to test the anti-PSI drive strain harbored a constitutive Sup35C construct to prevent toxicity from overexpression of Sup35NM. To test drives, anti-prion drive strains were mated to ‘tester strains’ (yGAN065 for PSI or yGAN066 for RNQ). Mating was conducted by spreading a water-suspended colony of the tester strain onto agar YPD plates and letting it dry. A separate plate with large, spotted colonies of the drive-containing strains was replica plated onto the same YPD plate, and incubated for 6 hours at 30 °C to allow for mating. The YPD plate was then replica plated onto his and leu drop-out agar plates, allowing only diploids to grow. Diploid colonies were streaked once onto the same media, then picked into 5mL pre-sporulation media (20 g/L bacto-peptone, 10 g/L yeast extract, 40 g/L glucose, 100 mg/L adenine hemisulfate) and grown at 30°C overnight.
Overnight cultures in pre-sporulation media were centrifuged and resuspended in 5 mL dH20 to wash. This process was repeated for a total of 3 washes before cells were resuspended in 200 µL of dH20. 50 µL was spotted onto agar SPO plates (1 g/L potassium acetate, 50 µM uracil, 100 µM tryptophan, 50 mg/L leucine, 25 mg/L of every other natural amino acid, 25 mg/L adenine, 2.5 mg/L p-aminobenzoic acid, and 20 g/L agar). Plates were incubated 2 nights at 30°C to sporulate.
Following this incubation, a few mg of cells were picked with a pipet tip and resuspended into enzyme mix (1 M sorbitol, 0.1 M EDTA, 10 mg/mL zymolyase). This was quickly vortexed to mix and left at room temperature 5–10 minutes. A sterile loop was used to streak a line of cells onto an agar YPD plate. Tetrads were dissected using a Singer MSM dissection microscope. Dissected spores were grown 2 days at 30°C and then arrayed into cultures in 96 well plates. Spores were spotted onto CSM media agar plates to image fluorescence, indicative of prion state. They were also spotted on CSM agar plates lacking leucine to determine whether or not each haploid inherited the gene drive cassette (Figure 5B and 5C). Spores were also streaked onto guanidine hydrochloride plates to cure their prions and spotted likewise to compare to uncured cultures. All samples were measured by flow cytometry, only three sets of spores for each sample were spotted and photographed.
Supernatant/pellet fractionation of Rnq1
Supernatant/pellet fractionation and blotting was conducted as previously described for Rnq1 (Bradley et al., 2002). 100 mL YPD cultures were inoculated with overnight yeast cultures to OD 0.1, and grown 6 hours to OD 1.0. Cells were resuspended in 100 µL lysis buffer (50 mM Tris pH8.0, 150 mM NaCl, 0.2% Triton X-100, and Halt protease inhibitors (ThermoFisher Scientific 78430)). 750 µL of lysis buffer / glass bead slurry was added, and cells were vortexed 8 times for 10 seconds each to lyse. Between each vortex cycle, cells were incubated on ice for 2 minutes. Tubes were centrifuged 10 minutes at 10,000 g at 4°C. The supernatant was taken as the total lysate. BCA assays were conducted to determine protein concentration and normalize samples with lysis buffer. 1 mg of protein was added to centrifuge tubes and samples were centrifuged for 30 minutes at 280,000 g at 4°C. The supernatant fraction was collected, and the pellet was resuspended in lysis buffer before loading on an SDS-PAGE gel. Western blots were probed with a polyclonal rabbit antibody against Rnq1 (Bradley et al., 2002) and an anti-rabbit HRP-conjugated secondary antibody (Sigma Aldrich A0545).
Screen of RBP sensor library members for aggregation propensity
Each member of the yTRAP RBP sensor library was transformed with a high copy-number plasmid containing an expression cassette for the same RBP, regulated by the GAL1 promoter. yEHA122, which harbors an integrated estradiol-sensitive transcription factor that binds and activates the GAL1 promoter in the presence of estradiol (from plasmid pEHA840), was mated to each sensor strain. Diploids were selected on agar plates lacking leucine and uracil, supplemented with 100 µg/mL nourseothricin. Colonies were pinned one more time on selective agar plates to purify diploids. Four individual diploid patches were picked for measurement. Each strain was grown to saturation in CSM media lacking uracil to select for the overexpression plasmid. Overnight cultures were diluted 100-fold in fresh media and grown for 3 hours to log phase. Cultures were then split, 50 µL was diluted 1:1 into non-inducing media, and 50 µL diluted 1:1 into inducing media (final estradiol concentration of 100 nM). Cultures were grown for a further 4 hours at 30°C, and measured using flow cytometry as described above. Induced samples were measured immediately following uninduced controls to minimize time delays in measurement.
Screen for aggregation of RBP sensor library during HRP1 overexpression
The HRP1 ORF was cloned into the estradiol-inducible plasmid using Gibson assembly, yielding pEHA655. This plasmid was integrated into the yeast genome to produce yEHA125, which also contains the estradiol-responsive transcription factor ZEM. yEHA125 was mated to the RBP sensor library in 96-well plates and diploids were selected on agar plates lacking leucine and uracil, supplemented with 100 µg/mL nourseothricin. Colonies were re-streaked one more time on selective agar plates to purify diploids. Diploids were picked into CSM media and grown overnight. Cultures were then diluted 100-fold into CSM media supplemented with 100 nM estradiol, or media lacking estradiol as a negative control. After 6 hours of growth and induction at 30°C, cultures were measured using flow cytometry as described above.
Yeast growth curve assays
Cultures were grown independently in 96-well plates overnight, then diluted to an OD of 0.03 in media with or without estradiol. 70 µL of each diluted culture was added to a 384-well plate and measured using a Biotek Epoch2 microplate reader at 30°C. Absorbance at 600nm was collected every 15 minutes to track cell growth.
Genome-wide screen for Hrp1 modulators
The Hrp1 yTRAP sensor strain (yEHA415) was transformed with the estradiol-sensitive transcription factor GEM (pEHA840) to generate yEHA244. This strain was mated in an arrayed format to the yeast Flexgene library (Hu et al., 2007). The Flexgene library consists of yeast strains harboring every ORF under an inducible promoter in a low copy number plasmid (pBY011). All Flexgene strains were grown to log phase in CSM media lacking uracil and mixed 1:1 with a log-phase yEHA244 culture. After 3 hours of incubation at 30°C to allow for mating, 5 µL of the cell mixture was spotted on selective plates lacking leucine and uracil, supplemented with 100 µg/mL nourseothricin. After 2 days of growth the mated library was pinned once again on selective agar plates to purify diploids. After another day of growth, colonies were pinned into selective liquid media lacking leucine and uracil and grown to saturation.
To measure the change in Hrp1 solubility, 4 µL of saturated diploid cultures were diluted into 200 µL of selective media lacking uracil supplemented with 100 nM estradiol and grown for 15 hours at 30°C. After that period, a further 100-fold dilution was made in the same media to continue induction of the library. After 4 more hours of induction, Hoechst 33342 was added to a final concentration of 2 ng/µL to stain dead cells for exclusion. 96-well plates were measured by flow cytometry as described above (6000 events were collected per sample). Results are summarized in Table S3.
Out of a total of 5,737 flow cytometry measurements on library members, 85 readings showed low cell counts indicative of particularly poor growth and were discarded. Of the remaining 5,652 readings, 47 were found to be statistically significant hits falling 3 standard deviations from the mean. 30 of these yielded a drop in yTRAP signal and 17 showed an increase in yTRAP signal. 13 strains showing no significant change in Hrp1 yTRAP signal were used as controls for the immediate secondary validation of hits. These 60 strains were picked freshly from the frozen yeast Flexgene library and mated to the Hrp1 yTRAP sensor strain (to re-test their effect on aggregation) and, separately, to a strain harboring an mNeonGreen tag on its endogenous Hrp1 (to test their effect on total Hrp1 levels). Growth curves were collected for these 60 diploids during induction of the ORF library member in technical quadruplicates (Table S3). Proteins causing severe growth defects upon overexpression or changes in the total levels of Hrp1 were excluded from future analysis. Additionally, proteins with an annotated role in nuclear/cytoplasmic transport were excluded because they were likely false positives that affected yTRAP signal without affecting aggregation.
This left us with 11 proteins that caused a drop in Hrp1 yTRAP sensor signal. These proteins were tagged with mKate2 by Gibson assembly and integrated into the yeast genome under an estradiol-inducible promoter to reduce the noise coming from episomal expression. Three proteins (Sto1, Tfb1, and Yil055c) that increased Hrp1 yTRAP signal upon overexpression were also included in microscopy experiments. These 11 overexpression strains, along with a strain expressing mKate2-only as a control, were mated with the Hrp1 yTRAP sensor strain and strain harboring an mNeonGreen tag on endogenous Hrp1. Diploids were induced for a third round of validation to confirm the effect of the overexpressed protein on Hrp1 yTRAP signal and lack of effect on total levels of Hrp1. Microscopy was conducted on these strains to observe the effect of overexpression of the hits on endogenous Hrp1. This procedure is summarized in Table S3.
3’ UTR PCR (RACE) experiments
Rapid Amplification of cDNA Ends (RACE) was used to detect alterations in mRNA polyadenylation sites in the presence of Nab2 overexpression. A strain harboring estradiol-inducible Nab2-mKate2 (yEHA173) and a control strain harboring estradiol-inducible mKate2 (yEHA188) were grown overnight in CSM media. They were diluted 100-fold into fresh CSM media supplemented with 100 nM estradiol and grown for 6 hours at 30°C. 5 OD units of cells were harvested and frozen in liquid nitrogen. RNA was extracted using the YeaSTAR RNA kit (Zymo Research, Cat# E1004). cDNA was prepared using the SuperScriptIII kit (ThermoFisher Scientific, Cat# 18080051), using dT18NV- as the primer to amplify from the start of polyA tails. 1 µL of cDNA was used in each RACE PCR reaction. Internal control primer pairs were amplified in separate reactions simultaneously.
Quantification and Statistical Analysis
FlowJo was used to extract median fluorescence values from flow cytometry measurements. Microsoft Excel and GraphPad Prism software were used to process data. Statistical details such as N and error calculations are provided in figure legends.
Data and Software Availability
Requests for additional data should be directed to and will be fulfilled by the Lead Contact, Ahmad Khalil (khalil@bu.edu).
Supplementary Material
(A) Schematic of the yTRAP sensor genetic construct. This consists of (1) a yTRAP fusion between a gene-of-interest (GOI) and a synthetic zinc finger (ZF)-based transcriptional activator (ZF-43-8) (Khalil et al., 2012), and (2) a reporter harboring 8× ZF binding sites upstream of a minimal promoter driving the expression of a mNeonGreen reporter gene. This plasmid is integrated as a single copy into the HO locus of the yeast genome. SV40 NLS, SV40 nuclear localization sequence; VP16, Herpes simplex virus VP16 transcriptional activation domain; PKI NES, protein kinase inhibitor nuclear export sequence; SUP35 term, SUP35 terminator; minCYC1, minimal CYC1 promoter; ADH1 term, ADH1 terminator.
(B) yTRAP reporter output as a function of soluble synTA (no fusion), titrated using an estradiol induction system. Top: Western blot against synTA (green) and a loading control (red). RNQ sensor strains (synTA with fusion to Rnq1) in the [RNQ+] and [rnq−] states were also included for comparison of synTA levels (right lanes). Bottom: The relationship between soluble synTA (no fusion) protein level and yTRAP output, fit by a linear regression (R2 >0.95).
(C) Diverse prions measured by fluorescence plate reader. Top: yTRAP output for prion and non-prion strains containing the Rnq1, Swi1, Mot3-PrD, and New1-PrD yTRAP sensors. Green: Initial non-prion state of the strain after transformation with the yTRAP sensor (W303 is already [RNQ+], no green bar). Gray: [PRION+] strains isolated after overexpression of the prion. Orange: [PRION+] strains cured of the prion by transient guanidine treatment. Bottom: yTRAP outputs of the variant PSI strains (from Figure 1B), which were also cured with guanidine treatment (‘cured’). (n=3, error bars, SD).
(D) Fluorescence micrographs of PSI sensor cells.
(E) Flow cytometry histograms of the PSI sensor in [PSI+] and [psi−] strains of yeast with diverse genetic backgrounds as indicated.
(F) Top: Flow cytometry of the New1-PrD, Swi1, and Mot3-PrD sensors in [PRION+] and [prion−] states. Right: SDD-AGE analysis confirming that the Mot3-PrD yTRAP fusion was converted to an amyloid state in the low-fluorescence population.
(G) Aggregation of polyQ-expanded Htt quantified by yTRAP. Left: Schematic of the Htt-PolyQ yTRAP sensors. Middle: Relative aggregation of Htt-Q25 vs. Htt-Q103 quantified by flow cytometry. Relative aggregation was calculated as the inverse of median fluorescence, normalized to the Htt-Q25 sample (see Materials and Methods). Right: Western blot against the yTRAP fusions (synTA, green; loading control, red).
Hrp1 genome-wide screen results and validation.
Fold-changes of Hrp1 yTRAP signal for each gene are provided as well as a summary of the validation process.
(A) The reverse-yTRAP sensor turns ON in the aggregated state. Top: Schematic of reverse-yTRAP. In the soluble state, the yTRAP fusion drives expression of TetR (fused to mKate2), which represses expression of the mNeonGreen reporter from an engineered, Tet-controlled ADH1 promoter (pADH1). In the aggregated state, TetR is not produced and repression of mNeonGreen is relieved. Bottom: Histograms of red (left) and green (right) fluorescence of [RNQ+] and [rnq−] cells harboring a reverse-yTRAP RNQ sensor.
(B) Schematic of the reverse-yTRAP sensor genetic constructs.
(C) Schematic of the dual sensor genetic constructs. This system has two yTRAP cassettes, each using a distinct, orthogonal synTA / promoter pair (ZF-43-8 and ZF-37-12).
(A) Induction of [PSI+] by the hyper-inducing prion fusion, N-Rnq1-M, confirmed by the red/white assay, in which [psi−] colonies are red and [PSI+] are pink or white. Agar plate of yeast cells harboring estradiol-inducible N-Rnq1-M grown without estradiol (uninduced, left) and with estradiol (induced, right).
(B) Flow cytometry histograms of the PSI sensor output with and without expression of the hyper-inducing fusion N-Rnq1-M in a [psi−] [rnq−] strain.
(C) Flow cytometry histograms of the RNQ sensor output with and without expression of [PSI+]-inducing factors.
Percentage of cells cured of [RNQ+] after overexpression and recovery of the indicated Sup35NM mutant alleles in dual PSI / RNQ sensor strains. Red denotes the allele used in the anti-PSI drive.
(A) Table of dissected tetrads enumerating spores that exhibited the anti-PSI drive phenotype, conferred by either Sup35APD (S17R, Q56R mutant) or wild type Sup35NM control. (APD: anti-prion drive).
(B) Flow cytometry histograms measuring the [PSI+] state of spores produced by the anti-PSI drive and wild type control. Top Left: One set of spores from a single tetrad harboring wild type Sup35NM. Bottom Left: Those same spores after treatment with guanidine to test for further curing. Top Right: One set of spores from a single tetrad harboring the anti-PSI drive. Bottom Right: Those same spores after treatment with guanidine to test for further curing. * denotes spores that inherited the drive cassette (LEU+).
(C) Table of dissected tetrads enumerating spores that exhibited the anti-RNQ drive phenotype, conferred by either Rnq1APD (stop313) or wild type Rnq1 control.
(D) Flow cytometry histograms measuring the [RNQ+] state of spores produced by the anti-RNQ drive and wild type control. Top Left: One set of spores from a single tetrad harboring wild type Rnq1. Bottom Left: Those same spores after treatment with guanidine to test for further curing. Top Right: One set of spores from a single tetrad harboring the anti-RNQ drive. Bottom Right: Those same spores after treatment with guanidine to test for further curing. * denotes spores that inherited the drive cassette (LEU+).
(E) Western blot analysis of supernatant/pellet fractions from anti-[RNQ+] drive spores. Total cell lysate (T), lysate supernatant (S), or pelleted cell lysate (P) were fractionated for each spore and a guanidine-cured control. Rnq1 in its prion state is known to readily pellet, while in the non-prion state it remains in the lysate supernatant (Bradley et al., 2002).
(F) Table of dissected tetrads enumerating spores that exhibited the RNQ remodeling drive phenotype, conferred by Rnq1RD (Δ288–298). (RD: remodeling drive)
(G) Flow cytometry histograms measuring the [RNQ+] state of spores produced by the RNQ remodeling drive, compared to control [RNQ+] (light gray) and [rnq−] (dark gray) strains. * denotes spores that inherited the drive cassette (LEU+).
(A) Fluorescent photographs of the RBP sensor library. Each strain was spotted on an agar plate and grown two days before imaging. Indicated in red boxes are [RNQ+] and [rnq−] controls and a control lacking the yTRAP fusion, harboring only the mNeonGreen reporter cassette (reporter only).
(B) Quality control on a representative set of RBP sensors. Left: Four different colonies were patched onto fresh plates after transformation of each yTRAP plasmid. Photographs of the resulting patches were collected in the green fluorescent channel. Right: Western blots of cell lysate from each colony were conducted against the HA epitope, present on the synTA of the yTRAP fusion. Ponceau S stain was used as a loading control (bottom). The same process was conducted for every RBP sensor strain (data not shown).
(C) yTRAP fluorescence of RBP sensors during treatment with chaperone inhibitors and subsequent recovery. Each member of the library was subjected to transient genetic inhibition of Hsp104 and Hsp70 via the induction of a dominant-negative allele. Radicicol was used to transiently inhibit Hsp90.
(D) Determination of toxicity during overexpression of Hrp1 or deletion mutants. Yeast growth was measured by absorbance at 600nm every 15 minutes. Top: Growth curves without induction of Hrp1 or indicated mutants. Bottom: Growth curves during overexpression of wild type Hrp1 (red), Hrp1Δ32–146 (light purple), Hrp1Δ332–409 (dark purple), or mKate2 (gray) as a negative control (n=6, error bars, SD).
(E) Microscopy of endogenous Hrp1 with (right) and without (left) Hrp1Δ32–146 overexpression. Top: Black-and-white image of the green fluorescent channel detecting endogenously-tagged Hrp1-mNeonGreen. Bottom: Overlay of green (endogenous Hrp1-mNeonGreen) and red (Hrp1Δ32–146-mKate2) fluorescence channels. Uninduced and induced fluorescent images were identically contrast-scaled. Scale bar = 10 µm.
(F) Analysis of red to green fluorescence channel bleed-through. Ngr1-mKate2 was overexpressed in a strain harboring no other fluorescence construct. Micrographs were collected in red (top) and green (bottom) fluorescence channels to test the extent to which red fluorescence from an overexpressed, aggregating protein bleeds in to the green channel. Scale bar = 10 µm.
(A) Comparison of the expression level of hits following estradiol induction. The top eleven hits that decreased Hrp1 yTRAP signal without altering its steady-state level were tagged with mKate2 and induced with estradiol. Red fluorescence was measured using flow cytometry to determine the total level of induction (n=2, error bars, SD).
(B) Retesting effects of genome-wide screen hits on Hrp1 steady-state levels and yTRAP signal. mKate2-tagged proteins were overexpressed in either Hrp1 yTRAP sensor strains or strains harboring an endogenous Hrp1 mNeonGreen tag. Flow cytometry was used to measure fluorescence before and after induction, and fold-change was calculated. Fold change of the Hrp1 yTRAP sensor is shown in green. Fold change of steady-state levels of Hrp1 is shown in black (n=2, error bars, range).
(C) Flow cytometry on Nab2 overexpression. Red fluorescence generated by Nab2-mKate2 is plotted on the x-axis. Top: Green fluorescence due to an mNeonGreen tag on endogenous Hrp1 is plotted on the y-axis to track changes in steady-state levels of Hrp1. Bottom: Hrp1 yTRAP signal is plotted on the y-axis to track changes in Hrp1 aggregation. Uninduced samples are colored gray. Samples overexpressing Nab2-mKate2 are colored red.
(D) Determination of toxicity when overexpressing Nab2. Yeast growth was measured by absorbance at 600 nm every 15 minutes. Red denotes Nab2-mKate2-expressing cells. Gray denotes mKate2-expressing control cells (n=6, error bars, SD).
(E) Comparing Nab2-induced aggregation of itself and CPF complex members Hrp1, Rna15, and Rna14. Nab2-mKate2 (green) or mKate2 (control, black) was overexpressed in the indicated yTRAP sensor strains. The fold-change in soluble protein measured by flow cytometry on yTRAP signal is plotted (n=3, error bars, SD).
Sup35 and Rnq1 mutations isolated from genetic screen and their activities.
The frequency of appearance for each mutation out of the 24 sequenced clones is noted. Heritable and non-heritable solubilizing effects as detected with yTRAP are annotated.
RBPs selected for yTRAP library construction.
List of genes selected for RBP yTRAP library generation. Each indicated publication found proteins that physically interact with RNA. We produced a yTRAP sensor strain for each gene. Venn diagram is shown to indicate overlap between data sets within the indicated publications.
HIGHLIGHTS.
yTRAP is a platform for in vivo, quantitative analysis of protein aggregation
High-throughput screens uncover mutant prion-curing alleles
Synthetic memory and “anti-prion drives” are engineered with prion-switching tools
Screens reveal aggregation prone RNA-binding proteins and their interactors
Acknowledgments
This work is dedicated to the memory of our dear friend and mentor, Susan Lindquist, without whom this study would not have been possible. We thank Y. Freyzon, G. Karras, A. Amasino, C. McClellan, L. Whitesell, D. Pincus, B. Bevis, L. Clayton, G. Fink, and G. Bushkin along with members of the S.L. and A.S.K. laboratories for materials, discussions, and comments. We thank Prat Thiru and the Whitehead BARC facility for bioinformatics assistance. We thank the Whitehead FACS Facility for FACS support. This work was supported by a NSF Graduate Research Fellowship (to G.A.N), a Boehringer Ingelheim Fonds PhD Fellowship (to S.K.), the Human Frontier Science Program (LT000717/2015-L to E.H.) and EMBO Long Term Fellowship Program (283-2014 to E.H.), a grant from the National Institutes of Health (R01GM056350 to S.W.L.), the G. Harold and Leila Y. Mathers Foundation (to S.L.), the Howard Hughes Medical Institute (to S.L.), and grants from the NSF (CCF-1522074 to A.S.K.) and DARPA (HR0011-15-C-0091 to A.S.K.). A.S.K. was also supported by a NSF CAREER Award (MCB-1350949) and an NIH New Innovator Award (1DP2AI131083-01).
Footnotes
Publisher's Disclaimer: This is a PDF file of an unedited manuscript that has been accepted for publication. As a service to our customers we are providing this early version of the manuscript. The manuscript will undergo copyediting, typesetting, and review of the resulting proof before it is published in its final citable form. Please note that during the production process errors may be discovered which could affect the content, and all legal disclaimers that apply to the journal pertain.
AUTHOR CONTRIBUTIONS
G.A.N., S.K., E.H., S.L., and A.S.K. conceived of the study. G.A.N., E.H., and S.K. performed and analyzed all experiments with the exception of the following: C.K., P.T., C.P.M., and S.C. assisted with the development of yTRAP methodology. C.P.M. assisted with the development of reverse-yTRAP. J.M.B. aided in the development of expression systems. W.R.H. and C.K. developed the Htt-induction system. A.L.M. and S.W.L. generated the [PSI+] prion variant strains. S.L. and A.S.K. oversaw the study. G.A.N., S.K., E.H., and A.S.K. wrote the paper with input from all authors.
References
- Aguzzi A, Lakkaraju AK. Cell Biology of Prions and Prionoids: A Status Report. Trends Cell Biol. 2016;26:40–51. doi: 10.1016/j.tcb.2015.08.007. [DOI] [PubMed] [Google Scholar]
- Alberti S, Gitler AD, Lindquist S. A suite of Gateway cloning vectors for high-throughput genetic analysis in Saccharomyces cerevisiae. Yeast. 2007;24:913–919. doi: 10.1002/yea.1502. [DOI] [PMC free article] [PubMed] [Google Scholar]
- Alberti S, Halfmann R, King O, Kapila A, Lindquist S. A systematic survey identifies prions and illuminates sequence features of prionogenic proteins. Cell. 2009;137:146–158. doi: 10.1016/j.cell.2009.02.044. [DOI] [PMC free article] [PubMed] [Google Scholar]
- Aranda-Diaz A, Mace K, Zuleta I, Harrigan P, El-Samad H. Robust Synthetic Circuits for Two-Dimensional Control of Gene Expression in Yeast. ACS Synth Biol. 2017;6:545–554. doi: 10.1021/acssynbio.6b00251. [DOI] [PMC free article] [PubMed] [Google Scholar]
- Asante EA, Smidak M, Grimshaw A, Houghton R, Tomlinson A, Jeelani A, Jakubcova T, Hamdan S, Richard-Londt A, Linehan JM, et al. A naturally occurring variant of the human prion protein completely prevents prion disease. Nature. 2015;522:478–481. doi: 10.1038/nature14510. [DOI] [PMC free article] [PubMed] [Google Scholar]
- Blancas-Mejia LM, Ramirez-Alvarado M. Systemic amyloidoses. Annu Rev Biochem. 2013;82:745–774. doi: 10.1146/annurev-biochem-072611-130030. [DOI] [PMC free article] [PubMed] [Google Scholar]
- Bradley ME, Edskes HK, Hong JY, Wickner RB, Liebman SW. Interactions among prions and prion "strains" in yeast. PNAS. 2002;99:16392–16399. doi: 10.1073/pnas.152330699. [DOI] [PMC free article] [PubMed] [Google Scholar]
- Cai X, Chen J, Xu H, Liu S, Jiang QX, Halfmann R, Chen ZJ. Prion-like polymerization underlies signal transduction in antiviral immune defense and inflammasome activation. Cell. 2014;156:1207–1222. doi: 10.1016/j.cell.2014.01.063. [DOI] [PMC free article] [PubMed] [Google Scholar]
- Caudron F, Barral Y. A super-assembly of Whi3 encodes memory of deceptive encounters by single cells during yeast courtship. Cell. 2013;155:1244–1257. doi: 10.1016/j.cell.2013.10.046. [DOI] [PubMed] [Google Scholar]
- Chen TF, de Picciotto S, Hackel BJ, Wittrup KD. Engineering fibronectin-based binding proteins by yeast surface display. Methods Enzymol. 2013;523:303–326. doi: 10.1016/B978-0-12-394292-0.00014-X. [DOI] [PubMed] [Google Scholar]
- Chernoff YO, Lindquist SL, Ono B, Inge-Vechtomov SG, Liebman SW. Role of the chaperone protein Hsp104 in propagation of the yeast prion-like factor [psi+] Science. 1995;268:880–884. doi: 10.1126/science.7754373. [DOI] [PubMed] [Google Scholar]
- Choe YJ, Ryu Y, Kim HJ, Seok YJ. Increased [PSI+] appearance by fusion of Rnq1 with the prion domain of Sup35 in Saccharomyces cerevisiae. Eukaryot Cell. 2009;8:968–976. doi: 10.1128/EC.00353-08. [DOI] [PMC free article] [PubMed] [Google Scholar]
- DePace AH, Santoso A, Hillner P, Weissman JS. A critical role for amino-terminal glutamine/asparagine repeats in the formation and propagation of a yeast prion. Cell. 1998;93:1241–1252. doi: 10.1016/s0092-8674(00)81467-1. [DOI] [PubMed] [Google Scholar]
- Derkatch IL, Bradley ME, Masse SV, Zadorsky SP, Polozkov GV, Inge-Vechtomov SG, Liebman SW. Dependence and independence of [PSI(+)] and [PIN(+)]: a two-prion system in yeast? EMBO J. 2000;19:1942–1952. doi: 10.1093/emboj/19.9.1942. [DOI] [PMC free article] [PubMed] [Google Scholar]
- Derkatch IL, Bradley ME, Zhou P, Chernoff YO, Liebman SW. Genetic and environmental factors affecting the de novo appearance of the [PSI+] prion in Saccharomyces cerevisiae. Genetics. 1997;147:507–519. doi: 10.1093/genetics/147.2.507. [DOI] [PMC free article] [PubMed] [Google Scholar]
- DiCarlo JE, Chavez A, Dietz SL, Esvelt KM, Church GM. Safeguarding CRISPR-Cas9 gene drives in yeast. Nat Biotechnol. 2015;33:1250–1255. doi: 10.1038/nbt.3412. [DOI] [PMC free article] [PubMed] [Google Scholar]
- Du Z, Park KW, Yu H, Fan Q, Li L. Newly identified prion linked to the chromatin-remodeling factor Swi1 in Saccharomyces cerevisiae. Nat Genet. 2008;40:460–465. doi: 10.1038/ng.112. [DOI] [PMC free article] [PubMed] [Google Scholar]
- Fowler DM, Koulov AV, Alory-Jost C, Marks MS, Balch WE, Kelly JW. Functional amyloid formation within mammalian tissue. PLoS Biol. 2006;4:e6. doi: 10.1371/journal.pbio.0040006. [DOI] [PMC free article] [PubMed] [Google Scholar]
- Franklin BS, Bossaller L, De Nardo D, Ratter JM, Stutz A, Engels G, Brenker C, Nordhoff M, Mirandola SR, Al-Amoudi A, et al. The adaptor ASC has extracellular and 'prionoid' activities that propagate inflammation. Nat Immunol. 2014;15:727–737. doi: 10.1038/ni.2913. [DOI] [PMC free article] [PubMed] [Google Scholar]
- Gong H, Romanova NV, Allen KD, Chandramowlishwaran P, Gokhale K, Newnam GP, Mieczkowski P, Sherman MY, Chernoff YO. Polyglutamine toxicity is controlled by prion composition and gene dosage in yeast. PLoS Genet. 2012;8:e1002634. doi: 10.1371/journal.pgen.1002634. [DOI] [PMC free article] [PubMed] [Google Scholar]
- Halfmann R, Alberti S, Krishnan R, Lyle N, O'Donnell CW, King OD, Berger B, Pappu RV, Lindquist S. Opposing effects of glutamine and asparagine govern prion formation by intrinsically disordered proteins. Mol Cell. 2011;43:72–84. doi: 10.1016/j.molcel.2011.05.013. [DOI] [PMC free article] [PubMed] [Google Scholar]
- Halfmann R, Jarosz DF, Jones SK, Chang A, Lancaster AK, Lindquist S. Prions are a common mechanism for phenotypic inheritance in wild yeasts. Nature. 2012;482:363–368. doi: 10.1038/nature10875. [DOI] [PMC free article] [PubMed] [Google Scholar]
- Halfmann R, Lindquist S. Screening for amyloid aggregation by Semi-Denaturing Detergent-Agarose Gel Electrophoresis. J Vis Exp. 2008 doi: 10.3791/838. [DOI] [PMC free article] [PubMed] [Google Scholar]
- Han TW, Kato M, Xie S, Wu LC, Mirzaei H, Pei J, Chen M, Xie Y, Allen J, Xiao G, et al. Cell-free formation of RNA granules: bound RNAs identify features and components of cellular assemblies. Cell. 2012;149:768–779. doi: 10.1016/j.cell.2012.04.016. [DOI] [PubMed] [Google Scholar]
- Harrison AF, Shorter J. RNA-binding proteins with prion-like domains in health and disease. Biochem J. 2017;474:1417–1438. doi: 10.1042/BCJ20160499. [DOI] [PMC free article] [PubMed] [Google Scholar]
- Hu Y, Rolfs A, Bhullar B, Murthy TV, Zhu C, Berger MF, Camargo AA, Kelley F, McCarron S, Jepson D, et al. Approaching a complete repository of sequence-verified protein-encoding clones for Saccharomyces cerevisiae. Genome Res. 2007;17:536–543. doi: 10.1101/gr.6037607. [DOI] [PMC free article] [PubMed] [Google Scholar]
- Huang Z, Chen K, Zhang J, Li Y, Wang H, Cui D, Tang J, Liu Y, Shi X, Li W, et al. A functional variomics tool for discovering drug-resistance genes and drug targets. Cell Rep. 2013;3:577–585. doi: 10.1016/j.celrep.2013.01.019. [DOI] [PMC free article] [PubMed] [Google Scholar]
- Kayatekin C, Matlack KE, Hesse WR, Guan Y, Chakrabortee S, Russ J, Wanker EE, Shah JV, Lindquist S. Prion-like proteins sequester and suppress the toxicity of huntingtin exon 1. PNAS. 2014;111:12085–12090. doi: 10.1073/pnas.1412504111. [DOI] [PMC free article] [PubMed] [Google Scholar]
- Khalil AS, Lu TK, Bashor CJ, Ramirez CL, Pyenson NC, Joung JK, Collins JJ. A synthetic biology framework for programming eukaryotic transcription functions. Cell. 2012;150:647–658. doi: 10.1016/j.cell.2012.05.045. [DOI] [PMC free article] [PubMed] [Google Scholar]
- Knop M, Siegers K, Pereira G, Zachariae W, Winsor B, Nasmyth K, Schiebel E. Epitope tagging of yeast genes using a PCR-based strategy: more tags and improved practical routines. Yeast. 1999;15:963–972. doi: 10.1002/(SICI)1097-0061(199907)15:10B<963::AID-YEA399>3.0.CO;2-W. [DOI] [PubMed] [Google Scholar]
- Kochneva-Pervukhova NV, Poznyakovski AI, Smirnov VN, Ter-Avanesyan MD. C-terminal truncation of the Sup35 protein increases the frequency of de novo generation of a prion-based [PSI+] determinant in Saccharomyces cerevisiae. Curr Genet. 1998;34:146–151. doi: 10.1007/s002940050379. [DOI] [PubMed] [Google Scholar]
- Kroschwald S, Maharana S, Mateju D, Malinovska L, Nuske E, Poser I, Richter D, Alberti S. Promiscuous interactions and protein disaggregases determine the material state of stress-inducible RNP granules. Elife. 2015;4:e06807. doi: 10.7554/eLife.06807. [DOI] [PMC free article] [PubMed] [Google Scholar]
- Lancaster AK, Bardill JP, True HL, Masel J. The spontaneous appearance rate of the yeast prion [PSI+] and its implications for the evolution of the evolvability properties of the [PSI+] system. Genetics. 2010;184:393–400. doi: 10.1534/genetics.109.110213. [DOI] [PMC free article] [PubMed] [Google Scholar]
- Landgraf D, Huh D, Hallacli E, Lindquist S. Scarless Gene Tagging with One-Step Transformation and Two-Step Selection in Saccharomyces cerevisiae and Schizosaccharomyces pombe. PLoS One. 2016;11:e0163950. doi: 10.1371/journal.pone.0163950. [DOI] [PMC free article] [PubMed] [Google Scholar]
- Li YR, King OD, Shorter J, Gitler AD. Stress granules as crucibles of ALS pathogenesis. J Cell Biol. 2013;201:361–372. doi: 10.1083/jcb.201302044. [DOI] [PMC free article] [PubMed] [Google Scholar]
- Lopez-Otin C, Blasco MA, Partridge L, Serrano M, Kroemer G. The hallmarks of aging. Cell. 2013;153:1194–1217. doi: 10.1016/j.cell.2013.05.039. [DOI] [PMC free article] [PubMed] [Google Scholar]
- Majumdar A, Cesario WC, White-Grindley E, Jiang H, Ren F, Khan MR, Li L, Choi EM, Kannan K, Guo F, et al. Critical role of amyloid-like oligomers of Drosophila Orb2 in the persistence of memory. Cell. 2012;148:515–529. doi: 10.1016/j.cell.2012.01.004. [DOI] [PubMed] [Google Scholar]
- March ZM, King OD, Shorter J. Prion-like domains as epigenetic regulators, scaffolds for subcellular organization, and drivers of neurodegenerative disease. Brain Res. 2016;1647:9–18. doi: 10.1016/j.brainres.2016.02.037. [DOI] [PMC free article] [PubMed] [Google Scholar]
- Mukherjee A, Morales-Scheihing D, Butler PC, Soto C. Type 2 diabetes as a protein misfolding disease. Trends Mol Med. 2015;21:439–449. doi: 10.1016/j.molmed.2015.04.005. [DOI] [PMC free article] [PubMed] [Google Scholar]
- Newby GA, Lindquist S. Blessings in disguise: biological benefits of prion-like mechanisms. Trends Cell Biol. 2013;23:251–259. doi: 10.1016/j.tcb.2013.01.007. [DOI] [PubMed] [Google Scholar]
- Osherovich LZ, Weissman JS. Multiple Gln/Asn-rich prion domains confer susceptibility to induction of the yeast [PSI(+)] prion. Cell. 2001;106:183–194. doi: 10.1016/s0092-8674(01)00440-8. [DOI] [PubMed] [Google Scholar]
- Park SH, Kukushkin Y, Gupta R, Chen T, Konagai A, Hipp MS, Hayer-Hartl M, Hartl FU. PolyQ proteins interfere with nuclear degradation of cytosolic proteins by sequestering the Sis1p chaperone. Cell. 2013;154:134–145. doi: 10.1016/j.cell.2013.06.003. [DOI] [PubMed] [Google Scholar]
- Protter DS, Parker R. Principles and Properties of Stress Granules. Trends Cell Biol. 2016;26:668–679. doi: 10.1016/j.tcb.2016.05.004. [DOI] [PMC free article] [PubMed] [Google Scholar]
- Resende CG, Outeiro TF, Sands L, Lindquist S, Tuite MF. Prion protein gene polymorphisms in Saccharomyces cerevisiae. Mol Microbiol. 2003;49:1005–1017. doi: 10.1046/j.1365-2958.2003.03608.x. [DOI] [PubMed] [Google Scholar]
- Riback JA, Katanski CD, Kear-Scott JL, Pilipenko EV, Rojek AE, Sosnick TR, Drummond DA. Stress-Triggered Phase Separation Is an Adaptive, Evolutionarily Tuned Response. Cell. 2017;168:1028–1040. e1019. doi: 10.1016/j.cell.2017.02.027. [DOI] [PMC free article] [PubMed] [Google Scholar]
- Sparks KA, Mayer SA, Dieckmann CL. Premature 3'-end formation of CBP1 mRNA results in the downregulation of cytochrome b mRNA during the induction of respiration in Saccharomyces cerevisiae. Mol Cell Biol. 1997;17:4199–4207. doi: 10.1128/mcb.17.8.4199. [DOI] [PMC free article] [PubMed] [Google Scholar]
- Taglialegna A, Lasa I, Valle J. Amyloid Structures as Biofilm Matrix Scaffolds. J Bacteriol. 2016;198:2579–2588. doi: 10.1128/JB.00122-16. [DOI] [PMC free article] [PubMed] [Google Scholar]
- Toombs JA, Petri M, Paul KR, Kan GY, Ben-Hur A, Ross ED. De novo design of synthetic prion domains. PNAS. 2012;109:6519–6524. doi: 10.1073/pnas.1119366109. [DOI] [PMC free article] [PubMed] [Google Scholar]
- True HL, Lindquist SL. A yeast prion provides a mechanism for genetic variation and phenotypic diversity. Nature. 2000;407:477–483. doi: 10.1038/35035005. [DOI] [PubMed] [Google Scholar]
- Wang Y, Meriin AB, Costello CE, Sherman MY. Characterization of proteins associated with polyglutamine aggregates: a novel approach towards isolation of aggregates from protein conformation disorders. Prion. 2007;1:128–135. doi: 10.4161/pri.1.2.4440. [DOI] [PMC free article] [PubMed] [Google Scholar]
- Wickner RB. [URE3] as an altered URE2 protein: evidence for a prion analog in Saccharomyces cerevisiae. Science. 1994;264:566–569. doi: 10.1126/science.7909170. [DOI] [PubMed] [Google Scholar]
- Yoon OK, Brem RB. Noncanonical transcript forms in yeast and their regulation during environmental stress. RNA. 2010;16:1256–1267. doi: 10.1261/rna.2038810. [DOI] [PMC free article] [PubMed] [Google Scholar]
Associated Data
This section collects any data citations, data availability statements, or supplementary materials included in this article.
Supplementary Materials
(A) Schematic of the yTRAP sensor genetic construct. This consists of (1) a yTRAP fusion between a gene-of-interest (GOI) and a synthetic zinc finger (ZF)-based transcriptional activator (ZF-43-8) (Khalil et al., 2012), and (2) a reporter harboring 8× ZF binding sites upstream of a minimal promoter driving the expression of a mNeonGreen reporter gene. This plasmid is integrated as a single copy into the HO locus of the yeast genome. SV40 NLS, SV40 nuclear localization sequence; VP16, Herpes simplex virus VP16 transcriptional activation domain; PKI NES, protein kinase inhibitor nuclear export sequence; SUP35 term, SUP35 terminator; minCYC1, minimal CYC1 promoter; ADH1 term, ADH1 terminator.
(B) yTRAP reporter output as a function of soluble synTA (no fusion), titrated using an estradiol induction system. Top: Western blot against synTA (green) and a loading control (red). RNQ sensor strains (synTA with fusion to Rnq1) in the [RNQ+] and [rnq−] states were also included for comparison of synTA levels (right lanes). Bottom: The relationship between soluble synTA (no fusion) protein level and yTRAP output, fit by a linear regression (R2 >0.95).
(C) Diverse prions measured by fluorescence plate reader. Top: yTRAP output for prion and non-prion strains containing the Rnq1, Swi1, Mot3-PrD, and New1-PrD yTRAP sensors. Green: Initial non-prion state of the strain after transformation with the yTRAP sensor (W303 is already [RNQ+], no green bar). Gray: [PRION+] strains isolated after overexpression of the prion. Orange: [PRION+] strains cured of the prion by transient guanidine treatment. Bottom: yTRAP outputs of the variant PSI strains (from Figure 1B), which were also cured with guanidine treatment (‘cured’). (n=3, error bars, SD).
(D) Fluorescence micrographs of PSI sensor cells.
(E) Flow cytometry histograms of the PSI sensor in [PSI+] and [psi−] strains of yeast with diverse genetic backgrounds as indicated.
(F) Top: Flow cytometry of the New1-PrD, Swi1, and Mot3-PrD sensors in [PRION+] and [prion−] states. Right: SDD-AGE analysis confirming that the Mot3-PrD yTRAP fusion was converted to an amyloid state in the low-fluorescence population.
(G) Aggregation of polyQ-expanded Htt quantified by yTRAP. Left: Schematic of the Htt-PolyQ yTRAP sensors. Middle: Relative aggregation of Htt-Q25 vs. Htt-Q103 quantified by flow cytometry. Relative aggregation was calculated as the inverse of median fluorescence, normalized to the Htt-Q25 sample (see Materials and Methods). Right: Western blot against the yTRAP fusions (synTA, green; loading control, red).
Hrp1 genome-wide screen results and validation.
Fold-changes of Hrp1 yTRAP signal for each gene are provided as well as a summary of the validation process.
(A) The reverse-yTRAP sensor turns ON in the aggregated state. Top: Schematic of reverse-yTRAP. In the soluble state, the yTRAP fusion drives expression of TetR (fused to mKate2), which represses expression of the mNeonGreen reporter from an engineered, Tet-controlled ADH1 promoter (pADH1). In the aggregated state, TetR is not produced and repression of mNeonGreen is relieved. Bottom: Histograms of red (left) and green (right) fluorescence of [RNQ+] and [rnq−] cells harboring a reverse-yTRAP RNQ sensor.
(B) Schematic of the reverse-yTRAP sensor genetic constructs.
(C) Schematic of the dual sensor genetic constructs. This system has two yTRAP cassettes, each using a distinct, orthogonal synTA / promoter pair (ZF-43-8 and ZF-37-12).
(A) Induction of [PSI+] by the hyper-inducing prion fusion, N-Rnq1-M, confirmed by the red/white assay, in which [psi−] colonies are red and [PSI+] are pink or white. Agar plate of yeast cells harboring estradiol-inducible N-Rnq1-M grown without estradiol (uninduced, left) and with estradiol (induced, right).
(B) Flow cytometry histograms of the PSI sensor output with and without expression of the hyper-inducing fusion N-Rnq1-M in a [psi−] [rnq−] strain.
(C) Flow cytometry histograms of the RNQ sensor output with and without expression of [PSI+]-inducing factors.
Percentage of cells cured of [RNQ+] after overexpression and recovery of the indicated Sup35NM mutant alleles in dual PSI / RNQ sensor strains. Red denotes the allele used in the anti-PSI drive.
(A) Table of dissected tetrads enumerating spores that exhibited the anti-PSI drive phenotype, conferred by either Sup35APD (S17R, Q56R mutant) or wild type Sup35NM control. (APD: anti-prion drive).
(B) Flow cytometry histograms measuring the [PSI+] state of spores produced by the anti-PSI drive and wild type control. Top Left: One set of spores from a single tetrad harboring wild type Sup35NM. Bottom Left: Those same spores after treatment with guanidine to test for further curing. Top Right: One set of spores from a single tetrad harboring the anti-PSI drive. Bottom Right: Those same spores after treatment with guanidine to test for further curing. * denotes spores that inherited the drive cassette (LEU+).
(C) Table of dissected tetrads enumerating spores that exhibited the anti-RNQ drive phenotype, conferred by either Rnq1APD (stop313) or wild type Rnq1 control.
(D) Flow cytometry histograms measuring the [RNQ+] state of spores produced by the anti-RNQ drive and wild type control. Top Left: One set of spores from a single tetrad harboring wild type Rnq1. Bottom Left: Those same spores after treatment with guanidine to test for further curing. Top Right: One set of spores from a single tetrad harboring the anti-RNQ drive. Bottom Right: Those same spores after treatment with guanidine to test for further curing. * denotes spores that inherited the drive cassette (LEU+).
(E) Western blot analysis of supernatant/pellet fractions from anti-[RNQ+] drive spores. Total cell lysate (T), lysate supernatant (S), or pelleted cell lysate (P) were fractionated for each spore and a guanidine-cured control. Rnq1 in its prion state is known to readily pellet, while in the non-prion state it remains in the lysate supernatant (Bradley et al., 2002).
(F) Table of dissected tetrads enumerating spores that exhibited the RNQ remodeling drive phenotype, conferred by Rnq1RD (Δ288–298). (RD: remodeling drive)
(G) Flow cytometry histograms measuring the [RNQ+] state of spores produced by the RNQ remodeling drive, compared to control [RNQ+] (light gray) and [rnq−] (dark gray) strains. * denotes spores that inherited the drive cassette (LEU+).
(A) Fluorescent photographs of the RBP sensor library. Each strain was spotted on an agar plate and grown two days before imaging. Indicated in red boxes are [RNQ+] and [rnq−] controls and a control lacking the yTRAP fusion, harboring only the mNeonGreen reporter cassette (reporter only).
(B) Quality control on a representative set of RBP sensors. Left: Four different colonies were patched onto fresh plates after transformation of each yTRAP plasmid. Photographs of the resulting patches were collected in the green fluorescent channel. Right: Western blots of cell lysate from each colony were conducted against the HA epitope, present on the synTA of the yTRAP fusion. Ponceau S stain was used as a loading control (bottom). The same process was conducted for every RBP sensor strain (data not shown).
(C) yTRAP fluorescence of RBP sensors during treatment with chaperone inhibitors and subsequent recovery. Each member of the library was subjected to transient genetic inhibition of Hsp104 and Hsp70 via the induction of a dominant-negative allele. Radicicol was used to transiently inhibit Hsp90.
(D) Determination of toxicity during overexpression of Hrp1 or deletion mutants. Yeast growth was measured by absorbance at 600nm every 15 minutes. Top: Growth curves without induction of Hrp1 or indicated mutants. Bottom: Growth curves during overexpression of wild type Hrp1 (red), Hrp1Δ32–146 (light purple), Hrp1Δ332–409 (dark purple), or mKate2 (gray) as a negative control (n=6, error bars, SD).
(E) Microscopy of endogenous Hrp1 with (right) and without (left) Hrp1Δ32–146 overexpression. Top: Black-and-white image of the green fluorescent channel detecting endogenously-tagged Hrp1-mNeonGreen. Bottom: Overlay of green (endogenous Hrp1-mNeonGreen) and red (Hrp1Δ32–146-mKate2) fluorescence channels. Uninduced and induced fluorescent images were identically contrast-scaled. Scale bar = 10 µm.
(F) Analysis of red to green fluorescence channel bleed-through. Ngr1-mKate2 was overexpressed in a strain harboring no other fluorescence construct. Micrographs were collected in red (top) and green (bottom) fluorescence channels to test the extent to which red fluorescence from an overexpressed, aggregating protein bleeds in to the green channel. Scale bar = 10 µm.
(A) Comparison of the expression level of hits following estradiol induction. The top eleven hits that decreased Hrp1 yTRAP signal without altering its steady-state level were tagged with mKate2 and induced with estradiol. Red fluorescence was measured using flow cytometry to determine the total level of induction (n=2, error bars, SD).
(B) Retesting effects of genome-wide screen hits on Hrp1 steady-state levels and yTRAP signal. mKate2-tagged proteins were overexpressed in either Hrp1 yTRAP sensor strains or strains harboring an endogenous Hrp1 mNeonGreen tag. Flow cytometry was used to measure fluorescence before and after induction, and fold-change was calculated. Fold change of the Hrp1 yTRAP sensor is shown in green. Fold change of steady-state levels of Hrp1 is shown in black (n=2, error bars, range).
(C) Flow cytometry on Nab2 overexpression. Red fluorescence generated by Nab2-mKate2 is plotted on the x-axis. Top: Green fluorescence due to an mNeonGreen tag on endogenous Hrp1 is plotted on the y-axis to track changes in steady-state levels of Hrp1. Bottom: Hrp1 yTRAP signal is plotted on the y-axis to track changes in Hrp1 aggregation. Uninduced samples are colored gray. Samples overexpressing Nab2-mKate2 are colored red.
(D) Determination of toxicity when overexpressing Nab2. Yeast growth was measured by absorbance at 600 nm every 15 minutes. Red denotes Nab2-mKate2-expressing cells. Gray denotes mKate2-expressing control cells (n=6, error bars, SD).
(E) Comparing Nab2-induced aggregation of itself and CPF complex members Hrp1, Rna15, and Rna14. Nab2-mKate2 (green) or mKate2 (control, black) was overexpressed in the indicated yTRAP sensor strains. The fold-change in soluble protein measured by flow cytometry on yTRAP signal is plotted (n=3, error bars, SD).
Sup35 and Rnq1 mutations isolated from genetic screen and their activities.
The frequency of appearance for each mutation out of the 24 sequenced clones is noted. Heritable and non-heritable solubilizing effects as detected with yTRAP are annotated.
RBPs selected for yTRAP library construction.
List of genes selected for RBP yTRAP library generation. Each indicated publication found proteins that physically interact with RNA. We produced a yTRAP sensor strain for each gene. Venn diagram is shown to indicate overlap between data sets within the indicated publications.