

Abstract
Objective
Recent discoveries suggest that it is most likely the coupling of β oscillations (13–30 Hz) and not merely their power that relates to Parkinson disease (PD) pathophysiology.
Methods
We analyzed power and phase amplitude coupling (PAC) in local field potentials (LFP) recorded from Pallidum after placement of deep brain stimulation (DBS) leads in nineteen PD patients and three patients with dystonia.
Results
Within GPi, we identified PAC between phase of β and amplitude of high frequency oscillations (200–300 Hz) and distinct β-low γ (40–80 Hz) PAC both modulated by contralateral movement. Resting β-low γ PAC, also present in dystonia patients, inversely correlated with severity of rigidity and bradykinesia (R=−0.44, P=0.028). These findings were specific to the low β band, suggesting a differential role for the two β sub-bands.
Conclusions
PAC is present across distinct frequency bands within the GPi. Given the presence of low β-low γ PAC in dystonia and the inverse correlation with symptom severity, we propose that this PAC may be a normal pallidal signal.
Significance
This study provides new evidence on the pathophysiological contribution of local pallidal coupling and suggests similar and distinct patterns of coupling within GPi and STN in PD.
Keywords: Parkinson disease, Deep Brain Stimulation, β oscillations, Basal Ganglia, Phase-Amplitude coupling
1. Introduction
β oscillatory activity (13–30 Hz) throughout the basal ganglia-thalamo-cortical (BGTC) motor network has been suggested to contribute to the pathophysiology and serve as a biomarker of Parkinson disease (PD) (Brittain and Brown, 2014; Brown, 2003; Crowell et al., 2012; Eusebio and Brown, 2007; Hammond et al., 2007; de Hemptinne et al., 2015; Kuhn et al., 2009; Little and Brown, 2014; Oswal et al., 2013; Weinberger et al., 2006). STN β power has been shown to be related to severity of rigidity and bradykinesia symptoms and to decrease in proportion to clinical improvement with treatment (Chen et al., 2010; Eusebio et al., 2011; Levy et al., 2002).
While β oscillations have dominated the discussion of the pathophysiology of PD, recent studies suggest that the power of these oscillations may not be as important as their coupling with other neural activity both within or across nodes of the motor BGTC circuit, whether in the form of phase amplitude coupling (PAC), coherence, or phase synchronization (de Hemptinne et al., 2013, 2015; Oswal et al., 2016; Ozkurt et al., 2011; Swann et al., 2015; Weiss et al., 2015; van Wijk et al., 2016; Yang et al., 2014). β-broadband γ PAC in the motor cortex (M1) is exaggerated in patients with PD compared to patients with epilepsy or healthy controls and these coupling patterns change with pathological state (de Hemptinne et al., 2013; Swann et al., 2015). Amplified PAC between β band and high frequency oscillations (HFO: 200–500 Hz) is also observed at the dorsal border of STN, closest to the contact used for deep brain stimulation (DBS) (Yang et al., 2014) and is significantly reduced with dopaminergic medication (Lopez-Azcarate et al., 2010; van Wijk et al., 2016). Therapeutic DBS reduces and nearly eliminates the coupling within M1 motor cortex (de Hemptinne et al., 2015) as does dopaminergic therapy (Swann et al., 2015). Moreover, a recent report shows that STN DBS not only modulates local STN β oscillations, but also suppresses coherence between motor cortices and STN (Oswal et al., 2016). These findings all suggest that pathologic coupling across nodes in the BGTC network may impair normal network function. It is possible that most important and common effect of treatment is to disrupt the exaggerated network coupling (Weiss et al., 2015), enabling greater circuit level computations and “useful” information flow through the motor network thereby alleviating symptoms. Utility of these coupling measures as biomarkers of disease state (be it coherence or PAC) is significantly diminished by their suppression both by movement and therapeutic intervention. Therefore, further investigation is needed to understand movement and therapeutic modulation as well as the clinical correlates of these coupling signals.
In addition to the increased emphasis on interactions between oscillatory signals across the network, there is also emerging evidence suggesting functional separation of β band into discrete “low” (~13–20 Hz) and “high” (~20–30 Hz) sub-bands (van Wijk et al., 2016). Treatment (dopaminergic or STN DBS) preferentially modulates low β signals in the STN (Litvak et al., 2011). Moreover, PAC within the STN is confined to the low β range (low β-HFO) (van Wijk et al., 2016). In contrast to the local role of low β oscillations, inter-regional coupling (e.g., STN-cortex) is most prominent in the high β band and is seemingly more responsive to therapy than low β coherence (Oswal et al., 2013). Considering the β band as a single signal may therefore miss opportunities to differentiate between pathophysiological and normal physiological processes. In other words, while wide-band β may not be suppressed with therapy, analysis of local power and both intra- and cross-site coupling of β sub-bands, particularly those corresponding to the PAC phase-encoding frequency, may provide greater insight into the interactions between these signals.
Despite extensive characterization of oscillatory signals in the STN and M1, oscillatory patterns within GPi have been studied less well. Only recently, a study of local field potentials (LFP) power and PAC in PD and Tourette syndrome identified β-HFO PAC in GPi (Jimenez-Shahed et al., 2016). However, this study only examined very few (four) PD subjects only at rest and did not examine the clinical correlation of the power or coupling. Understanding the clinical correlates of GPi LFP physiology is important as it is a critical node in the BGTC circuit, classically serving as the final common output of the basal ganglia to the thalamus. Moreover, while GPi and STN DBS are both efficacious (Deuschl et al., 2006; Weaver et al., 2009), there are some differences in outcomes, such as medication requirements after DBS (Follett et al., 2010). Distinct underlying physiology and therapeutic mechanisms may be associated with unique clinical effects that depend on the site of network intervention. Therefore, it is important to study local electrophysiological activity within the GPi and in particular comparison with the similar signals from the STN.
Following our overall objective to develop a unified theory of BGTC circuit dynamics that accounts for PD symptomatology, movement, and their inter-relationship, we focus this study on providing a comprehensive characterization of local power and coupling in pallidal signals, their movement modulation, and clinical correlates in a large cohort of PD patients. We began with the hypothesis that similar to the STN, there is a distinction between low and high β bands and that there is β phase encoded PAC within the GPi that is proportional to disease severity. We predict that although transition between rest and movement causes suppression in both β power and local pallidal coupling, it is the coupling and not the power that is related to clinical symptoms and that the degree of movement-related modulation of these signals corresponds to the degree of disease severity.
2. Methods
2.1. Experimental design
2.1.1. Patients and surgical procedure
Nineteen subjects with idiopathic PD undergoing bilateral DBS lead implantation in the globus pallidus, provided informed consent approved by the institutional review board at the University of California, Los Angeles. We simultaneously recorded deep brain LFPs from bilateral pallidum (both GPi and globus pallidus externus (GPe, because of DBS lead trajectory, see Fig 1) during rest and cued left hand movement (finger tapping) while subjects were undergoing awake DBS implantation.
Figure 1. DBS lead and bipolar contact pairs in the Globus pallidus. (A) Gross anatomy of globus pallidus and approximate location of DBS lead.

The DBS lead was targeted to motor (ventral posterolateral) GPi using image-guided targeting, 2–4 mm anterior, 19–24 mm lateral and 4–6 mm inferior to the mid-commissural point and covers the spanning globus pallidus internus (GPi) and globus pallidus externus (GPe). (B–C) Co-registration of post-operative CT scan and Pre-operative T1-weighted structural MRI shows average location of bipolar pairs for the cohort in the standard space (MNI152) and confirms that for both hemispheres contact pair 0–1 (red) is located in the GPi and contact pair 2–3 is located in thhe GPe (blue).
All subjects had a detailed pre-operative clinical evaluation, which included the Unified Parkinson Disease Rating Scale (UPDRS) motor (part III) performed off medication (medications withheld for at least 12 hours). Lateralized UPDRS-III scores were generated by excluding axial scores (i.e. speech, facial expression, neck rigidity, gate and posture, freezing of gate, etc.) and adding all the scores for one body side contralateral to the examined brain side. The lateralized UPDRS III sub-scores utilized for analysis were rest tremor, postural/action tremor, rigidity and limb bradykinesia (finger tapping, hand movement, pronation/supination and leg agility). We also individually evaluated correlations with hemibody scores for rigidity (items 3.3), bradykinesia (items 3.4–8) and tremor (items 3.15–17). All lateralized UPDRS scores are reported in Supplementary Table S1. All patients underwent the surgical procedure in the off medication state: all long-acting and short-acting medications were withdrawn at least 24 hours and 12 hours prior to the surgical procedure, respectively. Propofol was discontinued at least 1 hour prior to all recordings.
All subjects underwent clinical pre- and post-operative imaging. Pre-operative imaging included T1-weighted magnetization prepared rapid acquisition gradient echo (MPRAGE) image (slice thickness = 1 mm, repetition time = 2100 ms, echo time, 2.98 ms, flip angle = 15°, 3T, Siemens Skyra). For implantation, a Leksell stereotactic head frame (Elekta Instruments, Stockholm, Sweden) was applied to the skull and a full head computed tomography (CT) scan was obtained using 0.6 mm slice thickness (Siemens Sensation 64). The DBS lead (Model 3387, 1.27 mm lead body diameter, contact length 1.5mm, inter-contact distance 1.5mm, Medtronic, Inc., Minneapolis MN, USA) was targeted to motor (ventral posterolateral) GPi using image-guided targeting, 2–4 mm anterior, 19–24 mm lateral and 4–6 mm inferior to the mid-commissural point (depending on individual anatomy, Fig. 1A). All trajectories were confirmed with intraoperative microelectrode recordings based on firing activity and kinesthetic tests (Israel and Burchiel, 2004) in addition to awake macrostimulation testing. A detailed description of how the target coordinates for the GPi lead implantation were obtained is provided elsewhere (Tsiokos et al., 2013).
To further confirm the localization of bilateral DBS leads and bipolar signals used for the analysis, post-operative CT scans were spatially registered with pre-operative T1-weighted structural MRI using normalized mutual information criteria and resliced in FSL (Jenkinson et al., 2012; Smith et al., 2004; Woolrich et al., 2009). T1-weighted structural MRI was then registered to a common atlas space (MNI152 T1) using linear and nonlinear registration implemented in FSL (FLIRT/FNIRT) (Andersson et al., 2007). The center point of independent bipolar contact pairs (i.e. 0–1and 2–3) was determined based on the postoperative CT. Exact electrode coordinates were calculated based on the lowest tip of the electrodes, and angle between the electrode trajectory and sagittal and coronal planes according to Medtronic 3387 lead dimensions. Bipolar contacts were then transformed to MNI space and averaged across the cohort of subjects (Fig. 1B), highlighting the localization of 0–1 pairs in GPi and 2–3 pairs in GPe. Harvard-Oxford subcortical atlas was used to identify the pallidum in the MNI space. As GPi and GPe are not separated in the subcortical atlas, to differentiate the two, the globus pallidus internal medullary lamina (visually discernible on the MNI template) was used to distinguish GPi vs GPe recording sites.
2.1.2. Data recording and pre-processing
LFPs were recorded with the lead in final implant position in all subjects using the lead’s four ring electrode contacts (contacts 0, 1, 2 and 3, ventral to dorsal). Signal acquisition was performed using BCI2000 v2 or v3 connected to an amplifier (g.Tec, g.USBamp 2.0) using a sampling rate of 2400 Hz with a 0.1Hz–1000Hz band-pass filter. All patients were right handed and a data glove (5DT data glove 5 Ultra) worn by the patient on the left hand provided concurrent recordings at a slower effective sampling rate which was oversampled at 2400 Hz by BCI2000 using stair step interpolation. Ground and reference contacts were connected to the scalp. Bipolar re-referencing was used for further signal analysis, yielding two bipolar signals to evaluate differences between GPi (bipolar pair 0–1) and more dorsal signals (bipolar pair 2–3, collectively referred to as GPe, since contact 3 reaches to 10.5 mm above target which consistently include GPe). As part of this study, cortical signals were also recorded via an electrocorticographic strip that was introduced subdurally in a posterior direction through the implant burr hole. Given the focus on characterizing pallidal physiology, those signals are not analyzed here.
Subjects were instructed to remain as still as possible while keeping their eyes open during the resting condition. Each subject performed a block-design finger tapping task alternating between 30 seconds blocks of rest and left hand cued finger tapping (maximum amplitude with fastest comfortable speed). A total of 2 30 second blocks each of rest and movement were analyzed in each subject. Up to 6 trials were recorded in each subject. Due to intraoperative constraints, not all subjects were able to complete 6 trials. Also due to noise during recordings, some trials were not usable. We therefore used the first two noise-free trials from each subject in this study.
Signal analysis was performed using custom made scripts in MATLAB (Version 8.6, The Mathworks Inc., Natick, MA) and Fieldtrip toolbox for EEG/MEG-analysis (Oostenveld et al., 2011). Data was separated into rest and movement epochs excluding all the segments containing electrical or unwanted movement artifact using methods previously described (Tsiokos et al., 2013). Removed segments primarily featured power spectra with abnormally high values, excessive harmonics and time series with high rates of voltage change. Data were band pass filtered at 1–500 Hz using a 6th order Butterworth IIR filter (forward and backward to ensure no phase distortion was created during band pass filtering). Line noise (60 Hz) and its harmonics (up to 500 Hz) were removed from the data using notch implemented in fieldtrip toolbox.
2.2. Power Spectral Density and peak estimation
PSD analysis was done using Welch method with one second Hann window tapering and 50% overlap creating a frequency resolution of 1 Hz. Spectral peaks in β range (13–30 Hz) were detected using a peak detection algorithm similar to the method described by (de Solages et al., 2010) as local maxima in the spectral power for each signal. Adjacent peaks in the same spectra had to be separated by at least 4 Hz to be considered separately. All detected peaks were visually inspected to identify potential false positives and negatives. To confirm the accuracy and reliability of the chosen method for peak detection, we note that of the total of 304 PSDs investigated, the peak detection algorithm detected 11 false positives and failed to detect 12 peaks (false negatives) which were corrected manually. In the initial analysis, we seek to identify whether there are distinct low vs high β peaks in the spectra recorded from within the globus pallidus, agnostic to whether the signals were recorded from GPi or GPe. We therefore inspected all available data, including 2 trials from each subject across 2 conditions (Rest and movement), 2 nuclei (GPi/GPe) and 2 brain sides (left and right), resulting in 304 PSD curves for estimation of spectral peaks in β frequency bands.
We used a data-driven approach similar to van Wijk and colleagues (van Wijk et al., 2016) to identify the cut-off frequency between β sub-bands (“low” versus “high”). A histogram of all β band peaks identified in the previous step was created. This histogram showed a bimodal pattern. A mixture of two normal distributions was fitted to the peak histogram using Matlab curve fitting toolbox and the lowest point between the two distributions was used as the boundary between the two β sub-bands. Given the asymmetry of PD and therefore the unique signals that can be seen in each hemisphere, each hemisphere was considered an independent sample in this analysis.
2.3. High Frequency Oscillation Peak Estimation
Peak parameters of HFO (200–300 Hz) were extracted using the Matlab curve fitting toolbox. Our choice of frequency range for pallidal HFO is based on our previous work (Tsiokos et al., 2013). A power law was fit to each spectrum using the 35 – 175 Hz range (excluding line noise frequencies) to reduce the effect of spectral peaks on the model and then subtracted from the spectrum. Smoothing spline technique was used to detect the spectral peak of the resulting data that corresponded to the HFO range. All fitting was verified individually and in cases where a clear peak was not obvious, the fitted curve height was set to zero and the center frequency was ignored. Peak power was then normalized to the total power in the HFO (200–300 Hz) to account for variable baseline power at different contact pairs and also across the population.
2.4. Phase Amplitude Coupling
PAC was estimated using Tort’s method of Modulation Index (MI) (Malekmohammadi et al., 2015; Tort et al., 2010). Parameters selected for PAC analysis have been chosen using those recommended by previous critical analyses of PAC (Aru et al., 2015). Briefly signals were band pass filtered using a two-way least squares FIR filtering (phase: 1 – 35 Hz, in 1 Hz steps and 2 Hz bandwidth; amplitude: 1 – 400 Hz in 2 Hz steps and double the phase-encoding frequency). Hilbert transform was then used to extract instantaneous phase and amplitude of the two components, respectively. Phase values were then binned (18 bins, 20° width) and mean amplitude distribution was calculated relative to the phase bins to create a phase-amplitude histogram. Kullback Leibler (KL) divergence was used to measure deviation of this histogram from uniform distribution and create MI values. In order to extract the preferred phase, the weights of the phase-amplitude histogram were used as amplitudes of a vector, while the center phase of each bin constituted the phase of the vector.
A surrogate data analysis using a shuffling procedure was used to evaluate the significance of derived MI values. For each signal pair we generated 100 temporally shuffled versions of phase signals and calculated MI values for each. The true MI value was converted to a Z-score and the False Discovery Rate (FDR) procedure was used with q = 0.05 to adjust the corresponding p-values and correct for multiple comparisons (Benjamini et al., 2001; Genovese et al., 2002). For each frequency pair with statistically significant PAC, the “preferred phase of coupling” was found as the phase bin with maximal amplitude measurement. The circular mean of the preferred phase was calculated for all the frequency pairs in distinct frequency bands for each patient. Average PAC was calculated for distinct frequency band pairs and used for further statistical analyses across the population. Finally phase and amplitude frequencies involved in maximal PAC were examined across the cohort.
2.5. Kinematic data analysis
Several performance indices were derived from sensor signals, and their validity as quantitative measures of bradykinesia during clinically used finger tapping test was evaluated through comparison with UPDRS finger taps score (Kim et al., 2011). Data glove used in this study consisted of five piezoelectric sensors to measure gross finger movement in each finger, reflecting flexion and extension of fingers during a finger tapping task. We focused our analysis on index finger time series to assess tapping rate (Supplementary Figure S1).
A 4th order zero-phase butterworth filter was used to bandpass filter the data at 1–10 Hz. The frequency range for the band pass filter was determined from inspection of the power spectrum of the index finger data, i.e. the main component of the power spectrum was in 1–4 Hz (no subject had a spectral peak below 1 Hz). The peak power frequency was derived as representative of average tapping rate during finger tapping. The rate of finger tapping was then assessed as a measure of movement speed/intensity and compared against UPDRS finger tapping score through linear correlation. Details of this analysis and results are provided as Supplementary Figure S1 to the main text.
2.6. Statistical Analyses
Statistical analysis was done using R (R Development Core Team, 2011) and SPSS statistical software (Version 23.00; IBM Corp. Armonk, NY). Levene’s test was used to confirm homogeneity of variance when comparing peak frequencies across locations. Independent sample t-test was used to explore significant difference between low and high β peaks between GPi and GPe. Shapiro-Wilk test was used to explore normality of distribution when comparing power (at different frequency bands) and PAC between GPi and GPe. This test was chosen as our sample size is smaller than 50. Once the normality condition was satisfied, paired sample t-test was used. Otherwise, Wilcoxon signed rank test was employed to explore significant difference.
Finally, linear correlations with clinical scores were evaluated with Spearman correlation and corresponding p-values were reported to indicate statistical significant at 0.05 level and corrected for multiple comparisons using Holm’s sequential Bonferroni method (Holm, 1979). Stepwise multiple linear regression was then used to identify which measure of GPi LFP power or coupling was most significantly related to disease severity.
3. Results
The cohort of subjects included three female and sixteen male. Average scores for hemibody (lateralized) rigidity, bradykinesia and total lateralized UPDRS scores are summarized in Table 1.
Table 1.
Summary of demographic and clinical data, OFF mediation, for subjects of study
| N or Mean (± STD) | |
|---|---|
| Subjects | 19 |
| Age | 63.89 (± 9.05) |
| Gender (M/F) | 16/3 |
| Pre-operative total UPDRS III | 38.81 (± 13.08) |
| Pre-operative lateralized UPDRS III | 12.47 (± 4.95) |
| Pre-operative lateralized rigidity scores | 2.91 (± 1.49) |
| Pre-operative lateralized bradykinesia scores | 7.34 (± 3.29) |
| Pre-operative lateralized tremor scores | 1.86 (± 2.04) |
3.1. Separable Low and High β Peaks in GPi and GPe
Fig. 2A illustrates PSDs at GPi and GPe for a single subject during rest and movement. Spectral peaks in β (low and high) and HFO (200–300 Hz) frequencies are evident. Out of all PSDs examined, 22 (7%) did not demonstrate a low β peak and 7 (2%) did not demonstrate a high β peak. To assess the spatial specificity of peak frequencies, we averaged the peak frequencies across the 2 rest trials in each hemisphere separately at GPi and GPe. Subsequently, we created a histogram of these spectral peaks across all subjects during rest (Fig. 2B). We pooled these peaks from GPi and GPe together due to the fact that there were no statistically significant difference between average peak frequencies between GPi and GPe (Related sample Wilcoxon signed-rank test, P=0.21 and 0.49 for low and high β, respectively). Such analysis revealed a clear bimodal distribution (Fig, 2B). After fitting a mixture of two Gaussian curves on the histogram the frequency peaks for two modes of distribution were detected at 14.68±2.20Hz and 24.24±1.88 Hz for low and high β sub-bands respectively. The lowest point between two modes was at 19.72 Hz (downward arrow in Fig. 2B) which we used as the boundary between the two sub-bands for subsequent analyses. Therefore, we used the 13–19.72 Hz range for low β and the 19.72–30 Hz range for high β for all future analyses.
Figure 2. Pallidal power, its spatial distribution and movement modulation.
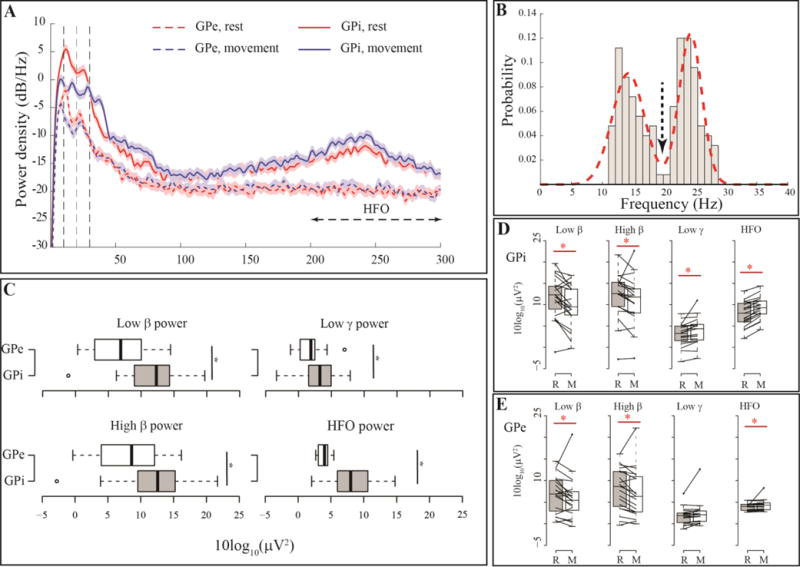
(A) Example PSD at bipolar channels (0–1 and 2–3) for one subject during rest and movemen, showing two prominent spectral peaks in low and high β frequency range. Movement causes β power suppression. (B) Histogram of spectral peaks in β range for all the PSDs investigated from channel pair (0–1) in all subjects. The arrow shows the local minima between two modes of the probability distribution which was selected as the boundary between low and high β sub-bands for further analyses. (C) Boxplots showing band power differences between GPi (0–1) and GPe (2–3) across the cohort, (*) indicates statistically significant difference between the pairs examined. (D–E) Effect of movement on different frequency bands for the 19 GPi (D) and GPe (E) nuclei contralateral to the movement body side.
3.2. Comparison of resting oscillatory power between GPi and GPe
After confirming normality of distributions for average power at different frequency bands (low β, high β, low γ (40–80 Hz), HFO (200–300 Hz)), we used paired sample t-test to compare power between GPi and GPe. We compared 38 samples (per hemisphere) of GPi vs 38 samples of GPe (note that each sample is based on an average of 2 trials). Such analysis revealed that all band powers were significantly greater at GPi with P<0.05 for all four frequency bands examined (Fig. 2C).
3.3. Movement Modulation of Oscillatory Activity in GPi
To characterize movement modulation of LFP power, we analyzed only recordings from the GPi contralateral to limb movement (i.e. right GPi, N = 19, using one sample per subject, representing an average across the two trials per condition). Movement did not significantly change the spectral peak frequencies (related sample Wilcoxon signed rank test, P=0.34 and 0.41 for low and high β respectively). However, it suppressed low β (41.06% median power reduction, P=0.009), and high power (30.89% median power reduction, P=0.004), all tested by related samples Wilcoxon signed rank test, Fig. 2A and 2D). Movement also increased low γ (11.55% median power change P=0.018) and HFO power (5.88% median power change and P=0.018, Fig. 2A and 2D) similarly using related samples Wilcoxon signed rank test. Related Samples Wilcoxon signed rank test on the log power ratio between rest and movement did not identify significant differences between the degree of movement-related power suppression in the low and high β bands (P= 0.12).
3.4. Movement Modulation of Oscillatory Activity in GPe
Similar to section 3.3, we characterized movement modulation of average power at different frequency bands and frequency of spectral peaks at GPe. Wilcoxon signed rank test showed all changes in band powers followed similar trends as GPi and all changes but low γ changes were significant (low β, 25.09% average power reduction and p = 0.006, high β 24.64% average power reduction and p = 0.04, HFO 2.98% median power increase p = 0.0005 and low γ 4.47% power increase and p = 0.1 (Fig. 2E). Similar to the GPi, movement related changes were not significantly different between the low and high β range (Related Samples Wilcoxon signed rank test on the log power ratio, P = 0.69). Comparison of movement related changes in the power between GPi and GPe indicate that only low γ band power movement-related changes were significantly greater in the GPi (corrected P = 0.036).
3.5. Resting Phase-Amplitude Coupling Preferred Frequencies
In this section we investigated all the baseline recordings (2 trials ×1 condition (Rest) × 2 brain sides (left and right) × 2 nuclei (GPi/GPe) × 19 subjects = 152 samples). Akin to our analysis in section 3.1, we made this selection (i.e. including two rest trials per subject) to explore all the data available to us for statistically significant PAC during rest. We emphasize therefore that our objective in this section was merely to explore the prevalence of PAC and the distribution of peak PAC frequencies (given that PAC changes are dynamic over time) and not to perform statistical analyses. Of the 152 resting pallidal recordings examined (GPi and GPe), 148 (97.4%) showed statistically significant PAC between the phase of β and amplitude of low-γ and 135 (88.8%) showed statistically significant PAC between the phase of β and HFO amplitude. Figure 3A shows the PAC maps for one subject during rest (left column) and movement (right column) at GPi (top row) and GPe (bottom row) respectively.
Figure 3. Pallidal PAC, its spatial distribution and movement modulation.

(A) Sample PAC comodulograms for one example subject at GPi (0–1) and GPe (2–3) during rest and movement. White circles show statistically significant regions after correction for multiple comparisons using FDR. (B) Kernel density estimates for distribution of (left) phase encoding and (right) amplitude frequencies for maximal coupling in the β-low γ and β-HFO PAC showing for majority of recordings, peak PAC was observed at low β phase further emphasizing the local role of pallidal low β. (C) boxplots showing β-low γ and β-HFO PAC are stronger at GPi (0–1) relative to the GPe (2–3) (D–E) Movement modulation of pallidal β-low γ and β-HFO PAC in GPi (D) and GPe (E) (N= 19, contralateral to the movement body side). (*) indicates statistically significant difference between the pairs examined.
We averaged two rest trials for each hemisphere and two nuclei (GPi and GPe separately) and characterized the peak PAC frequencies (phase and amplitude) as well as preferred phase of coupling. Wilcoxon signed rank test did not show significant difference between peak PAC frequencies between GPe and GPi. (P > 0.1). Based on this finding, we pooled peak-PAC phase and amplitude frequencies across GPi and GPe for each hemisphere and found that on average, β-low γ PAC was strongest in the low β range (16.83 Hz) and an amplitude encoding frequency of 52.21 Hz (Fig. 3B). Similar analysis for β-HFO PAC revealed strongest coupling at 17.20 Hz (low β) and 249.63 Hz for the phase and amplitude encoding frequencies, respectively (Fig. 3B). Analysis of preferred phase of coupling showed that for all of the coupling patterns investigated, the circular distribution of preferred phase was significantly different from a circular uniform distribution (Rayleigh test, P<0.001). Further analysis also found a significant difference between average preferred phase of coupling between β-low γ (0.29±0.05 radians) and β-HFO PAC (0.43±0.05 radians) within GPi (Wilcoxon signed rank test, P=0.001, Supplementary Figure S2A). The preferred phase of coupling in GPe for β-low γ (GPe: 0.05±0.04 radians) and β-HFO PAC (GPe: 0.18±0.05 radians) was significantly different than that observed in GPi (Supplementary Figure S2A–B, P= 0.005 and P=0.002 respectively).
Analysis of PAC in 3 subjects with dystonia who were implanted with GPi DBS also revealed statistically significant PAC between the phase of β and amplitude of low-γ (Supplementary Figure S2C). Independent sample Mann-Whitney signed rank test showed no significant difference in β-γ PAC at GPi between PD and dystonia patients (P=0.26, Supplementary Figure S2D). However similar analysis showed that β-HFO PAC was significantly larger for PD cohort (P = 0.002, Supplementary Figure S2E).
3.6. Comparison of Resting PAC between GPi and GPe
In this section, we compared resting PAC between GPi and GPe. As we had 19 subjects each with two hemispheres, we compared 38 samples of GPi vs 38 samples of GPe (note that each sample is based on an average of 2 resting trials). Shapiro-Wilk test showed significant deviation of PAC distributions from normal distribution, we therefore used related samples Wilcoxon signed rank test to compare pallidal PAC (in all forms) between GPi and GPe. These analyses revealed that PAC was significantly stronger at GPi compared to GPe (P=0.013, 0.015 and 0.014 for β, low β and high β-low γ PAC and P<0.001 for β, low β and high β-HFO PAC, Fig. 3C). We further explored the difference in preferred phase and peak PAC frequencies (both phase and frequency component) between GPi and GPe. Wilcoxon signed rank test showed no significant difference in peak PAC frequencies between the two nuclei (P>0.1 for all comparisons).
Average spectral beta peaks and maximal PAC frequencies are not different between GPi and GPe (sections 3.1 and 3.5). Comparison of preferred phase of coupling between the two nuclei (section 3.5) however suggested that amplitude frequencies are preferentially coupled with different phases of the phase encoding beta rhythms. We further investigated the possibility that despite a difference in amplitude, β oscillations might be very similar between the two nuclei. Correlation analysis of resting β power, β-low γ PAC, and β-HFO PAC between GPi and GPe revealed that although there is a significant positive correlation exists between GPi and GPe in the resting β power (Pearson correlation, R= 0.64, P<0.001), there is no correlation in resting β-low γ PAC between the two nuclei (Pearson correlation, R=0.26, P=0.12). Similar analysis however showed that resting β-HFO PAC is significantly correlated between GPi and GPe (Pearson correlation, R=0.45, P=0.005). Difference in the preferred phase of coupling and lack of correlation in resting β-low γ PAC between the two nuclei despite correlated resting β power indicates that difference in coupling between GPi and GPe is not merely a reflection of difference baseline power of phase encoding frequency observed at the GPi.
3.7. Movement Modulation of PAC in GPi
Paired sample Wilcoxon signed rank test indicated statistically significant movement-related suppression of GPi PAC for the β-low γ, low β-low γ, low β-HFO, and high β-HFO PAC (P=0.035, 0.012, 0.035, and 0.008 respectively, Fig. 3D). Although β-HFO and high β-low γ PAC appeared to decrease with movement, the movement related suppression did not reach statistical significance (P=0.14 and 0.22, respectively). Related samples Wilcoxon signed rank test showed movement suppressed low β-low γ PAC significantly more than high β-low γ PAC (P=0.02). Similar analysis did not show statistically significant differences between degree of movement related suppression in low β-HFO and high β-HFO PAC (P=0.38).
To delineate the potential effect of movement related β power suppression on PAC suppression, we investigated whether PAC changes correlated with β power changes. Such analysis showed that although β power during rest is significantly correlated with β-low γ and β-HFO PAC (Pearson correlation, R= 0.51, P=0.02 and R=0.56, P=0.01), movement modulation of β power (movement:rest ratio) was not significantly correlated to any of the β-low γ and β-HFO PAC parameters (Pearson correlation, R=0.009, P=0.97, R=−0.13, P=0.61). This finding highlights that movement related suppression of GPi PAC is not solely due to loss of power of phase encoding frequency in the β range.
3.8. Movement Modulation of PAC in GPe
Similar to the GPi, we explored movement related modulation of PAC in the GPe (Fig. 3E). Although GPe PAC did demonstrate some movement-related suppression, paired sample Wilcoxon signed rank test showed none of these changes were statistically significant when corrected for multiple comparisons. (P >0.1 for all forms of PAC, Fig. 3E).
3.9. Clinical correlations
For clinical correlation, we used hemibody UPDRS (including scores for tremor, rigidity and bradykinesia as further indicated in the methods section), based on the knowledge that the two body sides are not equally affected by the disease. Separately for GPi and GPe, we then averaged the values (band power or PAC) between two trials (rest and movement separately) to include only one sample per condition per hemisphere, comparing these with the corresponding contralateral UPDRS hemibody score. Because bilateral resting recordings are available, for resting analyses, N=38. On the other hand, due to only unilateral movement-related recordings, for movement-related analyses, N=19.
We examined clinical correlation with resting power and PAC parameters from GPi and GPe separately. None of the GPe rest parameters were significantly correlated to the lateralized UPDRS scores (Table 2). Figure 4A shows scatter plots for statistically significant correlation with P<0.05 (corrected for multiple comparisons) identifying clinical correlates of resting state GPi. Only low β-low γ PAC and high β-low γ PAC were significantly correlated with hemibody UPDRS scores (Fig. 4A, left column), with subjects with more severe symptoms demonstrating lower pallidal PAC (negative correlation). To investigate whether these parameters were more specifically correlated with rigidity and bradykinesia, we subtracted hemibody tremor scores and re-evaluated the correlation analysis, demonstrating persistent significant correlations (Fig. 4A, right column). Clinical correlation with low β-low γ PAC improved when the tremor scores was removed from lateralized UPDRS suggesting that bradykinesia and rigidity were mainly driving the correlation.
Table 2.
Spearman Correlation between GPe Power, PAC and clinical scores during rest
| Hemi-body UPDRS | Rigidity and Bradykinesia | Tremor | ||
|---|---|---|---|---|
| Low β power | Rho | −0.18 | −0.15 | −0.05 |
| P | 1 | 1 | 1 | |
| High β Power | Rho | −0.09 | −0.14 | −0.02 |
| P | 1 | 1 | 1 | |
| Low γ Power | Rho | −.09 | −0.17 | 0.03 |
| P | 1 | 1 | 1 | |
| Low β-low γ PAC | Rho | −0.28 | −0.19 | −0.1 |
| P | 0.41 | 0.67 | 1 | |
| Low β-HFO PAC | Rho | −0.207 | −0.03 | −0.02 |
| P | 1 | 1 | 1 | |
| High β-low γ PAC | Rho | −0.26 | −0.12 | −0.01 |
| P | 0.6 | 0.8 | 1 | |
| High β-HFO PAC | Rho | −0.18 | −0.12 | −0.12 |
| P | 1 | 1 | 1 |
indicates statistical significance, at α = 0.05, P-Values adjusted for multiple comparisons
Figure 4. Clinical correlates of Pallidal power and PAC during rest and their movement modulation.

(A) Significant clinical correlation during rest between low β-low γ PAC (top row) and high β-low γ PAC (bottom row) and hemibody-UPDRS (left column) and sum of scores for rigidity and bradykinesia (right column) [N = 38]. (B) Significant clinical correlation with movement modulation [movement:rest] between low γ power ratio (top row) and low β-low γ PAC ratio (bottom row) and hemibody-UPDRS (left column) and sum of scores for rigidity and bradykinesia (right column) [N = 19].
Table 3 lists details of correlation analysis for all the GPi parameters examined. Of interest, none of the band power measures showed any significant correlation to the clinical scores.
Table 3.
Spearman Correlation between GPi Power, PAC and clinical scores during rest
| Hemi-body UPDRS | Rigidity and Bradykinesia | Tremor | ||
|---|---|---|---|---|
| Low β power | Rho | −0.19 | −0.16 | −0.08 |
| P | 1 | 1 | 1 | |
| High β Power | Rho | −0.15 | −0.17 | 0.01 |
| P | 1 | 1 | 1 | |
| Low γ Power | Rho | −0.017 | 0.01 | −0.05 |
| P | 1 | 1 | 1 | |
| Low β-low γ PAC | Rho | −0.393 | −0.331 | 0.05 |
| P | 0.035* | 0.04* | 1 | |
| Low β-HFO PAC | Rho | −0.02 | 0.12 | −0.09 |
| P | 1 | 1 | 1 | |
| High β-low γ PAC | Rho | −0.375 | −0.334 | −0.2 |
| P | 0.04* | 0.04* | 1 | |
| High β-HFO PAC | Rho | 0.04 | 0.047 | 0.19 |
| P | 1 | 1 | 1 |
indicates statistical significance, at α = 0.05, P-Values adjusted for multiple comparisons
We subsequently investigated how movement-related changes in the LFP measures (as the ratio of movement to rest) correlated with disease severity. We performed such analysis separately at GPi and GPe. None of the LFP measures at GPe showed significant correlation to clinical scores (Table 4).
Table 4.
Spearman Correlation between movement modulation of GPe Power and PAC with clinical scores
| Hemi-body UPDRS | Rigidity and Bradykinesia | Tremor | ||
|---|---|---|---|---|
| Low β power | Rho | −0.23 | −0.18 | −0.005 |
| P | 1 | 1 | 1 | |
| High β Power | Rho | −0.22 | −0.17 | −0.01 |
| P | 0.76 | 1 | 1 | |
| Low γ Power | Rho | −0.19 | −0.09 | −0.04 |
| P | 1 | 1 | 1 | |
| Low β-low γ PAC | Rho | 0.21 | 0.28 | 0.03 |
| P | 1 | 1 | 1 | |
| Low β-HFO PAC | Rho | −0.11 | −0.06 | 0.09 |
| P | 1 | 1 | 1 | |
| High β-low γ PAC | Rho | 0.00 | 0.028 | −0.05 |
| P | 1 | 1 | 1 | |
| High β-HFO PAC | Rho | 0.14 | 0.02 | −0.03 |
| P | 1 | 1 | 1 |
indicates statistical significance, at α = 0.05, P-Values adjusted for multiple comparisons
Figure 4B (top panel) shows statistically significant correlation of GPi measures and especially between low γ power ratio (movement:rest) and UPDRS scores (left column) and also between those parameters and lateralized scores for rigidity and bradykinesia (right column), indicating that subjects with less severe disease demonstrated greater low γ power movement modulation. We also found positive correlations between low β-low γ PAC ratio (movement:rest) and clinical scores, as shown in Fig. 4B (bottom panel), indicating that subjects with less severe disease suppressed pallidal PAC more despite having more PAC at rest. This result indicates that compared to more severe disease state, less disease severity corresponds to stronger baseline (i.e. resting) low β-low γ PAC while modulating this PAC during movement to a greater extent.
We further investigated low β-low γ PAC during movement. Although starting at different levels during resting state (Fig. 4A), almost all subjects (with one exception) suppressed their pallidal low β-low γ PAC to similar values during movement (Fig. 5). Table 5 summarizes the correlation coefficients for movement related changes in power and PAC measures, indicating no significant correlation between low/high β power movement-related changes and clinical scores.
Figure 5. Pallidal low β-low γ PAC during movement versus hemibody UPDRS.

Subjects with different degrees of disease severity suppress their contralateral low β-low γ PAC during movement to similar values. (Black arrow indicates one outlier subject whose movement low β-low γ PAC was relatively higher than the rest of the cohort and was excluded from the clinical correlation analysis)
Table 5.
Spearman Correlation between movement modulation of GPi Power and PAC with clinical scores
| Hemi-body UPDRS | Rigidity and Bradykinesia | Tremor | ||
|---|---|---|---|---|
| Low β power | Rho | 0.2 | 0.23 | 0.05 |
| P | 1 | 1 | 1 | |
| High β Power | Rho | 0.13 | 0.23 | −0.018 |
| P | 1 | 1 | 1 | |
| Low γ Power | Rho | −0.51 | −0.41 | −0.02 |
| P | 0.04* | 0.045* | 1 | |
| Low β-low γ PAC | Rho | 0.52 | 0.39 | 0.13 |
| P | 0.04* | 0.044* | 1 | |
| Low β-HFO PAC | Rho | 0.16 | 0.04 | 0.15 |
| P | 1 | 1 | 1 | |
| High β-low γ PAC | Rho | 0.34 | 0.38 | 0.01 |
| P | 0.42 | 0.34 | 1 | |
| High β-HFO PAC | Rho | 0.19 | 0.12 | −0.05 |
| P | 0.8 | 0.9 | 1 |
indicates statistical significance, at α = 0.05, P-Values adjusted for multiple comparisons
We used stepwise multiple linear regressions to evaluate relative importance of various power and PAC parameters with respect to clinical scores. Since none of the GPe measurements showed significant correlation tot the clinical scores, we only used GPi measurements for this analysis. After inspection of independent variables for collinearity, we found statistically significant positive correlation between low β-low γ PAC and high β-low γ PAC during rest (R=0.73, P=0.001). No other collinearities were identified. Therefore, we ran the stepwise linear regression using only low β-low γ PAC at rest, low γ power ratio and low β-low γ PAC ratio as independent variables. Stepwise multiple linear regression revealed a model using only low β-low γ PAC at rest as the best model explaining 41.5% (R2 = 0.415) of the variability in clinical scores (F=9.92, P=0.007, P-values for excluded variables were 0.085 and 0.086 for low γ power ratio and low β-low γ PAC ratio, respectively).
Finally, kinematic measures of movement were analyzed in the form of “tapping rate”. We explored the correlation between tapping rate, as a measure of bradykinesia with resting power and PAC from GPi and GPe. None of the correlations were found to be statistically significant (P>0.1). Hemibody rigidity and bradykinesia scores, explored in this section, are in fact combination of clinical examination done in lower and upper extremity and such lack of significant correlation between tapping rate and LFP measures, may be due to “tapping rate” not effectively and accurately representing the total bradykinesia score.
4. Discussion
The role of neural oscillations in PD has been extensively characterized, with a particular focus on β oscillations and their relationship to rigidity and bradykinesia. Recent reports in the literature suggest that coupling and not merely the power of β oscillations may be an important underpinning of PD pathophysiology (de Hemptinne et al., 2015; Swann et al., 2015; Wang et al., 2016). So far, the literature has been largely focused on analysis of STN and motor cortical LFPs. In this report, we advance our understanding of motor BGTC circuitry by not only confirming a functional distinction between low and high β sub-bands in GPi, but also by characterizing resting and movement-related modulation of GPi LFP in nineteen subjects with PD. In doing so, we identify the importance of low β and low γ in GPi physiology and, perhaps more importantly low β-low γ PAC as a novel biomarker of symptom severity (rigidity and bradykinesia) which is spatially specific to GPi, the absence of which correlates with symptom severity. Significance of this newly identified low β-low γ PAC is further supported by our observation of similar coupling in the pallidal signals from three dystonia patients.
4.1. The role of low vs high β in BGTC motor circuits
There is emerging evidence of long-distance (i.e., inter-regional) coupling of high β in contrast to the local (intra-regional) role of low β oscillations. Similar to the STN, we found a distinction between low and high β frequencies in the pallidal signals (Litvak et al., 2011; Oswal et al., 2013; van Wijk et al., 2016). Our power spectral analysis revealed a clear bimodal distribution of the peaks into low and high β sub-bands.
Although movement is associated with significant power suppression in both sub-bands, the degree of relative power suppression is stronger in the low β sub-band. This spectral distinction further motivated us to look at the coupling patterns of low and high β oscillations. Our PAC analysis shows that for majority of recordings pallidal coupling (both β –low γ and β-HFO) demonstrates maximal coupling at low β frequencies (Fig. 3B). Moreover, on multivariate analysis, the local coupling (i.e., PAC) of the phase of the low β sub-band and low γ amplitude was the most significant predictor of symptom severity (specifically, bradykinesia and rigidity). While we have not analyzed network level relationships in this study to further characterize the role of high β in long-distance coupling, the current results support a greater intra-regional role of low β as opposed to high β. Of interest, while β power (in all its forms) was suppressed with movement, power in none of the β sub-bands (nor their movement modulation) showed any significant correlation to the hemibody UPDRS scores (tremor, rigidity and bradykinesia) or sum of scores for rigidity and bradykinesia, unlike in studies on the STN, which indicate power to be a biomarker of disease severity (Kuhn et al., 2009; Little and Brown, 2012; Ray et al., 2008).
4.2. Pallidal Phase-Amplitude Coupling: Patterns and Clinical Correlates
Although the presence and movement modulation of β and HFO activity in the GPi have been previously reported by our group (Tsiokos et al., 2013) we report for the first time the presence of pallidal β phase encoded PAC and investigate their correlation to clinical symptoms. The pallidal β-HFO PAC reported here is similar to β-HFO PAC reported in GPi (Jimenez-Shahed et al., 2016) and STN (Lopez-Azcarate et al., 2010; Ozkurt et al., 2011; Yang et al., 2014; van Wijk et al., 2016), suggesting this coupling may be a common mechanism across subcortical nodes in the BGTC circuit. In contrast to motor cortical β-broadband γ PAC (de Hemptinne et al., 2013; de Hemptinne et al., 2015), in the STN and GPi, the amplitude encoding HFO frequency is band-limited (generally between 200 and 300 Hz). Despite being common across nodes, β-HFO PAC in the current analysis seems to carry little clinical significance, not correlating with symptom severity. Furthermore, β-HFO PAC is present in dystonia patients in both STN (Wang et al., 2016) and GPi, (in the current report). Given the lack of clinical correlation and its presence across diseases, more work is needed to define whether β-HFO PAC is still valuable as a specific biomarker of PD. Of note, while we report that GPi β-HFO PAC is significantly different between PD and dystonia subjects, this difference should be interpreted with caution given the small number of dystonia subjects assessed. Moreover, the relative utility of β-HFO PAC may differ across basal ganglia nuclei.
Unique to the GPi, we also report β-low γ PAC, which has not been previously reported in other BGTC nodes. The selection of PAC metric, was based on the fact that MI has been used frequently in other studies of PD pathophysiology (de Hemptinne et al., 2015, 2013; Lopez-Azcarate et al., 2010; Shreve et al., 2017; Swann et al., 2015). To further confirm statistically significant β-low γ PAC and that our new finding of such coupling is not spurious we investigated verification of such coupling using alternate methods of calculating the PAC, using both coherence based method (Colgin et al., 2009) and the mean height ratio (Tort et al., 2010). All these methods provided similar findings on β-low γ PAC, attesting to the robustness of the results.
On multivariate analysis, low β-low γ was found to be the independent variable explaining the largest proportion of variability of symptom severity amongst all parameters showing linear correlation with PD subscores. Contrary to our expectation (based on cortical β-broadband γ PAC and subthalamic β-HFO PAC), increased symptom severity was associated with lower resting state pallidal low β-low γ and high β-low γ PAC, suggesting that β-low γ PAC in the GPi is either (1) a normal resting physiological signals or (2) a compensatory signal accounting for decreased severity, both of which may theoretically diminish with progressive disease. This distinction was further explored by analysis of pallidal LFPs of 5 GPi nuclei from three dystonia patients undergoing DBS surgery (Supplementary Figure S2), where we observed similar statistically significant low β-low γ PAC. Given the presence of β-low γ PAC in dystonia patients and the differences in pathophysiology between dystonia and PD, we speculate the presence of pallidal low β-low γ PAC is a normal signal. Still, a compensatory signal in both diseases cannot be ruled out because similar recordings from normal subjects are not possible. Of note, regardless of disease severity, with movement, all subjects seem to be able to suppress low β-low γ PAC to similar levels (Fig. 5), suggesting disease is not related to the ability to suppress this signal, but more associated with the relative presence or absence of this PAC at rest. Given the role of low γ oscillations in the motor system in “promoting movement”, β entrainment of low γ oscillations in the pallidum might reflect a normal mechanism by which a pro-kinetic rhythm is controlled. Loss of this regulatory mechanism could be why more severely affected PD patients are prone to hyperkinetic states, such as dyskinesias.
4.3. Pallidal Low γ power and its movement modulation
The role of pallidal low γ oscillations in the PD pathophysiology remains relatively underexplored. While most studies have focused on β, HFO, and broadband frequencies, low γ signals (both locally within STN and GPi as well as between STN and GPi) seem to be intimately related to movement, symptom severity, and therapeutic state. Similar to a prior STN study which found that low γ is movement modulated (Androulidakis et al., 2007), our current results support significant movement modulation of low γ signals in GPi. In addition, we found that the degree of movement modulation of low γ in the contralateral GPi was significantly correlated with symptom severity (particularly bradykinesia and rigidity). This builds upon prior studies suggesting that low γ physiology changes with therapeutic state (or disease severity). Specifically, while bilateral STN low γ (40–85 Hz) power increases with movement onset in the off medication state, movement modulation of STN low γ power was more pronounced in the contralateral STN when on dopaminergic medications (Androulidakis et al., 2007). Brown and colleagues also reported that while GPi and STN LFPs were coherent in the β range while off medication, their coherence shifted towards low γ frequencies (~70 Hz) with dopaminergic medications (Brown et al., 2001). Taken with the current results, this suggests that patients who are less symptomatic (or are treated) are able to better modulate low γ with movement. This ability to modulate low γ might be associated with increased network-level low γ coherence (at least between STN and GPi) and local low β–low γ PAC. The entrainment of low γ amplitude by the phase of low β may provide a critical link between these otherwise seemingly distinct physiological signals. The causal relationship between these signals remains unclear at this time and deserves further evaluation. Future studies evaluating the dopaminergic modulation of local low γ and low β–low γ are needed to further elucidate this complex relationship and the interdependence of these measures.
4.4. Limitations of current study and future directions
PD is an asymmetric disease, clinically, histo-pathologically (Kempster et al., 1989) and radiographically (positron emission tomography studies, (Leenders et al., 1990)) suggesting the two hemispheres have the potential to provide independent information about the pathophysiology of disease. Prior studies, such as (Shreve et al., 2017), in fact demonstrate that basal ganglia physiology is different in the 2 hemispheres and that relative differences in dopamine deficiency may directly influence movement-related β modulation in bilateral STN, with greater β-suppression in the most dopamine-depleted hemisphere for both ipsi- and contralateral hand movements (Canessa et al., 2016). Suggested by this prior evidence, in this study we treated pallidal nuclei from two hemispheres as independent samples. We acknowledge this approach as a potential limitation but a common approach used to deal with the challenges of collecting data invasively from the basal ganglia in human subjects.
Due to the nature of acute intraoperative recordings, we did not have access to pallidal local field potentials on dopaminergic medications at the time of the current analysis. Further investigation is needed to establish unique and interactive influence of movement and therapy (both dopaminergic medication and DBS) on the local and network level coupling. Due to inherent challenges associated with these studies and not having access to normal/healthy controls, a relation of these findings to PD pathophysiology should be viewed with caution. Moreover, the interpretation of what is normal versus compensatory must be approached with care. For example, emergent rest tremor could be a confounding factor. While this possibility is minimized by our center’s preference to treat patients with significant tremor with STN DBS, the current dataset unfortunately does not include simultaneous monitoring of tremor during LFP recordings to completely exclude this confound. Here, we further emphasize the fact that our goal was mainly to investigate characteristics of neuronal oscillations present in the GPi as it is uniquely positioned as the final output of basal ganglia, and sends afferent projections to the thalamus.
Finally, most studies of STN LFPs have used UPDRS scores done shortly before or at the time of recordings. Unfortunately, UPDRS assessment included in this study were done between 1 and 3 months before the DBS surgery. However, we believe that rate of disease progression is unlikely to be so rapid to invalidate the results of our analyses. Furthermore our preliminary kinematic analysis of the tapping rate (as a measure of bradykinesia) and finger tapping UPDRS scores show a significant correlation between the two further emphasizing that clinical scores used in this study (especially those of bradykinesia) accurately represent the disease state as it pertains to kinematic evaluation.
5. Conclusions
This is the first study to show β-low γ PAC within GPi, the final common output of basal ganglia, and to provide evidence of functional subdivision of pallidal β band into “low” and “high” sub-bands similar to the STN. Uniquely, GPi demonstrates distinct β-low γ PAC which is modulated by contralateral hand movement and is inversely correlated to the clinical scores for rigidity and bradykinesia. When compared to dystonia subjects, low β-low γ PAC may be a normal GPi signal, the loss of which is related to symptom severity. This study provides additional evidence to the current literature on the pathophysiological contribution of local pallidal coupling and suggests similar and distinct patterns of coupling between GPi and STN in PD.
Supplementary Material
Highlights.
First report on pallidal phase-amplitude coupling (PAC) between phase of β and amplitude of low γ frequencies in Parkinson’s disease.
Resting low β-low γ PAC in GPi is the most significant predictor of bradykinesia and rigidity.
Movement modulation of low β-low γ PAC inversely correlates with rigidity and bradykinesia.
Acknowledgments
The authors would like to thank all the patients participated in this study without whom recording of local field potentials would not be possible. Furthermore, they would like to thank Dr. David McArthur for the consult on the statistical analysis and Dr Yvette Bordelon for the clinical assessment of all patients enrolled in the study and for contributions to intraoperative macrostimulation testing to confirm final lead position.
Funding
This work was supported by the National Institutes of Biomedical Imaging and Bioengineering [K23 EB014326], National Institutes of Neurological Disease and Stroke [R01NS097782], and philanthropic support from Casa Colina Centers for Rehabilitation and postdoctoral fellowship from American Parkinson disease association
Abbreviations
- BGTC
Basal ganglia-thalamo-cortical
- DBS
Deep brain stimulation
- GPi
Globus pallidus internus
- HFO
High frequency oscillations
- LFP
Local field potentials
- PAC
Phase amplitude coupling
- PSD
Power spectral density
- STN
Subthalamic nucleus
- UPDRS
Unified Parkinson disease rating scale
Footnotes
Publisher's Disclaimer: This is a PDF file of an unedited manuscript that has been accepted for publication. As a service to our customers we are providing this early version of the manuscript. The manuscript will undergo copyediting, typesetting, and review of the resulting proof before it is published in its final citable form. Please note that during the production process errors may be discovered which could affect the content, and all legal disclaimers that apply to the journal pertain.
Conflict of Interest
None of the authors have potential conflicts of interest to be disclosed.
References
- Andersson JLR, Jenkinson M, Smith S. Non-linear registration aka Spatial normalisation. FMRIB Technial Report TR07JA2. 2007;22 In Pract. [Google Scholar]
- Androulidakis AG, Kuhn AA, Chen CC, Blomstedt P, Kempf F, Kupsch A, et al. Dopaminergic therapy promotes lateralized motor activity in the subthalamic area in Parkinson’s disease. Brain. 2007;130:457–68. doi: 10.1093/brain/awl358. [DOI] [PubMed] [Google Scholar]
- Aru JJ, Aru JJ, Priesemann V, Wibral M, Lana L, Pipa G, et al. Untangling cross-frequency coupling in neuroscience. Curr Opin Neurobiol. 2015;31:51–61. doi: 10.1016/j.conb.2014.08.002. [DOI] [PubMed] [Google Scholar]
- Benjamini Y, Drai D, Elmer G, Kafkafi N, Golani I. Controlling the false discovery rate in behavior genetics research. Behav Brain Res. 2001;125:279–84. doi: 10.1016/s0166-4328(01)00297-2. [DOI] [PubMed] [Google Scholar]
- Brittain J-SS, Brown P. Oscillations and the basal ganglia: motor control and beyond. Neuroimage. 2014;85:637–47. doi: 10.1016/j.neuroimage.2013.05.084. [DOI] [PMC free article] [PubMed] [Google Scholar]
- Brown P, Oliviero A, Mazzone P, Insola A, Tonali P, Di Lazzaro V. Dopamine dependency of oscillations between subthalamic nucleus and pallidum in Parkinson’s disease. J Neurosci. 2001;21:1033–8. doi: 10.1523/JNEUROSCI.21-03-01033.2001. [DOI] [PMC free article] [PubMed] [Google Scholar]
- Brown P. Oscillatory nature of human basal ganglia activity: Relationship to the pathophysiology of parkinson’s disease. Mov Disord. 2003;18:357–63. doi: 10.1002/mds.10358. [DOI] [PubMed] [Google Scholar]
- Canessa A, Pozzi NG, Arnulfo G, Brumberg J, Reich MM, Pezzoli G, et al. Striatal Dopaminergic Innervation Regulates Subthalamic Beta-Oscillations and Cortical-Subcortical Coupling during Movements: Preliminary Evidence in Subjects with Parkinson’s Disease. Front Hum Neurosci. 2016;10:611. doi: 10.3389/fnhum.2016.00611. [DOI] [PMC free article] [PubMed] [Google Scholar]
- Chen CC, Hsu YT, Chan HL, Chiou SM, Tu PH, Lee ST, et al. Complexity of subthalamic 13–35 Hz oscillatory activity directly correlates with clinical impairment in patients with Parkinson’s disease. Exp Neurol. 2010;224:234–40. doi: 10.1016/j.expneurol.2010.03.015. [DOI] [PubMed] [Google Scholar]
- Colgin LL, Denninger T, Fyhn M, Hafting T, Bonnevie T, Jensen O, et al. Frequency of gamma oscillations routes flow of information in the hippocampus. Nature. 2009;462:353–7. doi: 10.1038/nature08573. [DOI] [PubMed] [Google Scholar]
- Crowell AL, Ryapolova-Webb ES, Ostrem JL, Galifianakis NB, Shimamoto S, Lim DA, et al. Oscillations in sensorimotor cortex in movement disorders: an electrocorticography study. Brain. 2012;135:615–30. doi: 10.1093/brain/awr332. [DOI] [PMC free article] [PubMed] [Google Scholar]
- Deuschl G, Schade-Brittinger C, Krack P, Volkmann J, Schäfer H, Bötzel K, et al. A randomized trial of deep-brain stimulation for Parkinson’s disease. N Engl J Med. 2006;355:896–908. doi: 10.1056/NEJMoa060281. [DOI] [PubMed] [Google Scholar]
- Eusebio A, Brown P. Oscillatory activity in the basal ganglia. Park Relat Disord. 2007;13:S434–6. doi: 10.1016/S1353-8020(08)70044-0. [DOI] [PubMed] [Google Scholar]
- Eusebio A, Thevathasan W, Doyle Gaynor L, Pogosyan A, Bye E, Foltynie T, et al. Deep brain stimulation can suppress pathological synchronisation in parkinsonian patients. J Neurol Neurosurg Psychiatry. 2011;82:569–73. doi: 10.1136/jnnp.2010.217489. [DOI] [PMC free article] [PubMed] [Google Scholar]
- Follett KA, Weaver FM, Stern M, Hur K, Harris CL, Luo P, et al. Pallidal versus subthalamic deep-brain stimulation for Parkinson’s disease. N Engl J Med. 2010;362:2077–91. doi: 10.1056/NEJMoa0907083. [DOI] [PubMed] [Google Scholar]
- Genovese CR, Lazar NA, Nichols T. Thresholding of statistical maps in functional neuroimaging using the false discovery rate. Neuroimage. 2002;15:870–8. doi: 10.1006/nimg.2001.1037. [DOI] [PubMed] [Google Scholar]
- Hammond C, Bergman H, Brown P. Pathological synchronization in Parkinson’s disease: networks, models and treatments. Trends Neurosci. 2007;30:357–64. doi: 10.1016/j.tins.2007.05.004. [DOI] [PubMed] [Google Scholar]
- de Hemptinne C, Ryapolova-Webb ES, Air EL, Garcia PA, Miller KJ, Ojemann JG, et al. Exaggerated phase-amplitude coupling in the primary motor cortex in Parkinson disease. Proc Natl Acad Sci U S A. 2013;110:4780–5. doi: 10.1073/pnas.1214546110. [DOI] [PMC free article] [PubMed] [Google Scholar]
- de Hemptinne C, Swann NC, Ostrem JL, Ryapolova-Webb ES, San Luciano M, Galifianakis NB, et al. Therapeutic deep brain stimulation reduces cortical phase-amplitude coupling in Parkinson’s disease. Nat Neurosci. 2015;18:779–86. doi: 10.1038/nn.3997. [DOI] [PMC free article] [PubMed] [Google Scholar]
- Holm S. A simple sequential rejective multiple test procedure. Scand J Stat. 1979;6:65–70. [Google Scholar]
- Israel Z, Burchiel K. Microelectrode recording in movement disorder surgery. Thieme; 2004. [Google Scholar]
- Jenkinson M, Beckmann CF, Behrens TE, Woolrich MW, Smith SM. Fsl Neuroimage. 2012;62:782–90. doi: 10.1016/j.neuroimage.2011.09.015. [DOI] [PubMed] [Google Scholar]
- Jimenez-Shahed J, Telkes I, Viswanathan A, Ince NF. GPi Oscillatory Activity Differentiates Tics from the Resting State, Voluntary Movements, and the Unmedicated Parkinsonian State. Front Neurosci. 2016;10:436. doi: 10.3389/fnins.2016.00436. [DOI] [PMC free article] [PubMed] [Google Scholar]
- Kempster PA, Gibb WR, Stern GM, Lees AJ. Asymmetry of substantia nigra neuronal loss in Parkinson’s disease and its relevance to the mechanism of levodopa related motor fluctuations. J Neurol Neurosurg Psychiatry. 1989;52:72–6. doi: 10.1136/jnnp.52.1.72. [DOI] [PMC free article] [PubMed] [Google Scholar]
- Kim JW, Lee JH, Kwon Y, Kim CS, Eom GM, Koh SB, et al. Quantification of bradykinesia during clinical finger taps using a gyrosensor in patients with Parkinson’s disease. Med Biol Eng Comput. 2011;49:365–71. doi: 10.1007/s11517-010-0697-8. [DOI] [PubMed] [Google Scholar]
- Kuhn AA, Tsui A, Aziz T, Ray N, Brucke C, Kupsch A, et al. Pathological synchronisation in the subthalamic nucleus of patients with Parkinson’s disease relates to both bradykinesia and rigidity. Exp Neurol. 2009;215:380–7. doi: 10.1016/j.expneurol.2008.11.008. [DOI] [PubMed] [Google Scholar]
- Leenders KL, Salmon EP, Tyrrell P, Perani D, Brooks DJ, Sager H, et al. The nigrostriatal dopaminergic system assessed in vivo by positron emission tomography in healthy volunteer subjects and patients with Parkinson’s disease. Arch Neurol. 1990;47:1290–8. doi: 10.1001/archneur.1990.00530120034007. [DOI] [PubMed] [Google Scholar]
- Levy R, Ashby P, Hutchison WD, Lang AE, Lozano AM, Dostrovsky JO. Dependence of subthalamic nucleus oscillations on movement and dopamine in Parkinson’s disease. Brain. 2002;125:1196–209. doi: 10.1093/brain/awf128. [DOI] [PubMed] [Google Scholar]
- Little S, Brown P. What brain signals are suitable for feedback control of deep brain stimulation in Parkinson’s disease? Ann N Y Acad Sci. 2012;1265:9–24. doi: 10.1111/j.1749-6632.2012.06650.x. [DOI] [PMC free article] [PubMed] [Google Scholar]
- Little S, Brown P. The functional role of beta oscillations in Parkinson’s disease. Park Relat Disord. 2014;20(Suppl 1):S44–8. doi: 10.1016/S1353-8020(13)70013-0. [DOI] [PubMed] [Google Scholar]
- Litvak V, Jha A, Eusebio A, Oostenveld R, Foltynie T, Limousin P, et al. Resting oscillatory cortico-subthalamic connectivity in patients with Parkinson’s disease. Brain. 2011;134:359–74. doi: 10.1093/brain/awq332. [DOI] [PubMed] [Google Scholar]
- Lopez-Azcarate J, Tainta M, Rodriguez-Oroz MC, Valencia M, Gonzalez R, Guridi J, et al. Coupling between beta and high-frequency activity in the human subthalamic nucleus may be a pathophysiological mechanism in Parkinson’s disease. J Neurosci. 2010;30:6667–77. doi: 10.1523/JNEUROSCI.5459-09.2010. [DOI] [PMC free article] [PubMed] [Google Scholar]
- Malekmohammadi M, Elias WJ, Pouratian N. Human Thalamus Regulates Cortical Activity via Spatially Specific and Structurally Constrained Phase-Amplitude Coupling. Cereb Cortex. 2015;25:1618–28. doi: 10.1093/cercor/bht358. [DOI] [PMC free article] [PubMed] [Google Scholar]
- Marreiros AC, Cagnan H, Moran RJ, Friston KJ, Brown P. Basal ganglia-cortical interactions in Parkinsonian patients. Neuroimage. 2013;66:301–10. doi: 10.1016/j.neuroimage.2012.10.088. [DOI] [PMC free article] [PubMed] [Google Scholar]
- Oostenveld R, Fries P, Maris E, Schoffelen J-M, Oostenveld R, Fries P, et al. FieldTrip: Open Source Software for Advanced Analysis of MEG, EEG, and Invasive Electrophysiological Data, FieldTrip: Open Source Software for Advanced Analysis of MEG, EEG, and Invasive Electrophysiological Data. Comput Intell Neurosci. 2011;2011:156869. doi: 10.1155/2011/156869. [DOI] [PMC free article] [PubMed] [Google Scholar]
- Oswal A, Beudel M, Zrinzo L, Limousin P, Hariz M, Foltynie T, et al. Deep brain stimulation modulates synchrony within spatially and spectrally distinct resting state networks in Parkinson’s disease. Brain. 2016;139:1482–96. doi: 10.1093/brain/aww048. [DOI] [PMC free article] [PubMed] [Google Scholar]
- Oswal A, Brown P, Litvak V. Synchronized neural oscillations and the pathophysiology of Parkinson’s disease. Curr Opin Neurol. 2013;26:662–70. doi: 10.1097/WCO.0000000000000034. [DOI] [PubMed] [Google Scholar]
- Ozkurt TE, Butz M, Homburger M, Elben S, Vesper J, Wojtecki L, et al. High frequency oscillations in the subthalamic nucleus: a neurophysiological marker of the motor state in Parkinson’s disease. Exp Neurol. 2011;229:324–31. doi: 10.1016/j.expneurol.2011.02.015. [DOI] [PubMed] [Google Scholar]
- R Development Core Team. R: A language and environment for statistical computing. R Foundation for Statistical Computing; Vienna, Austria: 2011. URL http://www.R-project.org/ [Google Scholar]
- Ray NJ, Jenkinson N, Wang S, Holland P, Brittain JS, Joint C, et al. Local field potential beta activity in the subthalamic nucleus of patients with Parkinson’s disease is associated with improvements in bradykinesia after dopamine and deep brain stimulation. Exp Neurol. 2008;213:108–13. doi: 10.1016/j.expneurol.2008.05.008. [DOI] [PubMed] [Google Scholar]
- Shreve LA, Velisar A, Malekmohammadi M, Koop MM, Trager M, Quinn EJ, et al. Subthalamic oscillations and phase amplitude coupling are greater in the more affected hemisphere in Parkinson’s disease. Clin Neurophysiol. 2017;128:128–37. doi: 10.1016/j.clinph.2016.10.095. [DOI] [PubMed] [Google Scholar]
- Smith SM, Jenkinson M, Woolrich MW, Beckmann CF, Behrens TEJ, Johansen-berg H, et al. Advances in Functional and Structural MR Image Analysis and Implementation as FSL Technical Report TR04SS2. Neuroimage. 2004;23(S1):208–19. doi: 10.1016/j.neuroimage.2004.07.051. [DOI] [PubMed] [Google Scholar]
- de Solages C, Hill BC, Koop MM, Henderson JM, Bronte-Stewart H. Bilateral symmetry and coherence of subthalamic nuclei beta band activity in Parkinson’s disease. Exp Neurol. 2010;221:260–6. doi: 10.1016/j.expneurol.2009.11.012. [DOI] [PubMed] [Google Scholar]
- Stein E, Bar-Gad I. beta oscillations in the cortico-basal ganglia loop during parkinsonism. Exp Neurol. 2013;245:52–9. doi: 10.1016/j.expneurol.2012.07.023. [DOI] [PubMed] [Google Scholar]
- Stoffers D, Bosboom JLW, Wolters ECEc, Stam CJ, Berendse HW. Dopaminergic modulation of cortico-cortical functional connectivity in Parkinson’s disease: an MEG study. Exp Neurol. 2008;213:191–5. doi: 10.1016/j.expneurol.2008.05.021. [DOI] [PubMed] [Google Scholar]
- Swann NC, de Hemptinne C, Aron AR, Ostrem JL, Knight RT, Starr PA. Elevated synchrony in Parkinson disease detected with electroencephalography. Ann Neurol. 2015;78:742–50. doi: 10.1002/ana.24507. [DOI] [PMC free article] [PubMed] [Google Scholar]
- Tort ABL, Komorowski R, Eichenbaum H, Kopell N. Measuring phase-amplitude coupling between neuronal oscillations of different frequencies. J Neurophysiol. 2010;104:1195–210. doi: 10.1152/jn.00106.2010. [DOI] [PMC free article] [PubMed] [Google Scholar]
- Tsiokos C, Hu X, Pouratian N. 200-300Hz movement modulated oscillations in the internal globus pallidus of patients with Parkinson’s Disease. Neurobiol Dis. 2013;54:464–74. doi: 10.1016/j.nbd.2013.01.020. [DOI] [PMC free article] [PubMed] [Google Scholar]
- Wang DD, de Hemptinne C, Miocinovic S, Qasim SE, Miller AM, Ostrem JL, et al. Subthalamic local field potentials in Parkinson’s disease and isolated dystonia: An evaluation of potential biomarkers. Neurobiol Dis. 2016;89:213–22. doi: 10.1016/j.nbd.2016.02.015. [DOI] [PMC free article] [PubMed] [Google Scholar]
- Weaver FM, Follett K, Stern M, Hur K, Harris C, Marks WJ, et al. Bilateral deep brain stimulation vs best medical therapy for patients with advanced Parkinson disease: a randomized controlled trial. JAMA. 2009;301:63–73. doi: 10.1001/jama.2008.929. [DOI] [PMC free article] [PubMed] [Google Scholar]
- Weinberger M, Mahant N, Hutchison WD, Lozano AM, Moro E, Hodaie M, et al. Beta oscillatory activity in the subthalamic nucleus and its relation to dopaminergic response in Parkinson’s disease. J Neurophysiol. 2006;96:3248–56. doi: 10.1152/jn.00697.2006. [DOI] [PubMed] [Google Scholar]
- Weiss D, Klotz R, Govindan RB, Scholten M, Naros G, Ramos-Murguialday A, et al. Subthalamic stimulation modulates cortical motor network activity and synchronization in Parkinson’s disease. Brain. 2015;138:679–93. doi: 10.1093/brain/awu380. [DOI] [PMC free article] [PubMed] [Google Scholar]
- van Wijk BCM, Beudel M, Jha A, Oswal A, Foltynie T, Hariz MI, et al. Subthalamic nucleus phase-amplitude coupling correlates with motor impairment in Parkinson’s disease. Clin Neurophysiol. 2016;127:2010–9. doi: 10.1016/j.clinph.2016.01.015. [DOI] [PMC free article] [PubMed] [Google Scholar]
- Woolrich MW, Jbabdi S, Patenaude B, Chappell M, Makni S, Behrens T, et al. Bayesian analysis of neuroimaging data in FSL. Neuroimage. 2009;45 doi: 10.1016/j.neuroimage.2008.10.055. [DOI] [PubMed] [Google Scholar]
- Yang AI, Vanegas N, Lungu C, Zaghloul KA. Beta-coupled high-frequency activity and beta-locked neuronal spiking in the subthalamic nucleus of Parkinson’s disease. J Neurosci. 2014;34:12816–27. doi: 10.1523/JNEUROSCI.1895-14.2014. [DOI] [PMC free article] [PubMed] [Google Scholar]
Associated Data
This section collects any data citations, data availability statements, or supplementary materials included in this article.