

Abstract
NADPH oxidase 5 (NOX5) generated reactive oxygen species (ROS) have been implicated in signaling cascades that regulate cancer cell proliferation. To evaluate and validate NOX5 expression in human tumors, we screened a broad range of tissue microarrays (TMAs), and report substantial overexpression of NOX5 in malignant melanoma and cancers of the prostate, breast, and ovary. In human UACC‐257 melanoma cells that possesses high levels of functional endogenous NOX5, overexpression of NOX5 resulted in enhanced cell growth, increased numbers of BrdU positive cells, and increased γ‐H2AX levels. Additionally, NOX5‐overexpressing (stable and inducible) UACC‐257 cells demonstrated increased normoxic HIF‐1α expression and decreased p27Kip1 expression. Similarly, increased normoxic HIF‐1α expression and decreased p27Kip1 expression were observed in stable NOX5‐overexpressing clones of KARPAS 299 human lymphoma cells and in the human prostate cancer cell line, PC‐3. Conversely, knockdown of endogenous NOX5 in UACC‐257 cells resulted in decreased cell growth, decreased HIF‐1α expression, and increased p27Kip1 expression. Likewise, in an additional human melanoma cell line, WM852, and in PC‐3 cells, transient knockdown of endogenous NOX5 resulted in increased p27Kip1 and decreased HIF‐1α expression. Knockdown of endogenous NOX5 in UACC‐257 cells resulted in decreased Akt and GSK3β phosphorylation, signaling pathways known to modulate p27Kip1 levels. In summary, our findings suggest that NOX5 expression in human UACC‐257 melanoma cells could contribute to cell proliferation due, in part, to the generation of high local concentrations of extracellular ROS that modulate multiple pathways that regulate HIF‐1α and networks that signal through Akt/GSK3β/p27Kip1.
Keywords: Akt/GSK3 signaling, cell growth, DNA damage, NADPH oxidase, reactive oxygen species (ROS), tumor microarray (TMA)
Abbreviations
- 7 AAD
7‐aminoactinomycin D
- Akt
protein kinase B
- ALK
anaplastic lymphoma kinase
- AMPK
5′ adenosine monophosphate‐activated protein kinase
- BAPTA‐AM
1,2‐Bis(2‐aminophenoxy)ethane‐N,N,N',N'‐tetraacetic acid tetrakis(acetoxymethyl ester)
- BrdU
5‐bromo‐2′‐deoxyuridine
- Ca2+
calcium ions
- CDK
cyclin‐dependent kinases
- DCF
2′,7′‐dichlorofluorescein
- DPI
diphenyleneiodonium
- DTT
dithiothreitol
- DNase
deoxyribonuclease
- DUOX
dual oxidase
- FAD
flavin adenine dinucleotide
- Fe2+
ferrous ion
- FOXO
forkhead box protein O
- G418
geneticin
- GSK3
glycogen synthase kinase 3
- H2‐DCFDA
2′,7′‐dichlorodihydrofluorescein diacetate
- H2O2
hydrogen peroxide
- H2AX
histone H2AX
- HA‐tag
hemagglutinin tag
- HIF‐1α
hypoxia‐inducible factor 1‐alpha
- HRP
horseradish peroxidase
- KRPG
krebs‐ringer phosphate glucose buffer
- MAPK
mitogen activated protein kinase
- NAC
N‐Acetyl‐L‐Cysteine
- NADP+
nicotinamide adenine dinucleotide phosphate oxidized
- NADPH
nicotinamide adenine dinucleotide phosphate reduced
- NOX
NADPH oxidase
- p27Kip1
cyclin‐dependent kinase inhibitor 1B
- PBS
phosphate‐buffered saline
- PEG
polyethylene glycol
- PIM
proto‐oncogene serine/threonine‐protein kinase
- PMA
phorbol‐12‐myristate‐13‐acetate
- RT‐PCR
reverse transcription—polymerase chain reaction
- ROS
reactive oxygen species
- SDS
sodium dodecyl sulfate
- SOD
superoxide dismutase
- sh
short hairpin
- siRNA
small interfering RNA
- TBST
tris‐buffered saline with 0.1% Tween 20
- TMA
tissue microarray
1. INTRODUCTION
A growing body of evidence supports a dual role for reactive oxygen species (ROS) as signaling molecules.1, 2, 3 Controlled ROS production regulates normal cellular physiological functions4; but in excess, ROS are detrimental to the cell resulting in cell differentiation and/or cell death.1, 5, 6 Much recent research has focused on how low levels of intracellular ROS (10‐100 nM) regulate tumor growth by facilitating mutagenesis, tumor initiation, and tumor promotion.6, 7 Members of the NAPDH oxidase (NOX) family play a major role in generating ROS in a broad range of cell types.1, 8, 9, 10 This 7‐membered family is comprised of NOXes 1‐5 and DUOX 1 and 2 proteins that function to generate ROS by oxidizing NADPH to NADP+.11, 12, 13 The vital roles that NOX‐mediated ROS play in host defense, metabolism, and the control of vascular tone are well documented.14, 15, 16 More recently, several studies have reported upregulated RNA and protein expression levels of the NOX family of proteins in human tumors, as well as a link between expression levels and cancer cell proliferation.6, 9, 10, 17, 18 NOX1 expression has been linked to colon cancer; a role for NOX1 in the etiology of gastric and prostate cancers has also been suggested.9, 17, 19, 20 Increased NOX4 expression has been found predominantly in tumors of the brain, ovary, and kidney, as well as in melanoma.9, 17, 21 NOX5 has been measured primarily in the context of prostate, breast, and esophageal cancer22, 23, 24, 25; and DUOX1 and DUOX2 have been found in thyroid, lung, and pancreatic cancers.9, 17, 26
Of the tumor‐associated NOXes reported thus far, the role of NADPH oxidase 5 (NOX5) is the least well understood; largely, this is because of a paucity of animal‐based studies due to the lack of NOX5 expression in rodents.27, 28, 29 Structurally like the other NOXes, NOX5 is anchored to the plasma membrane through its six transmembrane helices that can bind two heme cofactors and allow for NADPH oxidation through a C‐terminal FAD/NADPH binding domain.17, 30, 31, 32, 33, 34, 35 However, although regulated by calcium, NOX5 has no known interaction partner essential for its activity.29, 35, 36 Several studies report correlations between NOX5 expression and tumorigenesis23, 37; yet, limited evidence exists detailing the signaling role of NOX5 in tumor biology. Such studies include, but are not limited to, explorations of the role of NOX5 in hairy cell leukemia,38 ALK‐positive anaplastic large‐cell lymphoma,39 prostate cancer,22, 24, 40 and esophageal adenocarcinoma.25, 41, 42 Recently, our laboratory reported the characterization of NOX5 expression in human tumors and tumor cell lines using a new NOX5 monoclonal antibody.22 Preliminary human tumor microarray (TMA) analysis revealed high levels of NOX5 expression, with a frequency of intermediate to strong expression in 57‐70% of several human tumors, including prostate cancer and melanoma.22 Detection of elevated expression levels of NOX5 in a variety of human malignancies led us to further explore the functional significance of NOX5 in the context of tumorigenesis.
In this study, we performed a more detailed evaluation of NOX5 expression across several tumor microarrays to assess the frequency of NOX5 expression in a larger sample of human malignancies. Here, we validate our initial findings and report substantial overexpression of NOX5, compared to histologically normal tissues, in several human cancers including those of prostate and breast and in malignant melanoma. We also report NOX5 expression across a panel of human melanoma cell lines, with the UACC‐257 line having the highest endogenous expression. Functional NOX5‐derived ROS production in UACC‐257 cells regulates normoxic HIF‐1α and p27Kip1 expression. Additionally, NOX5 overexpression modulates γH2AX levels and the growth of the UACC‐257 melanoma line. These results were confirmed in additional human tumor cell models that possess functional NOX5 activity.
2. MATERIALS AND METHODS
2.1. Reagents and antibodies
Anti‐β‐Actin antibody (#A3853), N‐Acetyl‐L‐Cysteine (NAC; #A7250), Doxycycline hydrochloride (#D3447), Ampicillin sodium salt (#A0166), Diphenyleneiodonium chloride (DPI; #D‐2926), Catalase (#C1345), PEG‐Catalase (#C4963), and PEG‐SOD (#S9549) were purchased from Sigma‐Aldrich (St. Louis, MO); Geneticin G418 (#G5005) was from Teknova (Hollister, CA); Ionomycin (#407952), Phorbol‐12‐myristate‐13‐acetate (PMA; #524400), and BAPTA‐AM (#196419) were from EMD Chemicals (Billerica, MA); Akt (#4691), p‐Akt (Ser473) (#4058), GSK3β (#9315), p‐GSK3β (Ser9) (#9336), Lamin A/C (#2032), SKP2 (#4313) antibodies were from Cell Signaling Technology (Danvers; MA); HIF‐1α (#610959) and p27Kip1 (#610241) antibodies were from BD Biosciences (San Jose, CA); p27Kip1 phospho (pT157) (#T3757) and p27Kip1 phospho (pS10) (#ab62364) antibodies were purchased from Abcam (Cambridge, MA); and Anti‐HA antibody (#11867423001) was purchased from Roche‐Applied Science (Indianapolis, IN). Restriction enzymes BamH1 (#R0136S), BglII (#R0144S), ECORV (#R0195S) and T4 DNA ligase (#M0202S) were purchased from New England Biolabs (Ipswich, MA). Opti‐MEM® reduced serum medium (#11058‐021), MAX Efficiency® DH5α™ competent Cells (#18258012), Puromycin dihydrochloride (#A1113803), 2′,7′‐Dichlorodihydrofluorescin diacetate (H2‐DCFDA, #D399) were obtained from Thermo Fisher Scientific (Rockford, IL). LB plates containing ampicillin (#BPL‐2200) were purchased from KD Medical (Columbia, MD). Human anti‐NOX5 antibody was previously developed by Creative Biolabs (Port Jefferson Station, NY) and characterized by our laboratory. NOX5β (accession number AF325189) subcloned into a modified pcDNA3 containing an N‐terminal HA epitope was a kind gift from Dr. David J. R. Fulton (Medical College of Georgia).
2.2. Cell culture and transfection
The human melanoma cell lines LOX IMVI, M14, MALME‐3M, SK‐MEL‐2, SK‐MEL‐5, SK‐MEL‐28, UACC‐62, and UACC‐257 were obtained from the Developmental Therapeutics Program, Division of Cancer Treatment and Diagnosis of the National Cancer Institute, Frederick, MD and were cultured in RPMI‐1640 medium (SH30255.01; HyClone) supplemented with 10% FBS (#100‐106; Gemini Bio Products). The melanoma cell lines Lu1205 (#1205 Lu‐01‐0001), WM115 (#WM115‐01‐0001), WM852 (#WM852‐01‐0001), and WM1158 (#WM1158‐01‐0001) were obtained from Rockland Immunochemicals Inc., and maintained in 2% melanoma media (4:1 mixture of MCDB153 and L15, supplemented with 2 mM Ca2+, 2% FBS, and 5 μg/mL insulin). The melanoma cell lines SK‐MEL‐3 (#HTB‐69), G‐361 (#CRL‐1424), and HT‐144 (#HTB‐63) were obtained from ATCC and maintained in McCoy's 5a Medium Modified (#30‐2007, ATCC) with 15% FBS for SK‐MEL‐3 and G‐361 cells and 10% FBS for HT‐144 cells. A375 (#CRL‐1619), A2058 (#CRL‐11147), SH‐4 (# CRL‐7724), and Hs895‐T (#CRL‐7637) melanoma cell lines from ATCC were maintained in Dulbecco's Modified Eagle's Medium (#30‐2002, ATCC) with 10% FBS. Hs895‐Sk (#CRL‐7636) cell line from ATCC was maintained in Dulbecco's modified Eagle's medium (4 mM L‐glutamine adjusted to contain 1.5 g/L sodium bicarbonate, 4.5 g/L glucose) containing 10% FBS. RPMI‐7951 (#HTB‐66) and SK‐MEL‐24 (#HTB‐71) melanoma cell lines from ATCC were maintained in Eagle's Minimum Essential Medium (#30‐2003, ATCC) containing 10% and 15% FBS, respectively. PC‐3 human prostate cancer cells (#CRL‐1435) were obtained from ATCC and maintained in F‐12 K medium (#30‐2004, ATCC) supplemented with 10% FBS. Human KARPAS 299 lymphoma cell line (#06072604) was obtained from Sigma and cultured in RPMI‐1640 medium supplemented with 2 mM glutamine and 10% FBS. All cell lines were maintained at 37°C in 5% CO2 and 95% air and humidified atmosphere. The identity of the cell lines was confirmed by the Genetic Resources Core Facility of Johns Hopkins University (Baltimore, MD).
Transfection was carried out using Lipofectamine® 2000 (#11668019, Invitrogen/Thermo Fisher Scientific) according to the manufacturer's protocol. To generate cells that stably overexpress NOX5 (UACC‐257, PC‐3 and KARPAS 299), cells were transfected with a pcDNA3‐NOX5β plasmid (kind gift from Dr. Fulton) or empty vector using Lipofectamine® 2000. Resistant clones were selected with 700 µg/mL of G418, and then single clones were selected and maintained under G418 selection. For generating the NOX5‐inducible expression system, the Tet‐On 3G inducible expression system (#631167, Clontech) that contains the regulator plasmid pEF1α‐Tet3G and the response plasmid pTRE3G was used. To clone NOX5β into the pTRE3G vector, the pcDNA3‐NOX5β plasmid was digested with BamH1 and ECORV, and the pTRE3G vector was digested with BglII and ECORV. Subsequent to purification of the fragments and ligation using T4 ligase and transformation in DH5α competent cells, ampicillin‐resistant single bacterial colonies were isolated and the plasmid DNA was isolated (QIAprep® spin miniprep kit, #27104, Qiagen, Germantown, MD). Purified plasmid DNA was confirmed by restriction enzyme digestion and sequencing as the pTRE3G‐NOX5β expression plasmid.
To generate UACC‐257 cells that express inducible NOX5, parental UACC‐257 cells were transfected with the pEF1α‐Tet3G vector and clones that were resistant to G418 and constitutively express the Tet‐On 3G transactivator were selected. Positive clones were next transfected with the pTRE3G‐NOX5β expression vector along with a linear selection marker (Purr). After a second round of selection, double‐stable clones (G418 and puromycin resistant) that express high levels of NOX5 in response to doxycycline were established.
For gene silencing experiments, log‐phase cells (UACC‐257, PC‐3, WM852) were trypsinized and transfected with 5 nM of either control or three different NOX5 Stealth Select RNAi's (Stealth Select RNAi™ siRNA #HSS128401, #HSS128402, #HSS128403, Invitrogen) using the Lipofectamine™ RNAiMAX transfection reagent (#13778‐075, Invitrogen). After 72 h of transfection, silencing efficiency was analyzed by measuring NOX5 at the RNA level by TaqMan real‐time PCR and/or protein level by immunoblotting. Stealth scrambled siRNA transfections (Stealth RNAi Negative Control Duplexes #12935‐100, Invitrogen) were used as controls. Effect of transient NOX5 knockdown on the growth of WM852 cells was evaluated 6 days after log‐phase cells were trypsinized and transfected with 5 nM of either scrambled control siRNA or two different NOX5 Stealth Select RNAi's (Stealth Select RNAi™ siRNA #HSS128401 and #HSS128402, Invitrogen) using the Lipofectamine™ RNAiMAX transfection reagent (#13778‐075, Invitrogen). To evaluate the effect of HIF‐1α, UACC‐257 cells that stably overexpress NOX5 (Clone 3) and WM852 cells were transiently transfected with either control scrambled siRNA (Stealth RNAi Negative Control Duplexes #12935‐100, Invitrogen) or with two different HIF‐1α Silencer® Select RNAi's (#s6539 and #s6541, Invitrogen) using the Lipofectamine™ RNAiMAX transfection reagent (#13778‐075, Invitrogen) and evaluated 6 days after transfection.
To generate UACC‐257 cells that are stably knocked down for NOX5 expression, three different NOX5shRNA plasmids that target different sequences on NOX5, and the control shRNA plasmid, were purchased from Qiagen (#336313, KH17569N). Parental UACC‐257 cells were transfected with the four plasmids individually and selected with G418 at a concentration of 700 μg/ml. G418‐resistant clones were screened and examined for NOX5 expression at both the mRNA and protein levels; validated vector shRNA clones and NOX5shRNA clones derived from three different NOX5shRNA plasmids were maintained under G418 selection.
2.3. Immunohistochemical determination of NOX5 expression in human tumor tissue microarrays
Unstained slides from formalin‐fixed, paraffin‐embedded tissue microarray (TMA) blocks were purchased from US Biomax. These included: Colon disease tissue arrays #BC05002 and # CO809a; Breast invasive ductal carcinoma tissue array #BC08118; Breast cancer tissue array #BR1505b; Lung cancer tissue array #LC2085b; Mid‐advanced stage ovary cancer tissue array #OV8010; Prostate cancer tissue array #PR2085b; and Tissue array of gastritis with intestinal metaplasia and gastric carcinoma #IC00011. Melanoma stage III YTMA‐144‐4 array and Melanoma stage IV YTMA‐205‐2 array were a kind gift of Dr. Dave S. Hoon (John Wayne Cancer Institute, CA). NOX5 immunohistochemical (IHC) positive/negative control slides were prepared from a formalin‐fixed, paraffin embedded cell pellet control block. Immunohistochemical staining was performed with a Leica Biosystems’ Bond‐Max autostainer, beginning with heat‐induced epitope retrieval in citrate buffer. The Intense R Detection Kit (#DS9263, Leica Biosystems) was used in addition to a normal horse serum block (Vector Labs) and biotinylated horse anti‐mouse IgG (Vector Labs). NOX5 was used at 1:1000 for 30 min. Negative control slides were exposed to a normal mouse IgG2a isotype reagent (#550339, BD Bioscience) in place of primary antibody.
NOX5 expression was assessed in a comprehensive library of formalin‐fixed, paraffin‐embedded tissue samples (TMAs) of 2091 cases (that were found to be adequate for scoring) out of a total of 2414 tumors of various epithelial origins (colon, prostate, breast, small intestine, stomach, ovary), melanomas, as well as various inflammatory diseases and normal control tissues. Staining intensities were assessed by two pathologists as, 0 = negative/no or blush staining, 1+ = weak, 2+ = moderate, and 3+ = strong. The percentage of stained tumor/lesion cells was estimated for each case where, 0 = 0% to < 10% were considered negative, 1 = 10‐24%, 2 = 25‐49%, 3 = ≥50% of positive cells. Cases with moderate to strong cytoplasmic reactivity of the antibody on ≥10% of cells were considered high expressors.
2.4. RNA analysis: extraction, cDNA synthesis, and quantitative real‐time PCR assay
Total RNA was isolated from cells with the RNeasy Mini Kit (#74104, Qiagen, Germantown, MD) according to the manufacturer's protocol. RNA was treated with DNase (#79254, Qiagen) according to the manufacturer's specifications (Applied Biosystems, Austin, TX). RNA concentrations and purity were measured on the NanoDrop ND‐1000 apparatus (Thermo Fisher Scientific). First‐strand cDNA was synthesized with a high‐capacity RNA‐to‐cDNA™ kit (#4387406, Applied Biosystems) according to the manufacturer's guidelines. Primers were generated that were specific to each transcript,42 for NOX1, sense 5′‐TGGTCATGCAGCATTAAACTTT‐3′ and antisense 5′‐AAAACTCATTGTCCCACATTGG‐3′ (product size: 98 bp); NOX2, sense 5′‐GAGTCTCAGGCCAATCACTTTG‐3′ and antisense 5′‐AGTTGGGCCGTCCATACAAAGT‐3′ (product size: 94 bp); NOX3, sense 5′‐TTCTTCTGTGGACCTAAAGCTC‐3′ and antisense 5′‐AATAGAAATGAACACCTCTGGG‐3′ (product size: 91 bp); NOX4, sense 5′‐TGCAT AACAAGTTTTGGCAAGA‐3′ and antisense 5′‐ATCCCATCTGTTTGACTGAGGT‐3′ (product size: 76 bp); NOX5, sense 5′‐AAGACTCCATCACGGGGCTGCA‐3′ and antisense 5′‐CCCTTC AGCACCTTGGCCAGA‐3′ (product size: 144 bp); DUOX1 and 2, sense 5′‐CAGTTTG AGTGGCTGGCTGACA‐3′ and antisense 5′‐GAGGTCGAACTTCTCAGCCAGC‐3′ (product size: 108 bp). NOX5 may exist either as the long NOX5‐L or short NOX5‐S isoform. The sequence of NOX5‐S is the same as the sequence at the 3′ end of NOX5‐L. The primers (5′‐GGAGGATGCCAGGTGGCTCCGGT‐3′ and antisense 5′‐AGCCCCACTACCACGTAGCCC‐3′) covering a region of NOX5‐L, but not NOX5‐S, were used to determine which NOX5 isoform was present in UACC‐257 and SK‐MEL‐5 melanoma cell lines.42 The primers are also common to NOX5 isoforms α, β, γ, and δ. To further identify the long form variant of NOX5 present, primers designed for α and γ variants, sense 5′‐GGCCCTGAAGGCTGTAGAGGCA‐3′ and antisense 5′‐GCGCAGCTCATCCGGGTCAATG‐3′ (product size: 326 and 451 bp, respectively); and for β and δ variants, sense 5′‐ CAGGACGGTACTCCGCTGACACCTT‐3′ and antisense 5′‐GCGCAGCTCATCCGGGTCAATG‐3′ (product size: 577 and 661 bp, respectively) were generated.43 All PCR products were electrophoresed on 2% agarose gels.
For quantitative real‐time PCR, total RNA was extracted from cells using the RNeasy Mini Kit (#74104, Qiagen) following the manufacturer's instructions. Two microgram of total RNA was used for cDNA synthesis using SuperScript II reverse transcriptase (#100004925, Invitrogen) and random primers (#48190‐011, Invitrogen) in a 20 µL reaction system. The cycling conditions were as follows: 25°C for 5 min, 42°C for 50 min, 75°C for 5 min. After reaction, the products were diluted with diethyl pyrocarbonate/H2O to 100 µL for the real‐time PCR. Real‐time PCR was performed on 384‐well plates in a 20‐µL reaction system containing 2 µL of diluted cDNA, 1 µL of appropriate primer (Applied Biosystems TaqMan gene expression assay primers from Thermo Fisher Scientific; Human β‐Actin assay primer Hs99999903_m1; NOX5 assay primer Hs00225846_m1; Human HIF‐1α assay primer Hs00153153_m1; Human CDKN1B [p27Kip1] assay primer Hs00153277_m1; and Human SKP2 assay primer Hs01021864_m1), 7 µL of H2O, and 10 µL of TaqMan 2 × gene expression master mix reagent (#4304437). The PCR was carried out using the default cycling conditions, and fluorescence was detected with the ABI 7900HT sequence detection system (Applied Biosystems, Foster City, CA). Triplicate determinations were performed for each sample that was used for the real‐time PCR; the mean value was calculated, and the data in the final figures represents three independent experiments. Relative gene expression was calculated as the ratio of the target gene to the internal reference gene (β‐Actin) multiplied by 106 based on the C t values.
2.5. Intracellular ROS detection by confocal microscopy
For detection of intracellular ROS by confocal microscopy, cells were seeded in 6‐well plates at a density of 1 × 10⁶ cells per well in growth medium overnight. The next day the cells were washed twice with phosphate‐buffered saline (PBS, pH 7.4), and 10 µmol/L H2‐DCFDA in PBS was applied to live cells for 15 min at 37°C in the dark on the stage of a confocal microscope. H2‐DCFDA‐loaded cells were rinsed twice in PBS, and then either stimulated with 1 µmol/L ionomycin or exposed to medium for 5 min at 37°C in the dark. Confocal microscopy was performed using an Olympus Fluoview scanning unit equipped with an argon‐krypton laser at 488 nm mounted on an Olympus reflected fluorescence microscope (Olympus, Nagano, Japan). During scanning of H2‐DCFDA‐loaded cells, we observed that prolonged (more than 5 s) irradiation with the xenon lamp or slow scanning with the 488‐nm laser line caused probe oxidation and an artifactual increase in fluorescence. To avoid this artifact, the cells were initially brought into focus using standard epifluorescence (xenon lamp excitation). Then, the epifluorescence was switched off and the specimen was moved beyond the previously illuminated area. A single scan at one focal plane using minimum laser intensity (10%) was obtained, and the image was saved for subsequent measurement of fluorescence intensity with the Olympus proprietary Fluoview software.
2.6. Extracellular H2O2 measurement using Amplex Red®
The Amplex Red Hydrogen Peroxide/Peroxidase Assay Kit (#A22188, Invitrogen) was used to detect the extracellular H2O2 released by live cells. Briefly, log‐phase UACC‐257 cells stably overexpressing NOX5 (Clone 3) were either not treated or treated with 200 nmol/L of diphenyleneiodonium (DPI) for 2 h. The cells were then washed twice with 1 × PBS, trypsinized, and dispersed thoroughly to produce a 20‐µL cell suspension containing 2 × 10⁴ cells in 1 × KRPG (Krebs‐Ringer phosphate glucose) buffer. The cells were mixed with 100 µL of Amplex Red® reagent containing 50 µmol/L Amplex Red and 0.1 units/mL of horseradish peroxidase (HRP) in KRPG buffer with or without 1 µmol/L ionomycin or 500 nmol/L phorbol‐12‐myristate‐13‐acetate (PMA), and incubated at 37°C for 30 min. The fluorescence of the oxidized 10‐acetyl‐3,7‐dihydroxyphenoxazine was measured at an excitation wavelength of 530 nm and an emission wavelength of 590 nm using a SpectraMax Multiplate reader (Molecular Devices, Sunnyvale, CA). H2O2 was quantified using an H2O2 standard curve over a 0‐2 μmol/L concentration range. Each value in the figures represents a mean of triplicate samples.
2.7. Determination of superoxide generation using a chemiluminescence assay
Superoxide production was assessed with a commercially available superoxide anion assay kit (# CS1000‐1KT, Sigma‐Aldrich) utilizing the manufacturer's instructions. The kit is based on the oxidation of luminol by superoxide anion resulting in the formation of chemiluminescent light. A specific, non‐toxic enhancer amplifies the chemiluminescent signal. Briefly, 1 × 10⁶ cells cultured in growth medium were washed and resuspended in 100 μL of assay medium in 96‐well plates. To this, assay buffer containing the reagents for luminol oxidation and the enhancer were added to the samples in a final volume of 200 μL. The samples were mixed and placed immediately into a luminometer, and the chemiluminescence was measured every 30 s for 20 min. Assays were performed in triplicate. For treatment with DPI (200 nmol/L), cells were pretreated for 2 h in culture medium prior to the assay. To evaluate the effect of PMA and BAPTA on NOX5‐mediated ROS production, 100 μL assay buffer containing the reagents for luminol oxidation and the enhancer was prepared to contain either PMA (1 μL of a 40 μmol/L PMA stock solution) or BAPTA (1 μL of a 2 mmol/L BAPTA stock solution) or DMSO control (1 μL). This was then added to 100 μL of assay medium containing cells to yield a final concentration of 200 nmol/L PMA and 10 μmol/L of BAPTA in a total volume of 200 μL in 96‐well plates. The samples were mixed and placed immediately into a luminometer, and the chemiluminescence was measured every 30 s for 20 min at 37°C. The specificity of the superoxide assay was assessed by treatment with superoxide dismutase (SOD) provided in the kit. Under similar assay conditions, cells that stably overexpress NOX5 generated superoxide as measured by luminescence intensities in the range of >107 arbitrary units (see Supplementary Figure S2). To maintain luminescence intensities within comparable values to the UACC‐257 parental cells, vector, and NOX5 stable knockdown cells, only 100 000 cells/sample of UACC‐257‐NOX5 stably overexpressing cells were used (for Figure 3C, lower panel), and the assay was carried out in the absence of an enhancer.
Figure 3.
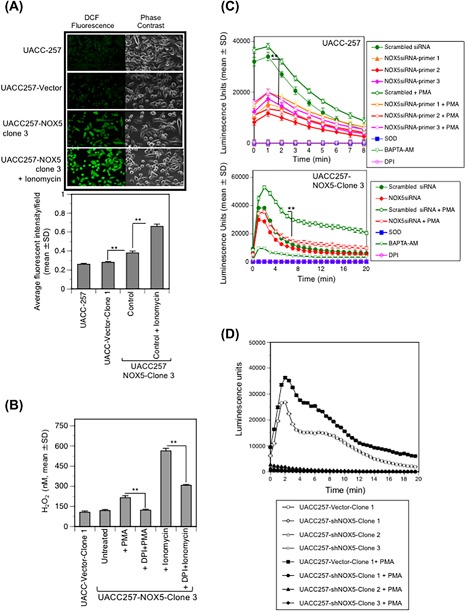
Intracellular and extracellular ROS produced by NOX5 in UACC‐257 cells is Ca2+‐ and flavin‐dehydrogenase dependent. (A) upper panel, Ionomycin induces NOX5‐mediated ROS production as measured by confocal microscopy. Live staining of log‐phase UACC‐257 cells was performed as described in section 2. Higher ROS levels were observed in UACC‐NOX5‐clone 3 cells stimulated with ionomycin (1 µmol/L) than in parental or vector transfected clones. Representative confocal images of ROS production as detected by DCF fluorescence (green) and corresponding phase‐contrast fields are shown. The lower panel provides the quantitation of fluorescent intensities for three separate experiments. (B) Extracellular ROS production by overexpression of NOX5 was detected after 30 min of treatment with the phorbol ester PMA (500 nmol/L) or by the Ca2+ ionophore ionomycin (1 µmol/L) using the Amplex Red assay. H2O2 levels were calculated with a standard curve of 0‐2 µmol/L H2O2. The NOX5 enzymatic activity is flavin dehydrogenase‐dependent since pretreatment of cells with the flavoprotein inhibitor DPI (200 nmol/L) for 2 h significantly decreased NOX5‐mediated ROS production. (C) Silencing NOX5 by RNAi significantly inhibited endogenous‐, overexpressed‐, and PMA‐stimulated ROS production. Parental UACC‐257 cells (upper panel) and the NOX5‐overexpressing clone 3 (lower panel) were transiently transfected with either control scrambled siRNA or NOX5‐specific siRNAs targeting different domains of human NOX5 (primers 1‐3). After 72 h of transfection, cells were trypsinized and analyzed for the effects of transient silencing of NOX5 expression on ROS production in the parental and NOX5‐overexpressing cells in the absence and presence of 200 nmol/L PMA (added immediately at the start of the assay) by luminol chemiluminescence assay. To inhibit NOX5 activity, scrambled siRNA control cells were either pretreated with DPI (200 nmol/L) for 2 h in culture medium or treated with BAPTA (10 µmol/L) at the time of the assay. SOD was used to confirm superoxide generation. (D) Log‐phase UACC‐257 cells that have been stably knocked down for NOX5 (UACC‐257‐shNOX5‐clones 1, 2, and 3) and its appropriate vector control cells (UACC257‐Vector‐Clone 1) were trypsinized and analyzed for the effects of stable knockdown of NOX5 expression on ROS production by luminol chemiluminescence assay in the absence and presence of 200 nmol/L PMA (added immediately at the start of the assay). Significant inhibition of both endogenous and PMA‐stimulated ROS production in UACC‐257 cells with stable knockdown of NOX5 expression (UACC‐257‐shNOX5‐clones 1, 2, and 3) relative to the appropriate vector control cells (UACC257‐Vector‐Clone 1) was observed. **, P < 0.01
2.8. Preparation of nuclear extracts and whole cell lysates
Nuclear extracts were prepared according to the instructions of the nuclear and cytoplasmic extraction kit (# 78833, Thermo Fisher Scientific). Briefly, cells were re‐suspended in 10 vol of CER I solution containing protease inhibitors, after which they were incubated in CER II solution on ice for 1 min and homogenized. Nuclei were recovered by centrifugation at 14 000 rpm for 5 min, and the supernatant was kept as the cytoplasmic extract. The nuclear pellet was suspended in NER solution containing protease inhibitors and kept on ice for 40 min. The insoluble pellet was removed by centrifugation at 14 000 rpm for 10 min. The supernatant was used as the nuclear extract. For whole cell lysates, cells were washed with PBS, harvested and lysed with 1 × RIPA lysis buffer (#20‐188, Millipore, Temecula, CA) with the addition of a phosphatase inhibitor tablet (#04‐906‐837001, Roche Applied Science, Indianapolis, IN) and a protease inhibitor tablet (Roche, #11‐836‐153001). Protein concentration was estimated using the Pierce™ BCA Protein Assay Kit (#23227, Thermo Fisher Scientific), and bovine serum albumin (BSA) was used as the standard.
2.9. Western analysis
The nuclear extracts and whole cell lysates were mixed with an equal volume of 2 × SDS protein gel loading buffer (#351‐082‐661, Quality Biological), and 40 µg of each was loaded onto a 4‐20% Tris glycine gel (# EC6028, Invitrogen). For detection of NOX5 expression, the extracts and lysates that were mixed with an equal volume of 2 × SDS loading buffer were not heated prior to loading onto gels. Subsequent to gel separation, the proteins were electrophoretically transferred onto nitrocellulose membranes using I Blot gel transfer stacks (#IB 3010‐01, Invitrogen). The membranes were blocked in 1 × TBST buffer with 5% nonfat milk for 1 h at room temperature followed by incubation with the primary antibody overnight in TBST buffer. Membranes were washed three times in 1 × TBST buffer and incubated with horseradish peroxidase‐conjugated secondary antibody for 1 h at room temperature with shaking. Subsequent to washes with TBST buffer, the antigen‐antibody complex was visualized using the SuperSignal West Pico Luminol/Enhancer Solution (#1856136, Thermo Fisher Scientific).
Densitometric analyses of every Western analysis in the manuscript was performed using the Image Studio™ Software (LI‐COR). For whole cell lysates, protein expression densitometric analysis of each sample was normalized to that of β‐Actin. For samples involving nuclear and cytoplasmic preparations, densitometric analysis was normalized to that of β‐Actin for cytoplasmic proteins and to that of Lamin A/C for nuclear proteins respectively. For p‐Akt (Ser473) and p‐GSK3β (Ser9), normalizations were done to their respective total Akt and GSK3β proteins.
2.10. Cell growth assay
Cell lines were plated in logarithmic‐phase of growth in tissue culture dishes and counted daily for 7 days using a cell counter (Cellometer Auto T4, Nexcelom Bioscience, Lawrence, MA). For experiments comparing growth of UACC‐257‐NOX5 overexpressing cells to the parental cells and vector controls, 10 000 cells were seeded, and for experiments comparing the growth of the UACC257‐shNOX5 cells relative to the parental cells and vector controls, 40 000 cells were seeded. Experiments were repeated at least three times with similar results. For transient knockdown of NOX5 and HIF‐1α in WM852 cells as well as transient knockdown of HIF‐1α in UACC‐257 cells that stably overexpress NOX5 (Clone 3), log‐phase cells were trypsinized, and 10 000 cells were transfected with 5 nM of either scrambled siRNA or gene specific siRNAs, and growth was evaluated by cell counts after 6 days. All transfections were carried out in triplicates, and the experiment was repeated in triplicates with similar results. To evaluate the effect of antioxidants and NADPH oxidase inhibitor on the growth of UACC‐257 cells that stably overexpress NOX5, log‐phase cells (50 000 cells/sample) of UACC‐257 parental, vector and NOX5 overexpressor lines were plated in triplicate. The following day, the NOX5‐overexpressing cells were either untreated or treated with catalase (500, 1000, and 2000 U/mL), NAC (2 and 5 mmol/L) or DPI (100 and 250 nmol/L) for 48 h followed by cell counts. Experiments were repeated at least three times with similar results.
2.11. Flow cytometry analysis of 5‐bromo‐2′‐deoxyuridine (BrdU) incorporation
BrdU incorporation into DNA was detected using an FITC BrdU Flow Kit (#559619, BD Biosciences, San Jose, CA). UACC‐257 cells were serum starved for 24 h and then cultured in serum‐containing media for 24 h. Cells were pulse‐labeled with 10 µmol/L BrdU during the last 30 min of incubation in serum‐containing media. The labeled cells were collected by trypsinization, centrifuged, and fixed in BD Cytofix/Cytoperm Buffer. Cells were then permeabilized with BD Cytoperm Permeabilization Buffer Plus, and fixed again with BD Cytofix/Cytoperm Buffer. BrdU epitopes were exposed by re‐suspending the tumor cells in DNase (30 μg DNase/106 cells) at 37°C for 1 h. BrdU was stained with a fluorochrome‐conjugated anti‐BrdU antibody (1:50 dilution, room temperature for 20 min). Total DNA was stained with 20 μL of a 7‐aminoactinomycin D (7‐AAD) solution (provided with the Kit) using a 5 min incubation. Tumor cells were then resuspended in 1 mL PBS. Stained cells were subsequently analyzed using a FACS Calibur Flow Cytometer (Becton Dickinson, San Jose, CA) equipped with a 488‐nm laser capable of detecting both 7‐AAD and FITC.
2.12. H2AX ELISA assay
For the γ‐H2AX immunoassay,44 96‐well Pierce white opaque plates were coated with anti‐phospho‐Histone H2AX (S139) mouse monoclonal antibody (Millipore, # 05‐636) diluted to a concentration at 4 μg/mL in 0.1 M pH 9.6 carbonate buffer (Sigma Aldrich), 100 μL/well, for 2 h at 37°C. Plates were then blocked with 250 μL/well of Superblock (Pierce) for 1 h at 37°C. 75 μL of either a γ‐H2AX synthetic peptide standard or whole cell extract (UACC‐257 parental, vector, and NOX5 over expressor) was then added to each well and incubated for 18 ± 2 h at 4°C. Plates were then incubated with 100 μL/well of 2 μg/mL histone H2AX rabbit polyclonal antibody (Abcam, # ab11175) diluted in 2% BSA/PBS, supplemented with 1 μL/mL mouse serum for 2 h at 24°C. A total of 100 μL/well HRP‐conjugated affinity‐purified goat anti‐rabbit antibody (KPL, Inc.) was added at a final concentration of 1 μg/mL diluted in 2% BSA/PBS supplemented with 1 μL/mL mouse serum and incubated for 1 h at 24°C. Finally, 100 μL/well of freshly prepared SuperSignal ELISA Pico Chemiluminescent Substrate (Pierce) was added to the plate and immediately read on a Tecan Infinite M200 Pro plate reader. The RLU (relative light unit) values were exported as an Excel file from the plate reader and pasted into a pre‐set γ‐H2AX analysis template. This template automatically generated the γ‐H2AX standard curve. The average γ‐H2AX level for each cell extract was then determined using the standard curve.
2.13. Statistical analysis
Results are expressed as the mean ± S.D. from at least triplicate experiments. Statistical differences between mean values of control and treated samples were assessed using Student's t test; P < 0.05 was considered statistically significant. Significance levels were designated as **, P < 0.01 and ***, P < 0.001 throughout.
3. RESULTS
3.1. Human melanomas and melanoma cell lines as well as epithelial malignancies express NOX5
Recently, our laboratory reported substantial expression of NOX5 in several human cancers with weak expression in non‐malignant tissues.22 Additionally, an initial screening of human tumor cell lines, including the NCI‐60 cancer cell line panel, as well as an evaluation of tumor and adjacent normal tissues from surgical resections, also demonstrated NOX5 expression in breast, prostate, and melanoma cancer cell lines, as well as in human melanomas that had been removed at surgery.45 To broaden the scope of our initial findings and substantiate the relevance of NOX5 expression in various tumors, here we performed a comprehensive analysis of the frequency of NOX5 expression over a wide range of tumor microarrays. As observed in Figure 1, with representative images of NOX5 expression in various tumors, significant expression of NOX5 was observed in melanoma and cancers of the prostate and breast. Tables 1 and S1 demonstrate expression of NOX5 in 680/750 melanomas (91%), 132/147 colon cancers (90%), 219/230 breast carcinomas (95%), 96/161 ovarian carcinomas (60%), and 152/175 prostate cancers (87%). Normal human breast and prostate tissues exhibited NOX5 positive staining; however, both staining intensity and the percentage of positive cells was lower than in the corresponding tumors. Positive but weak NOX5 staining was observed for 60/85 small intestinal carcinomas (70%), 9/23 stomach carcinomas (39%), and 46/150 lung carcinomas (31%).
Figure 1.
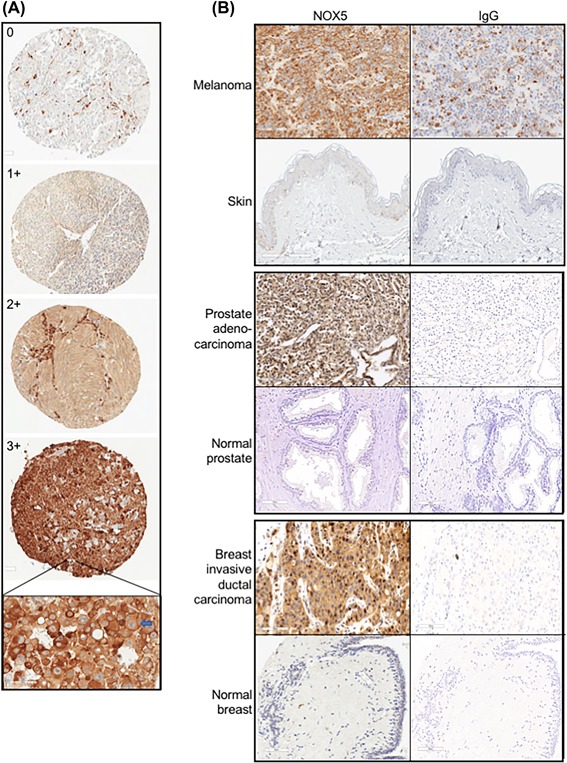
Patterns of expression of NOX5 in human multi‐tumor microarrays. (A) Representative images for NOX5 positivity to define the criteria for 0 (negative), 1+ (weak), 2+(moderate), and 3+ (high positive) scoring of NOX5 staining intensity. All represented images are melanoma cases, ×100 magnification; hematoxylin counterstained. Inset, Strong predominantly cytoplasmic and focal membranous expression of NOX5 in a lymph node metastatic melanoma (blue arrow). Image, ×350 magnification; hematoxylin counterstained. (B) NOX5 expression in malignant melanoma (upper panel), prostate adenocarcinoma (middle panel), and invasive ductal carcinoma of the breast (lower panel) relative to their corresponding normal tissue. IstoypeIgG staining controls are also represented. All images, ×200 magnification; hematoxylin counterstained
Table 1.
Immunohistochemical analysis of NOX5 expression in melanoma, prostate and breast tumors, and normal tissues
| Organ | Tumor type/Pathologic diagnosis | No. [+] (%) | No. [−] (%) | Low expressors (weak); No. (%) | High expressors (Moderate + Strong); No. (%) | Staining pattern C = Cytoplasmic, M = Membranous |
|---|---|---|---|---|---|---|
| All | Melanoma | 680/750 (91%) | 70/750 (9%) | 311/680 (46%) | 369 (54%) | C, occasional M |
| Cell line | Melanoma | 13/13 (100%) | 0/13 (0%) | 4/13 (31%) | 9 (69%) | C |
| Skin | Normal | 0/3 (0%) | 3/3 (100%) | 0/3 (0%) | 0 (0%) | |
| Regional skin | Melanoma | 10/10 (100%) | 0/10 (0%) | 5 (50%) | 5 (50%) | C |
| Distant skin | Melanoma | 79/85 (93%) | 6 (7%) | 35 (44%) | 44 (55%) | C |
| Lymph node | Melanoma | 251/272 (92%) | 21 (8%) | 112 (45%) | 139 (55%) | C |
| Sentinel lymph node | Melanoma | 11/12 (92%) | 1 (8%) | 4 (36%) | 7 (64%) | C |
| Soft tissue | Melanoma | 9/12 (75%) | 3 (25%) | 3 (33%) | 6 (67%) | C |
| Muscle | Melanoma | 16/19 (84%) | 3 (16%) | 9 (56%) | 7 (44%) | C |
| Bone | Melanoma | 11/11 (100%) | 0 (0%) | 7 (64%) | 4 (36%) | C |
| Brain | Melanoma | 16/19 (84%) | 3 (16%) | 3 (18%) | 13 (82%) | C |
| Lung | Melanoma | 71/78 (90%) | 7 (10%) | 32 (45%) | 39 (55%) | C |
| Bowel | Melanoma | 87/95 (92%) | 8 (8%) | 50 (57%) | 37 (43%) | C |
| Stomach | Melanoma | 10/12 (83%) | 2 (17%) | 8 (80%) | 2 (20%) | C |
| Liver | Melanoma | 22/24 (92%) | 2 (8%) | 8 (36%) | 14 (64%) | C |
| Spleen | Melanoma | 14/16 (88%) | 2 (12%) | 7 (50%) | 7 (50%) | C |
| Pancreas | Melanoma | 18/20 (90%) | 2 (10%) | 10 (55%) | 8 (44%) | C |
| Gallbladder | Melanoma | 2/2 (100%) | 0 (0%) | 1 (50%) | 1 (50%) | C |
| Adrenal gland | Melanoma | 25/32 (78%) | 7 (22%) | 8 (32%) | 17 (68%) | C |
| Kidney | Melanoma | 9/11 (82%) | 2 (18%) | 1 (11%) | 8 (89%) | C |
| Ovary | Melanoma | 6/6 (100%) | 0 (0%) | 3 (50%) | 3 (50%) | C |
| Peritoneum | Melanoma | 13/14 (93%) | 1 (7%) | 5 (38%) | 8 (62%) | C |
| Lymph node | Normal | 7/24 (29%) | 17 (71%) | 4 (57%) | 3 (43%) | C |
| Sentinel lymph node | Normal | 2/6 (33%) | 4 (67%) | 2 (100%) | 0 (0%) | C |
| Muscle | Normal | 0/3 (0%) | 3 (100%) | 0 (0%) | 0 (0%) | |
| Bone | Normal | 0/2 (0%) | 2 (100%) | 0 (0%) | 0 (0%) | |
| Brain | Normal | 1/3 (33%) | 2 (67%) | 1 (100%) | 0 (0%) | C |
| Lung | Normal | 0/3 (0%) | 3 (100%) | 0 (0%) | 0 (0%) | |
| Bowel | Normal | 2/2 (100%) | 0 (0%) | 0 (0%) | 2 (100%) | C |
| Liver | Normal | 7/8 (88%) | 1 (12%) | 1 (14%) | 6 (86%) | C |
| Spleen | Normal | 0/4 (0%) | 4 (100%) | 0 (0%) | 0 (0%) | |
| Pancreas | Normal | 3/3 (100%) | 0 (0%) | 0 (0%) | 3 (100%) | C |
| Gallbladder | Normal | 2/4 (50%) | 2 (50%) | 1 (50%) | 1 (50%) | C |
| Adrenal | Normal | 3/3 (100%) | 0 (0%) | 0 (0%) | 3 (100%) | C |
| Kidney | Normal | 0/1 (0%) | 1 (100%) | 0 (0%) | 0 (0%) | |
| Ovary | Normal | 0/2 (0%) | 2 (100%) | 0 (0%) | 0 (0%) |
| Organ: Prostate | ||||||
|---|---|---|---|---|---|---|
| Tumor type/Pathologic diagnosis | Subtype | No. [+] (%) | No. [−] (%) | Low expressors (weak); No. (%) | High expressors (Moderate + Strong); No. (%) | Staining Pattern C = Cytoplasmic, M = Membranous |
| Carcinoma (All) | 152/175 (87%) | 23/175 (13%) | 124 (82%) | 28 (18%) | C | |
| Adenocarcinoma | 148/171 (87%) | 23/171 (13%) | 122 (82%) | 26 (18%) | C/stromal | |
| Transitional cell carcinoma | 4/4 (100%) | 0/4 (100%) | 2 (50%) | 2 (50%) | C/luminal secretion/stromal | |
| Normal (All) | 17/17 (100%) | 0/17 (0%) | 15 (88%) | 2 (12%) | C/luminal secretion/stromal | |
| Normal prostate tissue | 6/6 (100%) | 0/6 (0%) | 4 (67%) | 2 (33%) | C/luminal secretion/stromal | |
| Adjacent normal prostate tissue | 11/11 (100%) | 0/11 (0%) | 11 (100%) | 0 (0%) | C/luminal secretion/stromal | |
| Organ: Breast | ||||||
| Carcinoma (All) | 219/230 (95%) | 11/230 (5%) | 148 (68%) | 71 (32%) | C | |
| Invasive ductal carcinoma | 211/219 (96%) | 8/219 (4%) | 140 (66%) | 71 (34%) | C | |
| Invasive lobular carcinoma | 4/5 (80%) | 1/5 (20%) | 4 (100%) | 0 (0%) | C | |
| Tubular carcinoma | 1/1 (100%) | 0/1 (0%) | 1 (100%) | 0 (0%) | C | |
| Mucinous carcinoma | 1/1 (100%) | 0/1 (0%) | 1 (100%) | 0 (0%) | C | |
| Medullary carcinoma | 2/4 (50%) | 2/4 (50%) | 2 (100%) | 0 (0%) | C | |
| Normal (All) | 5/6 (83%) | 1/6 (17%) | 4 (80%) | 1 (20%) | C | |
| Normal breast tissue | 1/1 (100%) | 0/1 (0%) | 0 (0%) | 1 (100%) | C | |
| Cancer adjacent normal breast | 4/5 (80%) | 1/5 (20%) | 4 (100%) | 0 (0%) | C | |
Relative staining intensities observed for NOX5 expression are represented in columns 3 and 4. Staining intensities for NOX5 expression was assessed as either 0/−, negative/no or blush staining; 1+, weak, 2+, moderate; and 3+, strong. Cases with NOX5 staining intensities (1+, 2+, and 3+) are represented in column 3 [+], and cases negative for NOX5 staining are represented in column 4 [−]. Additionally, the percentage of stained tumor/lesion cells was also estimated for each case where, 0, 0% to <10% were considered negative; 1, 10‐24%, 2, 25‐49%, 3, ≥50% of positive cells. Cases with moderate to strong cytoplasmic reactivity of the antibody on ≥10% of cells were considered high 'expressors (column 6). NOX5 staining pattern observed is denoted as either cytoplasmic (C) or membranous (M).
Significant expression of NOX5 observed in malignant melanomas prompted us to evaluate the relative expression of NOX5 across a panel of human melanoma cell lines. Figure 2A shows the expression of NOX5 mRNA across the 22 human melanoma cell lines screened. A wide range of expression was observed across the cell line panel with low, intermediate, and high level NOX5 mRNA expressors. RT‐PCR was performed in the moderate to high NOX5 expressing SK‐MEL‐5 and UACC‐257 cells with specific primers that detect the seven homologs of the NADPH oxidases. A PCR product corresponding to the expected NOX5 sequence (144 bp) was detected in both of these melanoma cell lines (Supplementary Figure S1).42 Expression of other NOX family members was minimal or undetectable. To further delineate the NOX5 variant present in these melanoma cell lines, primers were designed that would generate PCR products of 326 bp for NOX5α, 577 bp for NOX5β, 451 bp for NOX5γ, and 661 bp for NOX5δ.43 RT‐PCR revealed that the human melanoma cells express the long form functional variants of NOX5 (NOX5‐L); UACC‐257 cells expresses NOX5α and NOX5γ, and the SK‐MEL‐5 line expresses all four (α, β, γ, and δ) NOX5 variants (Supplementary Figure S1).
Figure 2.
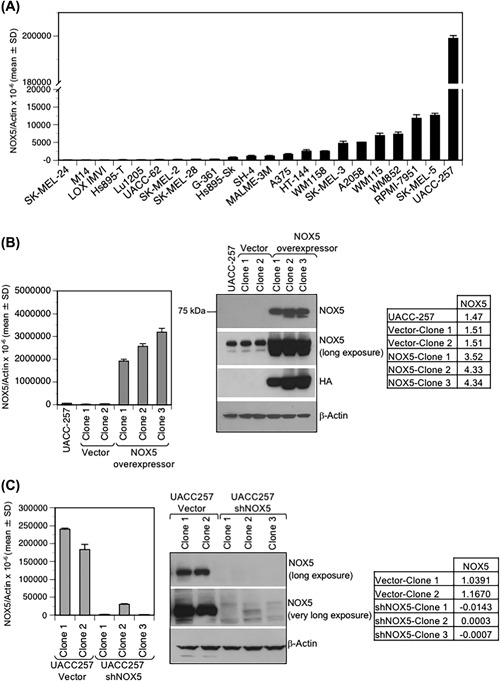
NOX5 expression in human melanoma cell lines. Total RNA was extracted from human melanoma cell lines. (A) Quantitative real‐time PCR was carried out to detect endogenous NOX5 expression. Values are expressed relative to β‐Actin. (B and C) Stable overexpression (B) and stable knockdown (C) of NOX5 in UACC‐257 cells. UACC‐257 cells were transfected with either the vector pcDNA 3.1 or pcDNA3‐HA‐NOX5β plasmid for stable NOX5 overexpression (B); and with either scrambled shVector or shNOX5 plasmids for stable NOX5 knockdown (C). Several clones were isolated after G418 selection, of which two clones (Clone 1 and 2) for each of the vector plasmids (pcDNA 3.1 and scrambled sh) and three clones (Clone 1, 2, and 3) for both the NOX5‐overexpressing and NOX5‐knockdown were evaluated for further studies. NOX5 expression was confirmed at the mRNA level (left panel; B and C) and at the protein level (right panel; B and C). To visualize endogenous expression of NOX5 relative to the NOX5 overexpressors and the decrease of NOX5 expression in the NOX5 knockdowns relative to the endogenous NOX5, additional NOX5 (long exposure [2‐5 min] and very long exposure [5‐10 min] of film) panels are represented. The HA‐tag expression confirmed the specificity of the antibody for NOX5 expression. Tables on the right (panels B and C) represent the densitometric expression of NOX5 protein expression (long exposure) relative to that of β‐Actin
To further investigate the role of NOX5 in human melanoma, subsequent studies were carried out in UACC‐257 cells that endogenously have moderately high NOX5 expression. Additionally, modulation of NOX5 levels in these cells was achieved by generating stable NOX5 overexpressing (Figure 2B) and NOX5 knockdown (Figure 2C) UACC‐257 clones. To generate stable NOX5‐overexpressors, parental UACC‐257 cells were transfected with either the vector control pcDNA 3.1 or the pcDNA‐HA‐NOX5β plasmid. Several stable transfectant clones that overexpress HA‐tagged‐NOX5 as well as the vector alone were generated and screened. Of these, vector clones (UACC257‐Vector Clones 1 and 2) and stable NOX5‐overexpressors (UACC257‐NOX5‐ Clones 1, 2, and 3) were evaluated for NOX5 mRNA expression by quantitative real‐time PCR and NOX5 protein expression by Western analysis (Figure 2B, left and right panel, respectively). Subsequent functional studies were carried out using vector clone 1 and NOX5‐overexpressor clone 3. To generate stable NOX5 knockdown cells, parental UACC‐257 cells were transfected with either a scrambled shVector or shNOX5 plasmid. Three different shNOX5 plasmid sequences targeting distinct sequences of NOX5 were used. After selection and screening (detailed in section 2), two UACC257‐shVector clones (Clones 1 and 2) and three UACC257‐shNOX5 clones containing different NOX5 targeting sequences (Clones 1, 2, and 3) were validated for NOX5 expression levels by both real‐time PCR and Western analysis (Figure 2C, left and right panels, respectively).
3.2. Endogenous NOX5 and its stable overexpression in UACC‐257 cells has functional oxidase activity that is FAD‐ and Ca2+‐dependent and inducible by PMA and ionomycin
To assess the correlation between endogenous and overexpressed NOX5 levels and functional NOX activity, production of both intracellular and extracellular ROS was determined. Intracellular ROS production was visualized by confocal microscopy using the redox‐sensitive dye H2‐DCFDA. As observed in Figure 3A (upper panel), increased levels of green fluorescence (DCF) were observed in UACC257‐NOX5 overexpressing cells compared to the parental or vector‐transfected UACC‐257 cells, indicative of increased intracellular ROS production. Additionally, exposure to the calcium ionophore ionomycin significantly enhanced the DCF fluorescence in the NOX5‐overexpressing cells by about 2.5‐fold compared to both the parental and vector controls (Figure 3A, lower panel). A similar increase in intracellular ROS levels that was further enhanced by ionomycin was observed in the UACC‐NOX5 overexpressing cells by flow cytometry (data not shown). These results are in concert with previous studies that have demonstrated the enhancement of NOX5 activity by calcium ionophore, consistent with its EF‐hand Ca2+‐binding domains.35, 36, 46 Extracellular H2O2 production was detected using the Amplex Red reagent in conjunction with HRP. As shown in Figure 3B, NOX5 can be activated both by the protein kinase C enhancing phorbol ester PMA,47, 48 and by the Ca2+ ionophore ionomycin to generate extracellular H2O2 (P < 0.05).47, 48, 49 Furthermore, NOX5 activity is inhibited by nanomolar concentrations of the flavoprotein inhibitor diphenyleneiodonium (DPI; 200 nmol/L which produces very modest effects on the electron transport chain)50, 51 as evidenced by a significant inhibition of PMA‐ and ionomycin‐mediated H2O2 production (Figure 3B).
We next determined extracellular superoxide production by the luminol chemiluminescence assay and validated that the measured ROS is NOX5‐mediated by using siRNA to specifically downregulate all isoforms of NOX5. In Figure 3C, parental UACC‐257 cells (upper panel) were transiently transfected with either a non‐specific scrambled siRNA or with three different NOX5 siRNA primers (primers 1, 2, and 3) and evaluated for superoxide production after 3 days. Figure 3C (upper panel) shows that extracellular superoxide production in UACC‐257 cells transfected with scrambled siRNA was modestly enhanced by the phorbol ester PMA. However, cells transfected with three different NOX5 siRNA primers showed a significant decrease in superoxide production and failed to increase superoxide production when treated with PMA (Figure 3C, upper panel). Likewise, when the stable UACC257‐NOX5 overexpressing clone 3 was transiently transfected with either a scrambled siRNA or NOX5 siRNA (Figure 3C, lower panel), a modest decrease in superoxide production was observed in the uninduced condition, whereas, NOX5 siRNA transfection significantly inhibited PMA‐induced superoxide production. Pretreatment of both the scrambled transfected UACC‐257 and UACC257‐NOX5 overexpressing cells with 200 nmol/L DPI for 2 h significantly inhibited superoxide production. Addition of the intracellular calcium chelator BAPTA‐AM (10 µmol/L) or superoxide dismutase (SOD) at the time of the assay also essentially abolished superoxide production, indicative of functional NOX5‐mediated superoxide formation in UACC‐257 cells. Accordingly, Figure 3D shows the stable NOX5 knockdown clones of UACC‐257 that have a significant decrease in superoxide production compared to the vector control and that fail to increase superoxide production when treated with PMA, confirming the ROS to be NOX5‐mediated.
3.3. NOX5‐derived ROS regulates normoxic HIF‐1α and p27Kip1 expression in tumor cell lines of varying histological origins
Because ROS have previously been shown to be part of the signaling cascades regulating HIF‐1α under non‐hypoxic conditions,52 we investigated whether NOX5‐mediated ROS can regulate HIF‐1α in UACC‐257 cells. As shown in Figure 4A, under normoxic conditions, increased levels of HIF‐1α protein were observed in NOX5 overexpressing clones. Conversely, decreased HIF‐1α protein levels were observed in NOX5 knockdown clones (shNOX5). Enhanced normoxic HIF‐1α levels were inversely correlated with the levels of the cell cycle regulatory protein p27kip (Figures 4A and S2A). To validate our observation that NOX5 overexpression was associated with increased normoxic HIF‐1α and decreased p27kip levels, the effect of NOX5 knockdown was next evaluated (Figures 4B and 4C, and Supplementary Figures S2B and S2C). To this end, NOX5 was transiently depleted by siRNA in the NOX5‐overexpressing clone 3 (Figures 4B and S2B) and in parental UACC‐257 cells (Figures 4C and S2C) with different NOX5‐specific siRNAs (primers 1‐3). Compared with untransfected cells or cells transfected with scrambled control siRNA, HIF‐1α protein levels were markedly reduced in NOX5‐depleted cells (Figures 4B and 4C, and Supplementary Figures S2B and S2C). A corresponding increase in p27Kip1 expression was observed in cells that were knocked down for NOX5 expression (Figures 4B and 4C, and Supplementary Figures S2B and S2C). Consistent with what we observed for NOX5 overexpression (Figures 4A and S2A), knockdown of NOX5 expression in both parental UACC‐257 cells and NOX5‐overexpressing clones reversed the expression levels previously observed: decreasing HIF‐1α and increasing p27Kip1 levels. Here, we identify for the first time that HIF‐1α and p27Kip1 are key molecules regulated by NOX5‐mediated ROS in UACC‐257 cells.
Figure 4.
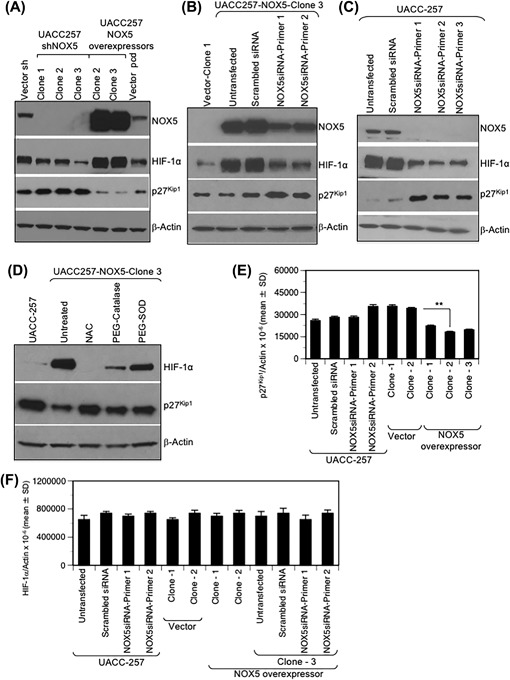
NOX5 expression levels in human UACC‐257 melanoma cells affect normoxic HIF‐1α and p27Kip1 expression. (A) Whole cell lysates from log‐phase UACC‐257‐vector control clones (scrambled‐sh and pcDNA3.1), UACC257‐shNOX5 clones (1‐3), and UACC257‐NOX5‐overexpressing clones (2 and 3) were prepared and analyzed by Western blotting. NOX5 overexpression in UACC‐257 cells results in decreased p27Kip1 expression as well as increased normoxic HIF‐1α expression. Conversely, decreased normoxic HIF‐1α and corresponding increased p27Kip1 expression was observed in NOX5 knockdown cells. (B and C) Transient knockdown with NOX5‐specific siRNA primers targeting different domains of human NOX5 in the stably overexpressing NOX5 clone (B) and parental UACC‐257 cells (C) results in decreased normoxic HIF‐1α and corresponding increased p27Kip1 expression. (D) Increased normoxic HIF‐1α and decreased p27Kip1 expression observed in NOX5‐overexpressing cells is ROS‐dependent. The NOX5‐overexpressing UACC257 clone was treated with NAC or PEG‐Catalase or PEG‐SOD and examined by Western analysis. Densitometric analysis of western blot analyses (Panels A‐D) of the expression of the various proteins relative to that of β‐Actin are represented in Supplementary Figure S3. (E) Total RNA was isolated from log phase parental UACC‐257 cells, UACC‐257 cells that were transiently transfected with either scrambled control or two different NOX5‐specific siRNAs, and UACC‐257 clones that stably overexpress either NOX5 or the vector. Real‐time PCR analysis of p27Kip1 mRNA expression levels are expressed relative to β‐Actin. (F) Total RNA from parental UACC‐257 cells and stable NOX5‐overexpressing clone 3 cells transiently transfected with either a scrambled siRNA or NOX5‐specific siRNAs, stable vector clones and two additional NOX5 overexpressing clones were isolated. Real‐time PCR analysis of HIF‐1α mRNA levels are expressed relative to β‐Actin. **, P < 0.01
To confirm the functional relevance of NOX5‐generated ROS in the observed increase of normoxic HIF‐1α, the NOX5‐overexpressing cells (UACC257‐NOX5‐Clone 3) were either treated with the reduced thiol and glutathione precursor N‐Acetyl‐L‐Cysteine (NAC, 10 mmol/L, 24 h), PEG‐Catalase (2000 U/mL, 24 h), or PEG‐SOD (150 U/mL, 24 h). Treatment with NAC completely prevented NOX5‐mediated normoxic HIF‐1α upregulation and p27Kip1 downregulation, suggesting the involvement of ROS in this response (Figures 4D and S2D). A similar, albeit lesser, decrease of the normoxic HIF‐1α levels and increase in p27Kip1 levels was observed with both PEG‐Catalase and PEG‐SOD treatment (Figures 4D and S2D). Further investigation revealed that the decrease in p27Kip1 levels in our stable NOX5 overexpressing cells could, in part, be transcriptionally regulated because of a modest decrease observed in p27Kip1 mRNA expression following NOX5 overexpression (Figure 4E). Quantitative real‐time PCR confirmed that the accumulation of normoxic HIF‐1α is likely a translational event, rather than due to a transcriptional regulation, because no accumulation of HIF‐1α transcripts was observed with either NOX5 knockdown or overexpression (Figure 4F).
To evaluate NOX5‐mediated effects on normoxic HIF‐1α and p27Kip1 levels further, additional cell types including an inducible NOX5‐overexpressing UACC‐257 system, human WM852 melanoma cells, human KARPAS 299 lymphoma cells, and human PC‐3 prostate cancer cells were examined. As demonstrated in Supplementary Figure S3, inducible NOX5‐overexpression in UACC‐257 cells (Supplementary Figure S3A), stable NOX5 overexpressing KARPAS 299 cells (Supplementary Figure S3B), and stable NOX5 overexpressing PC‐3 cells (Supplementary Figure S3C) is functional and generates ROS as measured by luminol chemiluminescence. Functional NOX5 overexpression in these cells also produces normoxic HIF‐1α upregulation and p27Kip1 downregulation (Supplementary Figure S4A). Conversely, in the WM852 melanoma line, transient knockdown of endogenous NOX5 results in HIF‐1α downregulation and p27Kip1 upregulation (Supplementary Figure S4B). Likewise, knockdown of endogenous NOX5 in parental PC‐3 cells leads to p27Kip1 upregulation, and knockdown of overexpressed NOX5 in PC‐3 cells demonstrates HIF‐1α downregulation (Supplementary Figure S4C). These results strongly suggest that HIF‐1α stabilization and p27Kip1 levels are regulated, at least in part, through NOX5‐mediated ROS production in human tumor cells.
3.4. Regulation of nuclear p27Kip1 accumulation by NOX5‐mediated ROS
It has been documented that reactive oxygen production may be linked to either up‐ or down‐regulation of p27Kip1 expression, depending on cell context. As shown in Figure 4, UACC‐257 cells exhibit decreased p27Kip1 expression when NOX5 expression is increased, and conversely, increased p27Kip1 levels when NOX5 expression is knocked down. To further investigate the ROS‐mediated regulation of p27Kip1 levels in the context of NOX5 expression levels, parental UACC‐257 cells were transiently transfected with two different NOX5 specific siRNAs and their effects on p27Kip1 localization and phosphorylation were evaluated (see Figures 5A and S5A). Decreased expression of NOX5 leads to accumulation of p27Kip1 both in the cytoplasm and the nucleus. Similarly, transient knockdown of NOX5 expression with siRNAs in UACC257‐NOX5 overexpressing cells also demonstrated an increase of p27Kip1 accumulation both in the cytoplasm as well as the nucleus (Figures 5B and S5B). The phosphorylation of p27Kip1 at T157 and S10 were not significantly altered (Figures 5A and S5A). However, alterations in the expression of known regulators of p27Kip1 were observed following NOX5 depletion. A decrease in the phosphorylation of Akt at Ser473 and a decrease in the phosphorylation of GSK3β at Ser9 with no significant effect on the expression of the corresponding total proteins were observed upon knockdown of NOX5 expression (Figures 5A and S5A).
Figure 5.
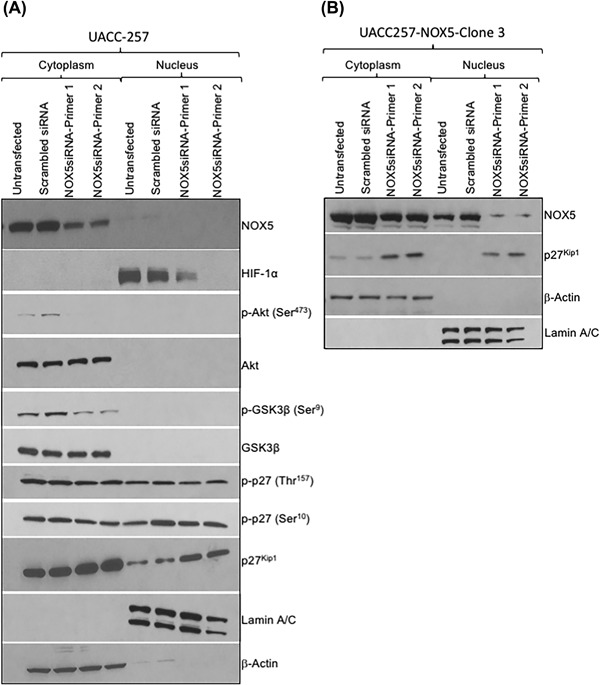
Increased nuclear and cytoplasmic p27Kip1 following knockdown of both endogenous and overexpressed NOX5 in UACC‐257 cells. To assess the translational regulation of p27Kip1 by NOX5, log‐phase parental UACC‐257 cells (A) or UACC‐NOX5 overexpressing clone 3 (B) were transfected with either scrambled or two different NOX5‐specific siRNAs. Nuclear and cytoplasmic extracts were prepared 72 h after transfection, and the expression levels of various proteins were examined by Western analysis. Blots are representative of HIF‐1α, NOX5, Akt, phospho‐Akt (Ser473), GSK3β, phospho‐GSK3β (Ser9), p27Kip1, phospho‐p27Kip1 (Thr157 and Ser10), Lamin A/C, and β‐Actin expression from three independent experiments. Densitometric analyses of the Western blots from panels A and B for the expression of the various proteins are represented in Supplementary Figure S5
To examine the physiological relationship between NOX5, HIF‐1α, and p27Kip1expression status and to determine whether NOX5‐mediated regulation of p27Kip1 expression is HIF‐1α dependent, expression levels of normoxic HIF‐1α transcript levels (Supplementary Figure S6A) and protein levels (Supplementary Figure S6B) across a panel of melanoma cell lines were evaluated. No significant correlation of expression of HIF‐1α levels in normoxia to endogenous NOX5 levels was observed. However, transient knockdown of HIF‐1α under normoxic conditions in UACC‐257 cells that stably overexpress NOX5 (Supplementary Figure S6C), and in an additional melanoma WM852 cell line (Supplementary Figure S6D), resulted in a slight increase of p27Kip1 protein levels, suggesting that the regulation of p27Kip1 expression directly by HIF‐1α is minimal or modest at best.
Another known mechanism governing p27Kip1 regulation is S‐phase kinase‐associated protein 2 (SKP2)‐mediated degradation.53 To assess whether the NOX5‐related decrease in p27Kip1 expression is dependent on or mediated in part by SKP2, the relevance of SKP2 expression to NOX5 and p27Kip1 was evaluated. No significant correlation between the expression status of SKP2 and NOX5 was observed in a panel of melanoma cell lines (compare Supplementary Figures S7A and S7B with Figure 2A). Additionally, comparing UACC‐257 cells that have been genetically altered for NOX5 expression (stable NOX5 knockdown and stable NOX5 overexpression) did not show alterations in SKP2 levels (Supplementary Figure S7C), suggesting that NOX5‐mediated regulation of p27Kip1 is not SKP2 mediated. While multiple mechanisms are involved in the regulation of p27Kip1 accumulation, taken together, our results suggest that independent of HIF‐1α and SKP2, NOX5‐mediated ROS may regulate p27Kip1and the Akt/GSK3 signaling pathways.
3.5. NOX5 expression modulates γH2AX levels and growth of human UACC‐257 melanoma cells
We next evaluated the effect of NOX5 expression on the growth of UACC‐257 cells. As shown in Figure 6A, the UACC257‐NOX5 overexpressing cells exhibit enhanced cell proliferation when compared to either the parental or the vector control (three independent experiments; P < 0.01). This enhanced cell growth was also supported by measurement of BrdU incorporation in cells that were starved for 24 h and subsequently released in growth medium for an additional 24 h; NOX5 overexpressors demonstrate an ∼1.5‐ to 2‐fold increase in the number of BrdU positive cells relative to the parental and vector control cells (Figure 6B). To assess whether the enhanced cell growth observed in the UACC257‐NOX5 overexpressing cells was ROS‐mediated, the UACC257‐NOX5 overexpressing cells were treated with either antioxidants (catalase and NAC) or the flavoprotein inhibitor DPI. Figure 6C shows a dose dependent decrease in cell growth of UACC257‐NOX5 overexpressing cells by catalase, NAC and DPI; indicative of a ROS‐mediated role in their proliferation (two independent experiments; P < 0.01). To examine the possibility that NOX5‐related ROS might contribute to enhanced genetic instability of UACC‐257 cells, we evaluated the activation of phosphorylated γH2AX, a biomarker for DNA damage and repair. As shown in Figure 6D, we found 30% more phosphorylated γH2AX in the NOX5 overexpressors compared to the parental and vector control cells. Conversely, stable knockdown of NOX5 expression in UACC‐257 cells (see Figure 6E) and transient knockdown of NOX5 expression in WM852 cells (see Figures 6F and S8) substantially decreased cell proliferation (three independent experiments; P < 0.01); suggesting that NOX5‐mediated pro‐oxidant tone is necessary for the proliferation of UACC‐257 and WM852 cells.
Figure 6.
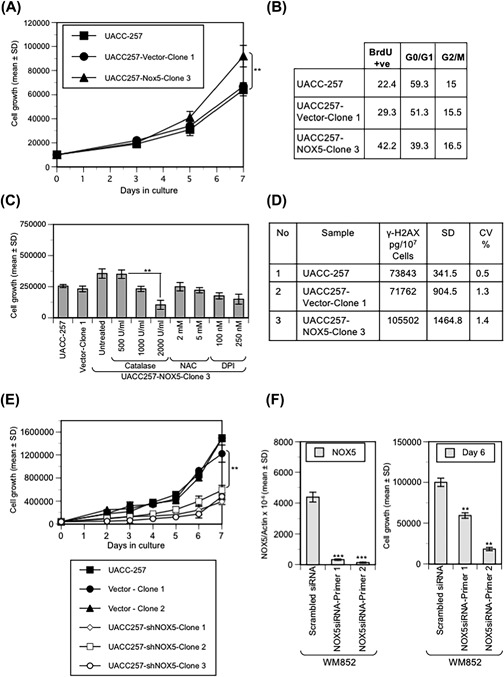
NOX5 expression alters the growth and DNA damage levels of UACC‐257 cells. (A) NOX5 overexpression promotes the growth of UACC‐257 cells. Growth of logarithmic phase UACC‐257, vector and NOX5 overexpressing cells was measured by daily cell counts; 10 000 cells were plated in triplicate for each cloned line and the parental cells. The data are expressed as the mean ± SD of three independent experiments, **, P < 0.01. (B) Cell cycle analysis was performed using flow cytometry following BrdU labeling of UACC‐257 parental and each cloned line that were serum‐starved and then released in full growth media for 24 h. The percentage of cells in the different phases of the cell cycle is shown in the table. (C) Effect of antioxidants (NAC and catalase) and the flavoprotein inhibitor diphenyleneiodonium (DPI) was evaluated on the growth of the NOX5 overexpressing cells as measured by cell counts subsequent to 48 h treatment. Data represent the mean ± SD of two independent experiments, **, P < 0.01. (D) γH2AX levels in exponentially growing UACC‐257 parental and cloned lines were quantified using a γH2AX and H2AX sandwich ELISA immunoassay as described in the Materials and Methods section. (E) Stable knockdown of NOX5 expression decreases the growth of UACC‐257 cells. Growth of logarithmic phase UACC‐257, vector, and NOX5 knockdown cells was measured by daily cell counts; 40 000 cells were plated in triplicate for each cloned line and the parental cells. The data are expressed as the mean ± SD of three independent experiments, **, P < 0.01. (F) Effect of transient knockdown of NOX5 expression on cell growth was evaluated in an additional melanoma cell line; WM852. Cells transfected with either scrambled siRNA or NOX5‐specific siRNA primers targeting different domains of human NOX5 were evaluated after 6 days for NOX5 RNA expression (left panel) and for cell growth (right panel) by cell counts. The data are expressed as the mean ± SD of triplicates,**, P < 0.01 and ***, P < 0.001. The experiment was repeated in triplicates with similar results. Representative images of the effect of NOX5 knockdown on the growth of WM852 cells and the effect on ROS production are represented in Supplementary Figure S6
4. DISCUSSION
A pro‐oxidant environment favoring tumor cell growth has been supported by several studies showing upregulated expression and/or activity of ROS generating proteins and their downstream signaling effectors.2, 7, 10, 54 In this investigation, our TMA analyses substantiate the observation that NOX5 is significantly overexpressed in melanomas and cancers of the prostate and breast (see, Figure 1, Tables 1 and S1) compared to non‐malignant tissues of the same histological origin. Particularly in the context of human melanoma, NOX5 positivity in 91% of the cases studied compared to a lack/minimal NOX5 staining in normal human skin was significant. As detailed in Table 1, among the 680 out of 750 human melanoma patient samples that stained for NOX5 expression, ≥75% of the cells were positive in 84% of the cases. Additionally, in 83 of these patients, the NOX5 staining was strong (3+).
Surprisingly, under standard tissue culture conditions, the majority of the human melanoma cell lines we screened have low to minimal expression of the NOX5 transcript (Figure 2A). This apparent discrepancy between NOX5 expression levels in human melanoma patient samples versus tissue cultured cell lines is not an anomaly; our laboratory and others have documented that expression of some members of the NOX gene family (particularly NOX1 and DUOX2) is strongly upregulated under proinflammatory conditions both in vitro (following cytokine exposure) and in vivo.55 In contrast, a discordance in the opposite direction between NOX5 expression in clinical specimens and cultured cell lines was recently reported in prostate cancer, wherein, prostate cancer cell lines demonstrated higher NOX5 protein expression levels compared to non‐malignant prostate cell lines, while no significant difference was observed in clinical specimens.24 This discordance with our observation of increased NOX5 expression in prostate cancer clinical samples relative to histologically normal prostate tissue could, in part, be due to differences in the sample sizes of the tissues examined and/or the immunohistochemical detection method using different NOX5 antibodies.24 While epigenetic regulation of NOX5 expression has only recently begun to be explored, it is one of many possible explanations for the down/up regulation of NOX5 expression in cultured cell lines, an area of investigation that remains largely unexplored.
Because pathological evidence suggested a role for NOX5 in human melanomas, we next assessed whether the intracellular redox status regulated by NOX5 was critical for the proliferation of melanoma lines. HIF‐1α, a known sensor of cellular oxidant load, which regulates the expression of a wide variety of proliferative and angiogenic genes, was significantly upregulated in the context of NOX5‐generated ROS. Under normoxic conditions, HIF‐1α expression was significantly increased in cells that overexpress NOX5; conversely, HIF‐1α levels were decreased in NOX5‐deficient cells (Figures 4 and 5A, and Supplementary Figures S2, S4, and S5A) albeit physiologically not correlated across a panel of melanoma cell lines (compare Figure 2A with Supplementary Figures S6A and S6B). Several mechanisms of ROS‐dependent upregulation of HIF‐1α protein levels have been described under both normoxic and hypoxic conditions.56 This regulation of HIF‐1α can either be at the level of protein stability or its synthesis. Transcriptionally, regulation of HIF‐1α synthesis has been attributed to the activation of NF‐κB and its binding to the HIF‐1α promoter or to regulation by the activation of MAPK/Akt signaling pathways.57, 58 Translationally, HIF‐1α levels are increased by the altered regulation and inactivation of prolyl hydroxylases, in part through the oxidation of critical stores of Fe2+; diminished levels of intracellular reducing equivalents, such as ascorbate, that maintain the iron redox state could decrease the degradation of HIF‐1α protein.59 Under hypoxic conditions prolyl hydroxylation and ubiquitin‐mediated proteasomal degradation of HIF‐1α are suppressed, resulting in HIF‐1α accumulation and stabilization by dimerization with HIF‐1β.60 As seen in Figure 4F, transcriptional levels of HIF‐1α in UACC‐257 cells remained unaltered irrespective of an increase or a decrease in NOX5 expression, suggesting that HIF‐1α regulation by NOX5 may be primarily translational by one or another oxidant‐sensitive effects. Addition of PEG‐catalase and PEG‐SOD (to increase intracellular ROS detoxifying capacity)61 or a ROS scavenger N‐Acetyl‐L‐Cysteine (NAC) to UACC‐257 cells overexpressing NOX5 significantly decreased NOX5‐upregulated HIF‐1α expression (Figure 4D), confirming HIF‐1α upregulation to be mediated by NOX5‐generated ROS signaling. This normoxic NOX5‐ROS‐HIF‐1α signaling axis sets up a pro‐inflammatory milieu that could serve as a potent angiogenic stimulus, conducive to enhanced tumor growth and invasion.62
Notably, the expression levels of p27Kip1, a member of the Cip/Kip family, known to modulate cell cycle progression were also significantly influenced by NOX5 expression. In cells that stably overexpress NOX5, p27Kip1 protein levels were decreased; and conversely, cells with decreased NOX5 expression exhibited increased p27Kip1 levels (Figures 4, 5, and Supplementary Figures S2, S4, and S5). Downregulation of p27Kip1 protein levels, in particular nuclear p27Kip1, is implicated in both disease progression and poor prognosis in a variety of cancers.63, 64 However, the effects of p27Kip1 are regulated by concentration, subcellular localization, and phosphorylation status.64, 65, 66 Post‐translationally, p27Kip1 is modified predominantly by phosphorylation; Thr187 phosphorylation leading to nuclear degradation, Ser10 phosphorylation stimulating nuclear export and subsequent degradation, and Tyr74, Tyr88, and/or Tyr89 phosphorylation diminishing its CDK‐inhibitory activity. Less common and not well understood is the phosphorylation of p27Kip1 at Thr157 and Thr198 by Akt, p90‐S6 kinases, AMPK, and PIM, that impairs its nuclear import resulting in cytoplasmic localization.
In UACC‐257 cells that stably overexpress NOX5, the observed decrease in p27Kip1 levels may, in part, be transcriptionally regulated since a modest decrease in p27Kip1 transcript levels was observed (Figure 4E). Additionally, in both parental and stable NOX5 overexpressing cells, knockdown of NOX5 increased both nuclear and cytoplasmic expression of p27Kip1 (Figures 5A and 5B). No significant alterations in the phosphorylation status of p27Kip1 at either Ser10 and Thr157 were noted. Significantly, the observed alterations in p27Kip1 levels were also SKP2 independent (Supplementary Figure S7).
The NOX5‐expression dependent, reciprocal expression levels of p27Kip1 and HIF‐1α in UACC‐257 cells appears contradictory, as several groups have shown that during hypoxia the induction of the cell cycle inhibitors p21Cip1 and p27 Kip1 is dependent on HIF‐1α.67 However, the regulation of p27Kip1 by HIF‐1α is still an area of debate within the hypoxia field68 as other studies have shown that p27Kip1 is regulated independently of HIF‐1α, through transcriptional regulation of its proximal promoter.69 Additionally, studies to characterize the role of HIF‐1α in normoxia report that knockdown of HIF‐1α resulted in significantly increased protein and mRNA of both p21Cip1 and p27Kip1, induced via, at least in part, p53‐independent but SP1‐dependent mechanisms.70 Similar reciprocal levels of expression of HIF‐1α and p27Kip1 have been reported in LNCaP prostate cancer cells under hypoxia.71 Likewise, UACC‐257 cells that stably overexpress NOX5 exhibit upregulated, normoxic HIF‐1α expression; transiently knocking down the normoxic HIF‐1α resulted in increased p27Kip1 protein levels, without significantly affecting cell growth (Supplementary Figure S6C). A similar increase in p27Kip1 protein expression was observed in WM852 cells when normoxic HIF‐1α expression was transiently knocked down (Supplementary Figure S6D). While a reciprocal effect of NOX5‐mediated ROS on the expression levels of p27Kip1 and HIF‐1α is clear, evidence of a direct effect of HIF‐1α on p27Kip1 expression is minimal and at best, modest.
While additional studies are needed to understand the precise mechanisms associated with NOX5‐redox‐induced regulation of p27Kip1 expression, another possibility is an alteration in the status of redox‐sensitive thiol‐disulfide reactions at the two critical residues within the cyclin A binding domain of p27Kip1.72 Although the role of these cysteines in redox regulation of G1 to S phase is speculative, it is reasonable to suggest that thiol‐redox reactions could act as “sulfhydryl switches” that reversibly modulate cell cycle‐regulatory protein activity.73 This hypothesis is supported by our studies of BrdU incorporation (increased S‐phase fraction) which may underlie the observed pro‐proliferative effects. Redox‐dependent downregulation of p27Kip1 expression in the presence of NOX5 is supported by our experiments using NAC, PEG‐Catalase, and PEG‐SOD that reversed the effects of NOX5 overexpression (Figure 4D).
In support of our findings, lowering oxidative stress by exposing CH72‐T4 carcinoma cells to catalase was shown to arrest cells at the G1 phase of the cell cycle and increase p27Kip1 expression74; addition of cell‐permeable SOD to SPC‐A‐1 lung adenocarcinoma cells inhibited cell proliferation through the Akt/p27Kip1 pathway.75 More recently, “non‐canonical” roles of p27Kip1 in the regulation of cell migration have also been described, in addition to effects on other processes such as cell differentiation and apoptosis.76 Taken together, we speculate that besides a cell cycle regulatory role, redox regulation of p27Kip1 status in UACC‐257 melanoma cells could influence other features of melanoma biology, including cell migration, potentially altering tumor aggressiveness, and metastasis.
Significantly, in the absence of NOX5 expression, the Akt/GSK3 signaling pathway was inhibited in UACC‐257 cells, as observed by their decreased phosphorylation (Figure 5A). Akt, an important kinase that promotes G1‐S phase cell cycle progression by phosphorylating and inactivating glycogen synthase kinase 3 (GSK3) at Ser9, is a downstream component of signaling pathways involving protein tyrosine phosphatases (PTPs).77, 78 Accordingly, in ROS generating NOX5 cells, PTP activity was significantly inhibited (data not shown), offering one plausible mechanism by which NOX5‐generated ROS‐induced inactivation of PTPs leads to an active Akt kinase, a known regulator of cell cycle genes that control anchorage‐independent growth of cancer cells.78, 79
In addition to the enhanced pro‐oxidant tone conferred by NOX5 overexpression, we also observed that UACC‐257 cells that overexpress NOX5 proliferate faster (Figure 6A). Enhanced cell proliferation by NOX5 overexpressing cells is clearly distinguishable from both parental cells and vector controls after a week in culture. However, within 24 h of release from serum starvation, a marked increase in BrdU incorporating cells, reflective of an S‐phase population, supports the enhanced growth of NOX5 overexpressing cells (Figure 6B). Interestingly, these cells were characterized by an increase in the DNA damage and repair biomarker γH2AX. In contrast, knocking down endogenous NOX5 expression (using three different NOX5shRNA plasmids that target different sequences in NOX5) in UACC‐257 cells markedly slows cell growth (Figure 6E), confirming that NOX5 expression regulates UACC‐257 cell proliferation. Enhanced cell growth in the presence of NOX5 in UACC‐257 cells could, in part, be due to the downstream redox signaling pathways that are activated due to altered phosphatase function.
Collectively, our results suggest a new molecular paradigm by which NOX5‐mediated ROS‐inducible signal‐transduction pathway(s) may contribute to the growth of melanoma cells and other human tumors,80 in part, through mechanisms that involve genomic instability and activation of the Akt/GSK3, p27Kip1, and HIF‐1α signaling pathways. Intracellular redox status maintained by NOX5 is critical for sustaining cell growth and may contribute to the establishment of a pro‐angiogenic milieu that adversely affects clinical outcome for patients with melanomas.
Supporting information
Additional Supporting Information may be found online in the supporting information tab for this article.
Figure S1. Melanoma cell lines express functional variants of NOX5. RT‐PCR was performed using primer pairs specific for the NOX family homologs (NOX1‐5 and Duoxes) and to the calcium‐binding domain containing regions of NOX5α, NOX5β, NOX5γ, or NOX5δ. Left panel, SK‐MEL‐5; and Right panel, UACC‐257 cells. Numbers on the right indicate the expected size of the PCR product (bp).
Figure S2. Functional overexpression of NOX5 in various cell types. Doxycycline inducible overexpression of NOX5 in UACC‐257 cells (A), stable overexpression of NOX5 in KARPAS 299 cells (B) and stable overexpression of NOX5 in PC‐3 cells (C) is functional as detected by the luminol chemiluminescence assay.
Figure S3. Densitometric analyses of Figure 4 (A‐D) are represented. Tables on the right are the densitometric analysis of the expression of various proteins relative to that of β‐Actin.
Figure S4. Various cell types exhibit reciprocal modulation of HIF‐1α and p27Kip1 expression dependent on NOX5 expression. A, Inducible overexpression of NOX5 in UACC‐257 cells (left panel), stable overexpression of NOX5 in KARPAS 299 cells (middle panel) and stable overexpression of NOX5 in PC‐3 cells (right panel) show increased HIF‐1α expression and decreased p27Kip1 levels. Tables on the right represent the densitometric analyses of HIF‐1α, NOX5 and p27Kip1 protein expression relative to that of β‐Actin. B, Transient knockdown of NOX5 mRNA expression in human WM852 melanoma cells (left panel) results in decreased HIF‐1α protein expression and increased p27Kip1 levels (right panel). C, Transient knockdown of NOX5 mRNA expression in human PC‐3 prostate cancer cells (left panel) leads to increased p27Kip1 levels (middle panel) and transient knockdown of stably overexpressed NOX5 in two different PC‐3‐NOX5 clones (right panel) results in decreased HIF‐1α levels. Tables below the western blot analyses in panels B and C represent the densitometric analyses of the various proteins expression relative to that of β‐Actin.
Figure S5. Densitometric analyses of Figure 5 (panels A and B) are represented. Densitometric values of protein expression are relative to that of β‐Actin for cytoplasmic expression and relative to Lamin A/C for nuclear expression. For p‐Akt (Ser473) and p‐GSK3β (Ser9), the normalization was to total Akt and GSK3β respectively.
Figure S6. Relevance of normoxic HIF‐1α expression relative to NOX5 in human melanoma cell lines.
Figure S7. SKP2 expression relative to NOX5 in human melanoma cell lines.
Figure S8. Transient knockdown of NOX5 expression decreases growth of WM852 cells.
ACKNOWLEDGMENTS
This work was supported with federal funds from the Center for Cancer Research, the Division of Cancer Treatment and Diagnosis, and NCI Contract No. HHSN261200800001E, National Cancer Institute, National Institutes of Health. The content of this publication does not necessarily reflect the views or policies of the Department of Health and Human Services, nor does mention of trade names, commercial products or organizations imply endorsement by the US Government. We also acknowledge the Dr. Miriam and Sheldon G. Adelson Medical Research Foundation (AMRF) for the grant supporting Dr. Dave S Hoon's research and contribution to this manuscript.
Antony S, Jiang G, Wu Y, et al. NADPH oxidase 5 (NOX5)—induced reactive oxygen signaling modulates normoxic HIF‐1α and p27Kip1 expression in malignant melanoma and other human tumors. Molecular Carcinogenesis. 2017;56: 2643–2662. 10.1002/mc.22708
REFERENCES
- 1. Lambeth JD, Neish AS. Nox enzymes and new thinking on reactive oxygen: a double‐edged sword revisited. Annu Rev Pathol. 2014; 9:119–145. [DOI] [PubMed] [Google Scholar]
- 2. Burdon RH. Superoxide and hydrogen peroxide in relation to mammalian cell proliferation. Free Radic Biol Med. 1995; 18:775–794. [DOI] [PubMed] [Google Scholar]
- 3. Holmstrom KM, Finkel T. Cellular mechanisms and physiological consequences of redox‐dependent signalling. Nat Rev Mol Cell Biol. 2014; 15:411–421. [DOI] [PubMed] [Google Scholar]
- 4. Droge W. Free radicals in the physiological control of cell function. Physiol Rev. 2002; 82:47–95. [DOI] [PubMed] [Google Scholar]
- 5. Rhee SG. Cell signaling. H2O2, a necessary evil for cell signaling. Science. 2006; 312:1882–1883. [DOI] [PubMed] [Google Scholar]
- 6. Kamata T. Roles of Nox1 and other Nox isoforms in cancer development. Cancer Sci. 2009; 100:1382–1388. [DOI] [PMC free article] [PubMed] [Google Scholar]
- 7. Kumar B, Koul S, Khandrika L, Meacham RB, Koul HK. Oxidative stress is inherent in prostate cancer cells and is required for aggressive phenotype. Cancer Res. 2008; 68:1777–1785. [DOI] [PubMed] [Google Scholar]
- 8. Hayes P, Knaus UG. Balancing reactive oxygen species in the epigenome: nADPH oxidases as target and perpetrator. Antioxid Redox Signal. 2013; 18:1937–1945. [DOI] [PubMed] [Google Scholar]
- 9. Roy K, Wu Y, Meitzler JL, et al. NADPH oxidases and cancer. Clin Sci (Lond). 2015; 128:863–875. [DOI] [PubMed] [Google Scholar]
- 10. Liu‐Smith F, Dellinger R, Meyskens FL, Jr. Updates of reactive oxygen species in melanoma etiology and progression. Arch Biochem Biophys. 2014; 563:51–55. [DOI] [PMC free article] [PubMed] [Google Scholar]
- 11. Babior BM, Lambeth JD, Nauseef W. The neutrophil NADPH oxidase. Arch Biochem Biophys. 2002; 397:342–344. [DOI] [PubMed] [Google Scholar]
- 12. Bedard K, Krause KH. The NOX family of ROS‐generating NADPH oxidases: physiology and pathophysiology. Physiol Rev. 2007; 87:245–313. [DOI] [PubMed] [Google Scholar]
- 13. Nauseef WM. Biological roles for the NOX family NADPH oxidases. J Biol Chem. 2008; 283:16961–16965. [DOI] [PMC free article] [PubMed] [Google Scholar]
- 14. Geiszt M. NADPH oxidases: new kids on the block. Cardiovasc Res. 2006; 71:289–299. [DOI] [PubMed] [Google Scholar]
- 15. Leto TL, Geiszt M. Role of Nox family NADPH oxidases in host defense. Antioxid Redox Signal. 2006; 8:1549–1561. [DOI] [PubMed] [Google Scholar]
- 16. Altenhofer S, Kleikers PW, Radermacher KA, et al. The NOX toolbox: validating the role of NADPH oxidases in physiology and disease. Cell Mol Life Sci. 2012; 69:2327–2343. [DOI] [PMC free article] [PubMed] [Google Scholar]
- 17. Meitzler JL, Antony S, Wu Y, et al. NADPH oxidases: a perspective on reactive oxygen species production in tumor biology. Antioxid Redox Signal. 2014; 20:2873–2889. [DOI] [PMC free article] [PubMed] [Google Scholar]
- 18. Okada F, Kobayashi M, Tanaka H, et al. The role of nicotinamide adenine dinucleotide phosphate oxidase‐derived reactive oxygen species in the acquisition of metastatic ability of tumor cells. Am J Pathol. 2006; 169:294–302. [DOI] [PMC free article] [PubMed] [Google Scholar]
- 19. Laurent E, McCoy JW, 3rd , Macina RA, et al. Nox1 is over‐expressed in human colon cancers and correlates with activating mutations in K‐Ras. Int J Cancer. 2008; 123:100–107. [DOI] [PMC free article] [PubMed] [Google Scholar]
- 20. Arbiser JL, Petros J, Klafter R, et al. Reactive oxygen generated by Nox1 triggers the angiogenic switch. Proc Natl Acad Sci USA. 2002; 99:715–720. [DOI] [PMC free article] [PubMed] [Google Scholar]
- 21. Yamaura M, Mitsushita J, Furuta S, et al. NADPH oxidase 4 contributes to transformation phenotype of melanoma cells by regulating G2‐M cell cycle progression. Cancer Res. 2009; 69:2647–2654. [DOI] [PubMed] [Google Scholar]
- 22. Antony S, Wu Y, Hewitt SM, et al. Characterization of NADPH oxidase 5 expression in human tumors and tumor cell lines with a novel mouse monoclonal antibody. Free Radic Biol Med. 2013; 65:497–508. [DOI] [PMC free article] [PubMed] [Google Scholar]
- 23. Dho SH, Kim JY, Lee KP, et al. STAT5A‐mediated NOX5‐L expression promotes the proliferation and metastasis of breast cancer cells. Exp Cell Res. 2017; 351:51–58. [DOI] [PubMed] [Google Scholar]
- 24. Holl M, Koziel R, Schafer G, et al. ROS signaling by NADPH oxidase 5 modulates the proliferation and survival of prostate carcinoma cells. Mol Carcinog. 2016; 55:27–39. [DOI] [PMC free article] [PubMed] [Google Scholar]
- 25. Hong J, Behar J, Wands J, et al. Bile acid reflux contributes to development of esophageal adenocarcinoma via activation of phosphatidylinositol‐specific phospholipase Cgamma2 and NADPH oxidase NOX5‐S. Cancer Res. 2010; 70:1247–1255. [DOI] [PMC free article] [PubMed] [Google Scholar]
- 26. Wu Y, Antony S, Hewitt SM, et al. Functional activity and tumor‐specific expression of dual oxidase 2 in pancreatic cancer cells and human malignancies characterized with a novel monoclonal antibody. Int J Oncol. 2013; 42:1229–1238. [DOI] [PMC free article] [PubMed] [Google Scholar]
- 27. Ritsick DR, Edens WA, McCoy JW, Lambeth JD. The use of model systems to study biological functions of Nox/Duox enzymes. Biochem Soc Symp. 2004; 71: 85–96. [DOI] [PubMed] [Google Scholar]
- 28. Sirokmany G, Donko A, Geiszt M. Nox/Duox family of NADPH oxidases: lessons from knockout mouse models. Trends Pharmacol Sci. 2016; 37:318–327. [DOI] [PubMed] [Google Scholar]
- 29. Fulton DJ. Nox5 and the regulation of cellular function. Antioxid Redox Signal. 2009; 11:2443–2452. [DOI] [PMC free article] [PubMed] [Google Scholar]
- 30. Chen F, Wang Y, Barman S, Fulton DJ. Enzymatic regulation and functional relevance of NOX5. Curr Pharm Des. 2015; 21:5999–6008. [DOI] [PMC free article] [PubMed] [Google Scholar]
- 31. Bedard K, Jaquet V, Krause KH. NOX5: from basic biology to signaling and disease. Free Radic Biol Med. 2012; 52:725–734. [DOI] [PubMed] [Google Scholar]
- 32. Kawahara T, Jackson HM, Smith SM, Simpson PD, Lambeth JD. Nox5 forms a functional oligomer mediated by self‐association of its dehydrogenase domain. Biochemistry. 2011; 50:2013–2025. [DOI] [PMC free article] [PubMed] [Google Scholar]
- 33. Lambeth JD, Kawahara T, Diebold B. Regulation of Nox and Duox enzymatic activity and expression. Free Radic Biol Med. 2007; 43:319–331. [DOI] [PMC free article] [PubMed] [Google Scholar]
- 34. Cheng G, Cao Z, Xu X, van Meir EG, Lambeth JD. Homologs of gp91phox: cloning and tissue expression of Nox3, Nox4, and Nox5. Gene. 2001; 269:131–140. [DOI] [PubMed] [Google Scholar]
- 35. Banfi B, Molnar G, Maturana A, et al. A Ca(2+)‐activated NADPH oxidase in testis, spleen, and lymph nodes. J Biol Chem. 2001; 276:37594–37601. [DOI] [PubMed] [Google Scholar]
- 36. Banfi B, Tirone F, Durussel I, et al. Mechanism of Ca2+ activation of the NADPH oxidase 5 (NOX5). J Biol Chem. 2004; 279:18583–18591. [DOI] [PubMed] [Google Scholar]
- 37. Shigemura T, Shiohara M, Kato M, et al. Superoxide‐Generating nox5alpha is functionally required for the human T‐cell leukemia virus type 1‐Induced cell transformation phenotype. J Virol. 2015; 89:9080–9089. [DOI] [PMC free article] [PubMed] [Google Scholar]
- 38. Kamiguti AS, Serrander L, Lin K, et al. Expression and activity of NOX5 in the circulating malignant B cells of hairy cell leukemia. J Immunol. 2005; 175:8424–8430. [DOI] [PubMed] [Google Scholar]
- 39. Carnesecchi S, Rougemont AL, Doroshow JH, et al. The NADPH oxidase NOX5 protects against apoptosis in ALK‐positive anaplastic large‐cell lymphoma cell lines. Free Radic Biol Med. 2015; 84:22–29. [DOI] [PMC free article] [PubMed] [Google Scholar]
- 40. Huang WC, Li X, Liu J, Lin J, Chung LW. Activation of androgen receptor, lipogenesis, and oxidative stress converged by SREBP‐1 is responsible for regulating growth and progression of prostate cancer cells. Mol Cancer Res. 2012; 10:133–142. [DOI] [PMC free article] [PubMed] [Google Scholar]
- 41. Kalatskaya I. Overview of major molecular alterations during progression from Barrett's esophagus to esophageal adenocarcinoma. Ann N Y Acad Sci. 2016; 1381:74–91. [DOI] [PubMed] [Google Scholar]
- 42. Fu X, Beer DG, Behar J, Wands J, Lambeth D, Cao W. CAMP‐response element‐binding protein mediates acid‐induced NADPH oxidase NOX5‐S expression in Barrett esophageal adenocarcinoma cells. J Biol Chem. 2006; 281:20368–20382. [DOI] [PubMed] [Google Scholar]
- 43. BelAiba RS, Djordjevic T, Petry A, et al. NOX5 variants are functionally active in endothelial cells. Free Radic Biol Med. 2007; 42:446–459. [DOI] [PubMed] [Google Scholar]
- 44. Ji J, Zhang Y, Redon CE, et al. Phosphorylated fraction of H2AX as a measurement for DNA damage in cancer cells and potential applications of a novel assay. PLoS ONE. 2017; 12:e0171582. [DOI] [PMC free article] [PubMed] [Google Scholar]
- 45. Juhasz A, Ge Y, Markel S, et al. Expression of NADPH oxidase homologues and accessory genes in human cancer cell lines, tumours and adjacent normal tissues. Free Radic Res. 2009; 43:523–532. [DOI] [PMC free article] [PubMed] [Google Scholar]
- 46. Petrushanko IY, Lobachev VM, Kononikhin AS, et al. Oxidation of Ca2+‐Binding domain of NADPH oxidase 5 (NOX5): toward understanding the mechanism of inactivation of NOX5 by ROS. PLoS ONE. 2016; 11:e0158726. [DOI] [PMC free article] [PubMed] [Google Scholar]
- 47. Pandey D, Fulton DJ. Molecular regulation of NADPH oxidase 5 via the MAPK pathway. Am J Physiol Heart Circ Physiol. 2011; 300:H1336–H1344. [DOI] [PMC free article] [PubMed] [Google Scholar]
- 48. Serrander L, Jaquet V, Bedard K, et al. NOX5 is expressed at the plasma membrane and generates superoxide in response to protein kinase C activation. Biochimie. 2007; 89:1159–1167. [DOI] [PubMed] [Google Scholar]
- 49. Jagnandan D, Church JE, Banfi B, Stuehr DJ, Marrero MB, Fulton DJ. Novel mechanism of activation of NADPH oxidase 5. calcium sensitization via phosphorylation. J Biol Chem. 2007; 282:6494–6507. [DOI] [PubMed] [Google Scholar]
- 50. Aldieri E, Riganti C, Polimeni M, et al. Classical inhibitors of NOX NAD(P)H oxidases are not specific. Curr Drug Metab. 2008; 9:686–696. [DOI] [PubMed] [Google Scholar]
- 51. Doroshow JH, Gaur S, Markel S, et al. Effects of iodonium‐class flavin dehydrogenase inhibitors on growth, reactive oxygen production, cell cycle progression, NADPH oxidase 1 levels, and gene expression in human colon cancer cells and xenografts. Free Radic Biol Med. 2013; 57:162–175. [DOI] [PMC free article] [PubMed] [Google Scholar]
- 52. Semenza GL. Targeting HIF‐1 for cancer therapy. Nat Rev Cancer. 2003; 3:721–732. [DOI] [PubMed] [Google Scholar]
- 53. Kossatz U, Dietrich N, Zender L, Buer J, Manns MP, Malek NP. Skp2‐dependent degradation of p27kip1 is essential for cell cycle progression. Genes Dev. 2004; 18:2602–2607. [DOI] [PMC free article] [PubMed] [Google Scholar]
- 54. Soares FA, Shaughnessy SG, MacLarkey WR, Orr FW. Quantification and morphologic demonstration of reactive oxygen species produced by Walker 256 tumor cells in vitro and during metastasis in vivo. Lab Invest. 1994; 71:480–489. [PubMed] [Google Scholar]
- 55. Wu Y, Lu J, Antony S, et al. Activation of TLR4 is required for the synergistic induction of dual oxidase 2 and dual oxidase A2 by IFN‐gamma and lipopolysaccharide in human pancreatic cancer cell lines. J Immunol. 2013; 190:1859–1872. [DOI] [PMC free article] [PubMed] [Google Scholar]
- 56. Calvani M, Comito G, Giannoni E, Chiarugi P. Time‐dependent stabilization of hypoxia inducible factor‐1alpha by different intracellular sources of reactive oxygen species. PLoS ONE. 2012; 7:e38388. [DOI] [PMC free article] [PubMed] [Google Scholar]
- 57. Bonello S, Zahringer C, BelAiba RS, et al. Reactive oxygen species activate the HIF‐1alpha promoter via a functional NFkappaB site. Arterioscler Thromb Vasc Biol. 2007; 27:755–761. [DOI] [PubMed] [Google Scholar]
- 58. Kietzmann T, Gorlach A. Reactive oxygen species in the control of hypoxia‐inducible factor‐mediated gene expression. Semin Cell Dev Biol. 2005; 16:474–486. [DOI] [PubMed] [Google Scholar]
- 59. Page EL, Chan DA, Giaccia AJ, Levine M, Richard DE. Hypoxia‐inducible factor‐1alpha stabilization in nonhypoxic conditions: role of oxidation and intracellular ascorbate depletion. Mol Biol Cell. 2008; 19:86–94. [DOI] [PMC free article] [PubMed] [Google Scholar]
- 60. Movafagh S, Crook S, Vo K. Regulation of hypoxia‐inducible factor‐1a by reactive oxygen species: new developments in an old debate. J Cell Biochem. 2015; 116:696–703. [DOI] [PubMed] [Google Scholar]
- 61. Beckman JS, Minor RL, Jr , White CW, Repine JE, Rosen GM, Freeman BA. Superoxide dismutase and catalase conjugated to polyethylene glycol increases endothelial enzyme activity and oxidant resistance. J Biol Chem. 1988; 263:6884–6892. [PubMed] [Google Scholar]
- 62. Hanna SC, Krishnan B, Bailey ST, et al. HIF1alpha and HIF2alpha independently activate SRC to promote melanoma metastases. J Clin Invest. 2013; 123:2078–2093. [DOI] [PMC free article] [PubMed] [Google Scholar]
- 63. Menon SG, Sarsour EH, Spitz DR, et al. Redox regulation of the G1 to S phase transition in the mouse embryo fibroblast cell cycle. Cancer Res. 2003; 63:2109–2117. [PubMed] [Google Scholar]
- 64. Chu IM, Hengst L, Slingerland JM. The Cdk inhibitor p27 in human cancer: prognostic potential and relevance to anticancer therapy. Nat Rev Cancer. 2008; 8:253–267. [DOI] [PubMed] [Google Scholar]
- 65. Hnit SS, Xie C, Yao M, et al. P27(Kip1) signaling: transcriptional and post‐translational regulation. Int J Biochem Cell Biol. 2015; 68:9–14. [DOI] [PubMed] [Google Scholar]
- 66. Borriello A, Cucciolla V, Oliva A, Zappia V, Della Ragione F. P27Kip1 metabolism: a fascinating labyrinth. Cell Cycle. 2007; 6:1053–1061. [DOI] [PubMed] [Google Scholar]
- 67. Kumar S, Vaidya M. Hypoxia inhibits mesenchymal stem cell proliferation through HIF1alpha‐dependent regulation of P27. Mol Cell Biochem. 2016; 415:29–38. [DOI] [PubMed] [Google Scholar]
- 68. Ortmann B, Druker J, Rocha S. Cell cycle progression in response to oxygen levels. Cell Mol Life Sci. 2014; 71:3569–3582. [DOI] [PMC free article] [PubMed] [Google Scholar]
- 69. Gardner LB, Li Q, Park MS, Flanagan WM, Semenza GL, Dang CV. Hypoxia inhibits G1/S transition through regulation of p27 expression. J Biol Chem. 2001; 276:7919–7926. [DOI] [PubMed] [Google Scholar]
- 70. Culver C, Melvin A, Mudie S, Rocha S. HIF‐1alpha depletion results in SP1‐mediated cell cycle disruption and alters the cellular response to chemotherapeutic drugs. Cell Cycle. 2011; 10:1249–1260. [DOI] [PMC free article] [PubMed] [Google Scholar]
- 71. Ghafar MA, Anastasiadis AG, Chen MW, et al. Acute hypoxia increases the aggressive characteristics and survival properties of prostate cancer cells. Prostate. 2003; 54:58–67. [DOI] [PubMed] [Google Scholar]
- 72. Russo AA, Jeffrey PD, Patten AK, Massague J, Pavletich NP. Crystal structure of the p27Kip1 cyclin‐dependent‐kinase inhibitor bound to the cyclin A‐Cdk2 complex. Nature. 1996; 382:325–331. [DOI] [PubMed] [Google Scholar]
- 73. Menon SG, Goswami PC. A redox cycle within the cell cycle: ring in the old with the new. Oncogene. 2007; 26:1101–1109. [DOI] [PubMed] [Google Scholar]
- 74. Ibanez IL, Policastro LL, Tropper I, et al. H2O2 scavenging inhibits G1/S transition by increasing nuclear levels of p27KIP1. Cancer Lett. 2011; 305:58–68. [DOI] [PubMed] [Google Scholar]
- 75. Lu M, Gong X, Lu Y, Guo J, Wang C, Pan Y. Molecular cloning and functional characterization of a cell‐permeable superoxide dismutase targeted to lung adenocarcinoma cells. Inhibition cell proliferation through the Akt/p27kip1 pathway. J Biol Chem. 2006; 281:13620–13627. [DOI] [PubMed] [Google Scholar]
- 76. Sharma SS, Pledger WJ. The non‐canonical functions of p27(Kip1) in normal and tumor biology. Cell Cycle. 2016; 15:1189–1201. [DOI] [PMC free article] [PubMed] [Google Scholar]
- 77. Cross JV, Templeton DJ. Regulation of signal transduction through protein cysteine oxidation. Antioxid Redox Signal. 2006; 8:1819–1827. [DOI] [PubMed] [Google Scholar]
- 78. Ostman A, Frijhoff J, Sandin A, Bohmer FD. Regulation of protein tyrosine phosphatases by reversible oxidation. J Biochem. 2011; 150:345–356. [DOI] [PubMed] [Google Scholar]
- 79. Jing Y, Liu LZ, Jiang Y, et al. Cadmium increases HIF‐1 and VEGF expression through ROS, ERK, and AKT signaling pathways and induces malignant transformation of human bronchial epithelial cells. Toxicol Sci. 2012; 125:10–19. [DOI] [PMC free article] [PubMed] [Google Scholar]
- 80. Deep G, Panigrahi GK. Hypoxia‐Induced signaling promotes prostate cancer progression: exosomes role as messenger of hypoxic response in tumor microenvironment. Crit Rev Oncog. 2015; 20:419–434. [DOI] [PMC free article] [PubMed] [Google Scholar]
Associated Data
This section collects any data citations, data availability statements, or supplementary materials included in this article.
Supplementary Materials
Additional Supporting Information may be found online in the supporting information tab for this article.
Figure S1. Melanoma cell lines express functional variants of NOX5. RT‐PCR was performed using primer pairs specific for the NOX family homologs (NOX1‐5 and Duoxes) and to the calcium‐binding domain containing regions of NOX5α, NOX5β, NOX5γ, or NOX5δ. Left panel, SK‐MEL‐5; and Right panel, UACC‐257 cells. Numbers on the right indicate the expected size of the PCR product (bp).
Figure S2. Functional overexpression of NOX5 in various cell types. Doxycycline inducible overexpression of NOX5 in UACC‐257 cells (A), stable overexpression of NOX5 in KARPAS 299 cells (B) and stable overexpression of NOX5 in PC‐3 cells (C) is functional as detected by the luminol chemiluminescence assay.
Figure S3. Densitometric analyses of Figure 4 (A‐D) are represented. Tables on the right are the densitometric analysis of the expression of various proteins relative to that of β‐Actin.
Figure S4. Various cell types exhibit reciprocal modulation of HIF‐1α and p27Kip1 expression dependent on NOX5 expression. A, Inducible overexpression of NOX5 in UACC‐257 cells (left panel), stable overexpression of NOX5 in KARPAS 299 cells (middle panel) and stable overexpression of NOX5 in PC‐3 cells (right panel) show increased HIF‐1α expression and decreased p27Kip1 levels. Tables on the right represent the densitometric analyses of HIF‐1α, NOX5 and p27Kip1 protein expression relative to that of β‐Actin. B, Transient knockdown of NOX5 mRNA expression in human WM852 melanoma cells (left panel) results in decreased HIF‐1α protein expression and increased p27Kip1 levels (right panel). C, Transient knockdown of NOX5 mRNA expression in human PC‐3 prostate cancer cells (left panel) leads to increased p27Kip1 levels (middle panel) and transient knockdown of stably overexpressed NOX5 in two different PC‐3‐NOX5 clones (right panel) results in decreased HIF‐1α levels. Tables below the western blot analyses in panels B and C represent the densitometric analyses of the various proteins expression relative to that of β‐Actin.
Figure S5. Densitometric analyses of Figure 5 (panels A and B) are represented. Densitometric values of protein expression are relative to that of β‐Actin for cytoplasmic expression and relative to Lamin A/C for nuclear expression. For p‐Akt (Ser473) and p‐GSK3β (Ser9), the normalization was to total Akt and GSK3β respectively.
Figure S6. Relevance of normoxic HIF‐1α expression relative to NOX5 in human melanoma cell lines.
Figure S7. SKP2 expression relative to NOX5 in human melanoma cell lines.
Figure S8. Transient knockdown of NOX5 expression decreases growth of WM852 cells.