Figure 2.
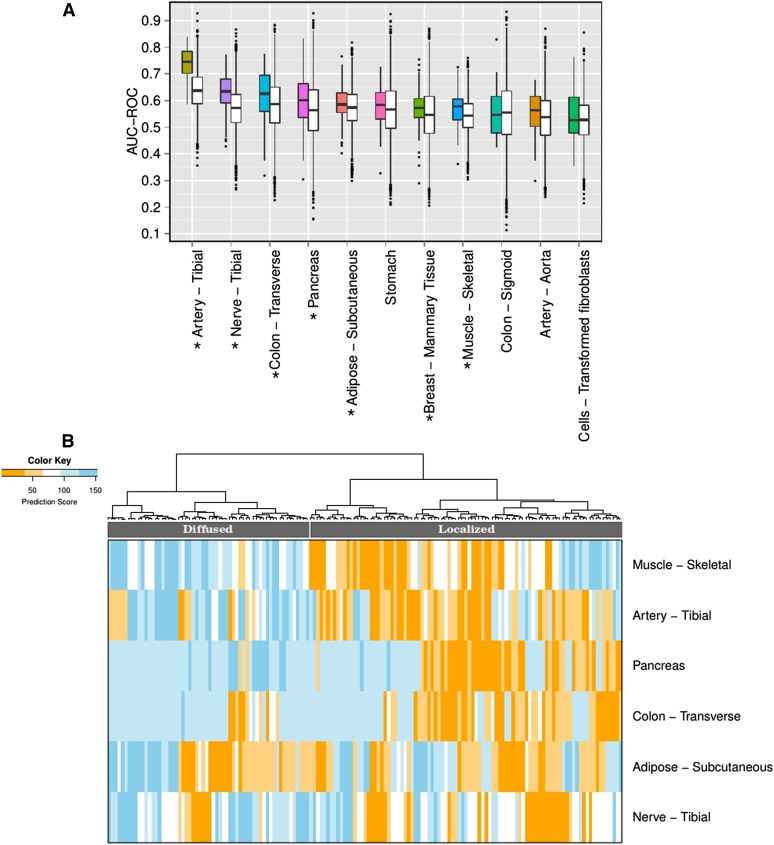
Classifying hypertensive individuals based on tissue-specific gene expression in various tissues. (A) The figure shows the accuracy of predicting hypertensive individuals (in terms of area under ROC i.e., AUC-ROC) using the tissue-specific significant (FDR ≤ 0.1) DE genes using LASSO. The prediction is obtained for fivefold cross-validation in 20 independent trials, where DE genes are identified using only the training samples. For each tissue, a pair of boxplots is shown: the colored boxplot corresponds to the AUC using significant (FDR ≤ 0.1) DE genes and the white boxplot shows the accuracy using random genes (keeping the number of random genes same as the number of DE gene in the corresponding tissue) from FDR > 0.5 DE genes, as a control. Seven tissues – artery-tibial, nerve-tibial, colon-transverse, pancreas, adipose-subcutaneous, muscle-skeletal, and breast-mammary tissue (marked by asterisks) – have prediction accuracy of HT significantly higher than the prediction using random genes. (B) Heatmap of the predicted HT-score for each HE individual (columns) in the model based on each of the six tissues (rows) reveals stratification of HT individuals into two distinct groups, i.e., Localized and Diffused groups.

