Abstract
Purpose
To develop a time-efficient automated segmentation approach that could identify critical structures in the temporal bone for visual enhancement and use in surgical simulation software.
Methods
An atlas-based segmentation approach was developed to segment the cochlea, ossicles, semicircular canals (SCCs), and facial nerve in normal temporal bone CT images. This approach was tested in images of 26 cadaver bones (13 left, 13 right). The results of the automated segmentation were compared to manual segmentation visually and using DICE metric, average Hausdorff distance, and volume similarity.
Results
The DICE metrics were greater than 0.8 for the cochlea, malleus, incus, and the SCCs combined. It was slightly lower for the facial nerve. The average Hausdorff distance was less than one voxel for all structures, and the volume similarity was 0.86 or greater for all structures except the stapes.
Conclusions
The atlas-based approach with rigid body registration of the otic capsule was successful in segmenting critical structures of temporal bone anatomy for use in surgical simulation software.
Keywords: Atlas-based segmentation, Image registration, Surgical simulation, Temporal bone anatomy
Introduction
The temporal bone comprises the lateral and inferior aspect of the skull and houses a number of critical structures including the mechanisms for hearing and balance, the facial nerve which supplies motor function to the muscles of facial expression, as well as the primary vascular structures for the brain (Table 1). Surgical management of ear disease requires both cognitive and technical skills that are developed initially over 5 years of training and continue to develop over time during clinical practice. One of the most difficult technical aspects of ear surgery is mastery of temporal bone dissection. Surgery on the temporal bone requires drilling through various densities of bone and identifying surgical landmarks. This is accomplished by thinning of bone to the point that it becomes transparent without violating the critical structure.
Table 1.
Critical structures within the temporal bone
| Temporal bone structure | Function |
|---|---|
| Cochlea | Houses the neural mechanisms for hearing |
| Ossicles | Conduction of sound from the tympanic membrane to the cochlea |
| Facial nerve | Primary motor function for muscle of facial expression |
| Semicircular canals and vestibule | Houses organs for sense of balance |
Our group has been developing a surgical simulation system to provide a platform for training in a safe and cost-efficient virtual environment. This platform uses image data from CT scans of human anatomy. In order for our system to have the necessary visual fidelity to be useful, the CT image data must be processed to identify the critical structures noted above. Once these individual structures are identified, each one must be uniquely enhanced to provide the subtle cues needed to identify them within the embedded bone. Additionally, identification of these structures provides the basis for automated assessment and feedback as the surgical technique is assessed by tracking virtual surgical instruments in relation to the critical structures.
The gold standard for identifying the critical structures within the image data has been to manually trace each one from individual sections of the three-dimensional volume. This is a painstakingly slow process that requires a high level of anatomical expertise. An automated method for identifying multiple structures within temporal bone anatomy could speed this step up considerably and remove bias from the process. An automated segmentation approach would allow easy addition of additional temporal bones to the simulation system providing variations for practice. It would also allow other institutions to acquire and process image data suitable for the training system. Additionally, it will provide the necessary efficiency required to load patient data into the surgical simulator for pre-surgical rehearsal and support a fully automated robotic system in the future.
Methods
The overall goal of this study was to develop an automated approach for segmenting the ossicles, cochlea, facial nerve, and semicircular canals in clinical CT images of temporal bone. The approach was based on images that were obtained from ex vivo specimens of temporal bones. An atlas-based segmentation was developed that was based on the accurate spatial registration of the otic capsule. Six bones were used to develop the ‘gold standard’ atlas and the ROIs surrounding each anatomical structure listed. These ROIs were used for the intensity-based segmentation of temporal bone anatomy. A total of twenty ‘test’ data sets were evaluated using this approach. The results from the automated segmentation were visually and quantitatively compared to manual tracings validated by an expert in temporal bone anatomy (GW). Three quantitative metrics, DICE, average Hausdorff distance (avg HD), and volume similarity (VS) were used for evaluating the segmentation of the individual structures. Detailed methods are presented below.
Study sample
A total of 26 de-identified temporal bones (13 left, 13 right) were obtained from the Ohio State University Body Donation program (21) and the University of Cincinnati (5). Six of the bones (3 left, 3 right) were used to develop the automated registration parameters and the region-of-interest (ROI) masks used for the automated segmentation. The remaining bones were used for testing the atlas-based segmentation approach. All of these bones were adult specimens and did not have any otologic pathology. They were chosen at random from a larger repository of specimens used to develop the temporal bone surgical simulator developed at the Ohio SuperComputer Center. Ohio State University Institutional Review Board approval was not required for this study because the bones were de-identified cadaveric specimens.
Image acquisition
Clinical X-ray computed tomography (CT) images of the bones were acquired at 140 kVp and exposure times of 1000 mA s using a Siemens 64-bit detector Somatom Sensation™ (Siemens Healthcare GmbH, Erlangen Germany). Axial slices were collected over a 119-mm field of view (FOV) with an in-plane voxel size of 0.232 mm and slice thickness of 0.4 mm. A left temporal bone image was randomly chosen to be used as the reference image for registration. This image was flipped horizontally for spatial registration of the right bone images.
Registration
The 16-bit images were linearly rescaled to 8-bit so that only bone was present in the image for registration. The automated registration was performed in two steps. The first step was a lower- resolution (subsampled by 2) rigid body registration of the whole bone. This was done in order to get the data sets in the same general registration space prior to a higher-resolution registration of a region that included the otic capsule. Elastix 4.7 [1,2] was used for the registration with the following parameters: a multi-resolution pyramid with 4 levels using mutual information, standard gradient descent optimizer with a maximum number of iterations 2000, and a third-order B-spline interpolator (Fig. 1a). The second step was a rigid body registration of the full resolution image that included only the ROI of the otic capsule, the dense bone that invests the cochlea, vestibule, and the SCCs (yellow circle in Fig. 1a). The parameters used for this registration were the same as for the first registration except the number of resolutions in the multi-resolution pyramid was 3. Mutual information has been found to be useful in both multi- and unimodality registration applications. The parameters used for the registrations in this study were those suggested in the Elastix manual [3] in which the authors took into account computation speed and overall quality of the registration results. We have found that these settings work well for a variety of other uni- and multimodality registration applications performed in our laboratory. We did, however, evaluate the number of resolutions required for the multi-resolution pyramid and the number of iterations used for the gradient descent optimizer and determined the settings we have presented here were the best for this application.
Fig. 1.
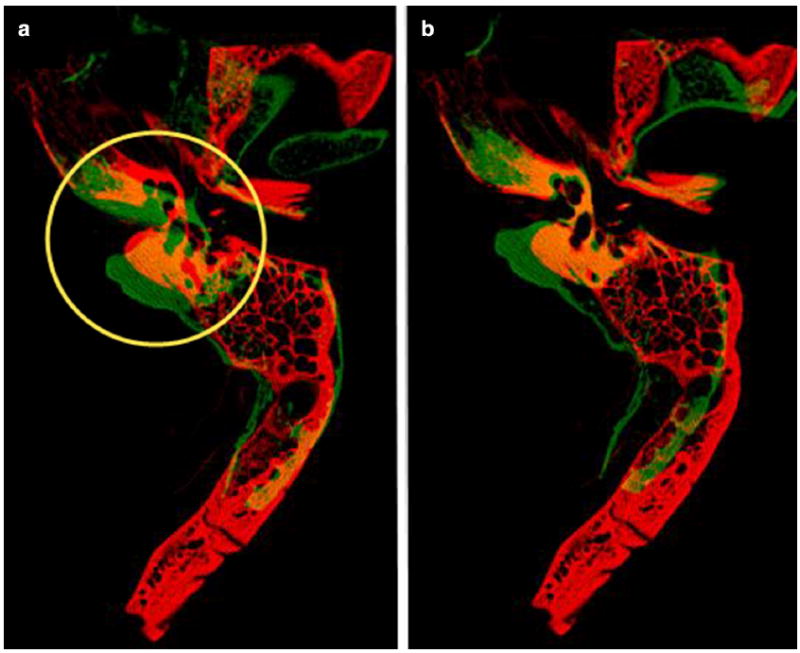
a Result of first rigid body registration using whole bone. The yellow circle indicates the otic capsule and the ROI used for the second rigid body registration, b Result of second rigid body registration using ROI indicated in a. Red indicates reference image and green indicates the moving image
Segmentation
ROI masks for each structure (cochlea, malleus, incus, stapes, lateral SCC, posterior SCC, superior SCC, vestibule, facial nerve) were manually traced using an average image of 6 spatially registered (3 left and 3 rights) data sets (Fig. 2). The manually traced masks were dilated by three voxels to allow for slight variation in size and position of structures.
Fig. 2.
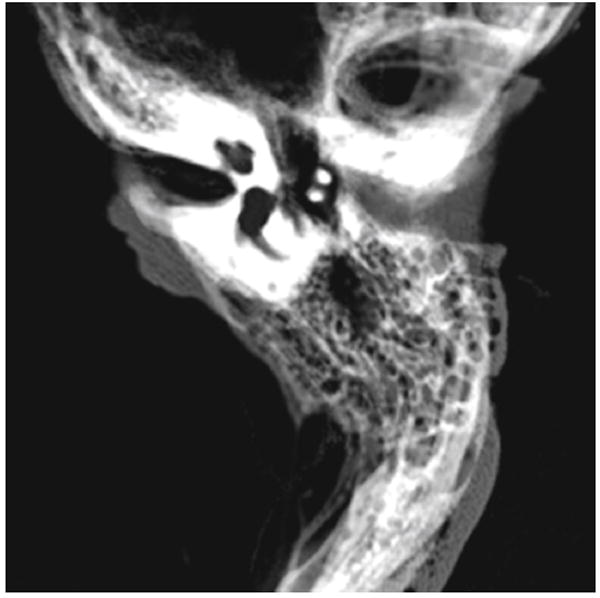
Average image of the six spatially aligned bones used to build the atlas for segmentation. This image illustrates how the structures are spatially conserved in and around the otic capsule which makes an atlas-based approach suitable for segmentation
The 16-bit images were linearly rescaled to 8-bit so that bone and soft tissue were present in the image for automated segmentation. The images were resampled to an isotropic voxel size of 0.232 × 0.232 × 0.232 mm for further processing and aligned with the reference image and the ROI atlas using the rigid body transformations determined in the automated registration step. An unsharp mask (sigma = 1.5, mask weight = 0.6) was used to enhance bony structures in the image. Otsu’s multilevel threshold [4] was then applied to each slice to segment the image into three components (background, soft tissue, and bone). The malleus and incus were segmented using the ROI mask and segmented bone from Otsu’s multi threshold. The cochlea, SCCs, and vestibule were segmented using the ROI mask and the soft tissue and background from Otsu’s multi threshold. The initial segmentation for each of these structures was ‘cleaned’ by performing a 3D opening operation on each structure and using a connected components algorithm [5] to remove all objects except the largest object (Fig. 3). The malleus and incus structures were further refined by dilating the objects by one voxel and adding in segmented soft tissue from Otsu’s multi threshold. The stapes was segmented by convolving a 5 × 5 square sharpening filter (central pixel = 24, surrounding pixels = −1) with the original image, globally segmenting the filtered image in the ROI mask, and size excluding objects less than 0.32 mm3.
Fig. 3.
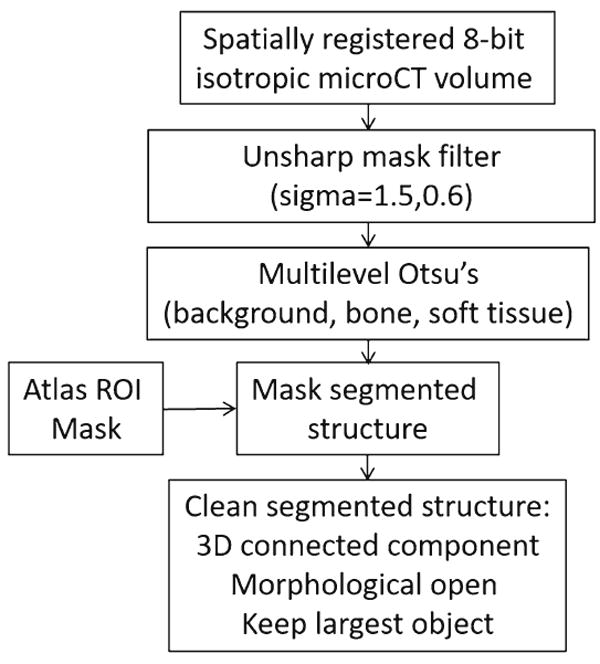
Segmentation flowchart (cochlea, malleus, incus, lateral SCC, posterior SCC, superior SCC, vestibule)
The facial nerve was segmented using three different masks, one in the tympanic and two in the mastoid region. The tympanic region of the facial nerve was segmented using the manually outlined ROI mask. The mask for the upper part of the mastoid region was based on the observation that this segment of the facial nerve is fairly straight. Therefore, a maximum intensity projection (MIP) image over that region was used to segment the facial nerve using the last slice of the tympanic region as a reference. In the lower region of the mastoid, where the nerve starts to curve toward the stylomastoid foramen, a fixed mask ROI of 13 × 13 pixels centered about the segmented nerve from the previous slice was used for spatially tracking the nerve in this segment. The initial facial nerve segmentation was ‘cleaned’ by eroding the segmentation by one voxel in each slice and tracking the segmented object with the nearest centroid along the length of the facial nerve. The entire segmented nerve was then dilated by one voxel.
Validation
The results from the automated segmentations were visually and quantitatively evaluated. For the quantitative evaluation, the temporal bone structures were manually traced in the CT images by a technician trained in temporal bone anatomy (BH) and confirmed by an experienced surgeon (GW). Three quantitative metrics, DICE, average Hausdorff distance (avg HD), and volume similarity (VS), were reviewed for each structure using Taha and Hanbury’s [6] quantitative evaluation tool. The DICE coefficient is a measure of the amount of overlap between two segmented structures. The average Hausdorff distance is the Hausdorff distance averaged over all points and volume similarity measures how close the two segmented volumes are. In the case of lower DICE values, the average Hausdorff distance and volume similarity indicate whether the segmentations are similar but possibly shifted in space from one another. Visual verification was performed by comparing the automatically segmented structures with the manually segmented structures in a 2D and 3D viewer.
Results
An example of the results of the rigid body registrations is shown in Fig. 1. The red bone is the reference image, and the green bone is the moving image. Where the two bones overlap, you will observe yellow. The registration in the otic capsule, where the temporal bone anatomy is usually similar between subjects, is visually accurate. This is further illustrated in the average image of the six spatially registered images used for the atlas displayed in Fig. 2.
An example of the automated segmentation based on the ROI masks is presented in Fig. 4. The labeled structures are color-coded for easy reference. Overall, the segmentation of the structures looks consistent between the manually and automatically segmented images with slight differences observed in the delineation of the SCCs.
Fig. 4.
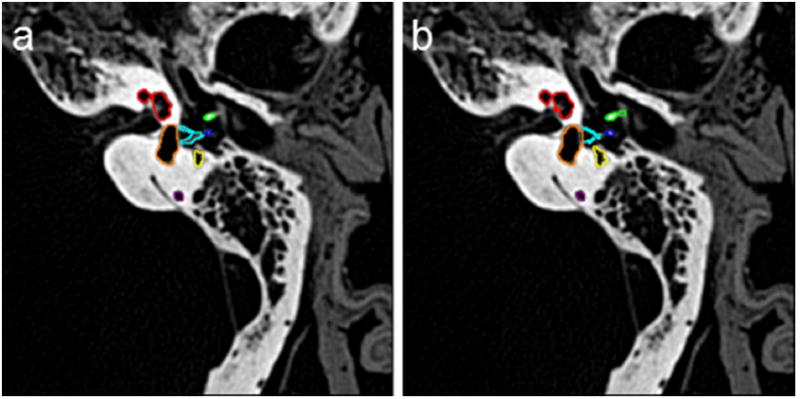
2D example of a manual and b automated segmentation (red-cochlea, green-malleus, blue-incus, aqua-stapes, orange-vestibule, yellow-facial nerve)
A 3D volume rendering of the manually and automatically segmented structures is presented in Fig. 5. This further illustrates the quality of the automated segmentation. The results of the quantitative metrics are presented in Table 2. The DICE metrics are on the order of 0.70 or greater for all structures except the stapes. A DICE value of greater than 0.7 is considered to be good agreement between the structures [7]. The average Hausdorff distance is less than one voxel for all structures, and the volume similarity was 0.86 or greater for all structures except the stapes. The DICE metrics are lowest for the stapes, individual SCCs, and the facial nerve. However, when we combine the vestibule and SCCs into one segmented object, the DICE metric increases close to 0.90. This is in part due to the difficulty of delineating the starting and ending points of the separate semicircular canals. The DICE metric for the stapes is much lower than would be acceptable for structure correspondence although visual inspection of the automated segmentation of the stapes confirmed that the stapes is segmented correctly and is very similar to that of the manual tracing but is smaller in overall volume (see stapes highlighted in aqua in Fig. 4). This is reflected in the volume similarity metric that indicates that the automated segmentation volume is approximately half that of the manually traced volume.
Fig. 5.
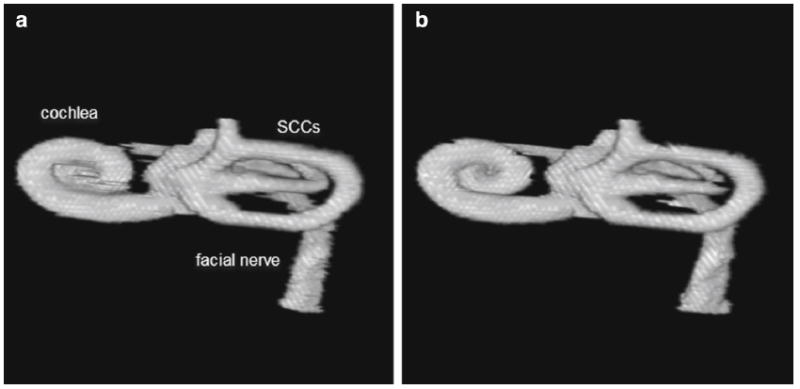
3D rendering of structures obtained from a manual and b automated segmentation
Table 2.
Quantitative metrics—mean (SD)
| Lefts
|
Rights
|
|||||
|---|---|---|---|---|---|---|
| DICE | AVG HD | VS | DICE | AVG HD | VS | |
| Cochlea | 0.91 (0.01) | 0.17 (0.04) | 0.98 (0.01) | 0.90 (0.03) | 0.22 (0.09) | 0.98 (0.02) |
| Malleus | 0.80 (0.04) | 0.25 (0.07) | 0.91 (0.06) | 0.80 (0.05) | 0.29 (0.15) | 0.95 (0.05) |
| Incus | 0.83 (0.03) | 0.21 (0.05) | 0.93 (0.04) | 0.83 (0.04) | 0.20 (0.06) | 0.93 (0.05) |
| Stapes | 0.58 (0.03) | 0.51 (0.05) | 0.51 (0.05) | 0.48 (0.04) | 0.48 (0.04) | 0.48 (0.04) |
| Facial nerve | 0.73 (0.10) | 0.92 (0.95) | 0.91 (0.05) | 0.68 (0.09) | 0.77 (0.35) | 0.89 (0.05) |
| Lateral SCC | 0.75 (0.11) | 0.58 (0.80) | 0.90 (0.09) | 0.73 (0.23) | 0.97 (1.92) | 0.91 (0.06) |
| Posterior SCC | 0.76 (0.07) | 0.66 (0.36) | 0.88 (0.07) | 0.82 (0.10) | 0.61 (1.04) | 0.93 (0.10) |
| Superior SCC | 0.75 (0.09) | 0.68 (0.44) | 0.86 (0.11) | 0.81 (0.10) | 0.53 (0.71) | 0.90 (0.06) |
| Vestibule | 0.82 (0.02) | 0.48 (0.14) | 0.92 (0.05) | 0.82 (0.04) | 0.36 (0.12) | 0.97 (0.03) |
| Vestibule + SCCs | 0.89 (0.05) | 0.21 (0.18) | 0.96 (0.05) | 0.88 (0.08) | 0.30 (0.43) | 0.97 (0.04) |
Discussion
Our overall goal was to develop an automated segmentation approach that could identify critical structures for visual enhancement and assessment of performance in our surgical simulation software. The results of visual inspection of the segmentation and the validation metrics for our method indicate that the atlas-based approach we have developed is good. For example, the DICE metrics are greater than 0.8 for most structures, the volume similarity is 0.86 or greater for most structures, and the average Hausdorff distance is less than one voxel for all structures. The two structures that had lower DICE metrics were the stapes and facial nerve. Although the mean stapes DICE metric was very low, it was segmented correctly. The DICE metric is not a suitable metric for evaluating small thin structures [6,8], and the stapes is only 2 voxels thick at this spatial resolution. Its thin size coupled with its low gray-level intensity makes it difficult to manually trace and segment. The mean facial nerve DICE metric is on the order of 0.7. Although this is lower than some of the other structures, like the cochlea and semicircular canals, we do not visually observe any significant errors in the segmentation. The variation may be primarily due to differences in manual tracing and automated segmentation along the tympanic region of the facial nerve where there is not always a clear boundary observed.
Our results are comparable to an atlas-based approach developed by Noble et al. [9,10]. Although our atlas-based approach is similar to theirs, it differs primarily in two aspects. First, Nobel et al.’s atlas segmentation uses a local deformation registration after the global registration for obtaining the structure contours, whereas our approach uses intensity segmentation restricted to masked ROIs to identify the contours of the structures. Second, the Nobel et al. approach uses a model-based technique for segmenting the facial nerve and chorda [9], whereas we use intensity-based segmentation and masked ROI approach to segment the facial nerve and do not propose a segmentation approach for the chorda. We chose our approach based on ease of implementation and determined that it performed as well as their approach. Although our method has not been tested on cases with pathology, 3D registration of new data sets within a standard atlas space allows for rapid visual inspection of anatomical variation and faster manual delineation of structures when necessary.
Previous 3D visualization studies of the middle and inner ear used manual segmentation methods [11] that took many hours to perform or a semiautomated approach [12] that requires an experienced investigator. Segmentation times on the order of 1 h–1 day were observed by Chan et al. [13] using the commercially available software package Amira (FEI, Oregon USA) to prepare data for their surgical simulator. A further review of publically available software packages by Hassan et al. [14] resulted in the observation that one segmentation approach was inadequate for all anatomical structures of interest and would require an experienced user from one to 2 h to prepare the data for patient specific surgical simulation. Our approach currently takes less than 5 min to perform and could be further optimized for real-time applications.
A temporal bone surgical simulation using Voxelman [15] used a semiautomated global segmentation for 3D reconstruction. The authors found that there was a significant upload time due to the segmentation process. Additionally, they observed that rehearsals of surgical applications that involved facial nerve were not possible due to lack of delineation of soft tissue structures. Our segmentation method delineates the facial nerve canal and incorporates the location of the facial nerve in the simulator as indicated by the yellow arrow in Fig. 6.
Fig. 6.
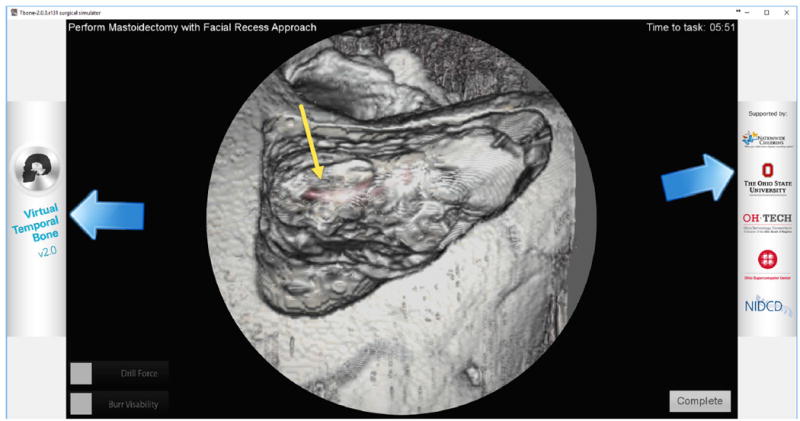
Example of use of segmented facial nerve (red) in simulation of mastoidectomy. The yellow arrow points to the segmented facial nerve canal as seen through bone after it has been drilled out using the simulator
Higher-resolution images available from microCT imaging systems provide better delineation of fine structures such as the stapes and corda tympana. However, this is at the expense of increased image size. Lee et al. [16] developed a volume visualization and haptic interface system for measurement of 3D structures. They used microCT images of cadaver specimens with a voxel size of 19.5 μm and 2048 by 2048 pixels per slice. In some cases, the microCT images had to be downsized in order to achieve real-time manipulations. As workstations with increased GPU capabilities become more widespread, this becomes less of an issue. However, there is still a practical issue that must be taken into consideration with manipulating and storing these larger images.
Cone-beam computed tomography (CBCT)-guided surgery systems are currently being evaluated for temporal bone surgery [17-20]. The spatial resolution of these systems are generally lower than the multi-detector computed tomography scanners, but they are faster with lower X-ray dose than MDCT and produce isotropic voxels. Many of the previous studies evaluating CBCT-guided surgery systems relied on preset transfer functions and visual identification of critical structures. The TREK system developed at John Hopkins University [20] makes use of existing open-source software for image registration and post- processing. Critical structures were segmented and color-coded for rapid identification and visualization of critical structures for interoperative surgery. Use of fast, atlas-based automatic segmentation could deliver personalized anatomical identification during surgery.
We plan to enhance our automated segmentation algorithm to improve the delineation of the separate SCCs, to develop an automated method for tracking the chorda tympani and segmentation of surface bony landmark structures such as the tegmen and sigmoid sulcus.
Acknowledgments
This research was supported by NIDCD/NIH 1R01-DC011321.
Footnotes
Conflict of interest The authors declare that they have no conflict of interest.
Compliance with ethical standards
Ethical approval All procedures performed in studies involving human participants were in accordance with the ethical standards of the institutional and/or national research committee and with the 1964 Helsinki Declaration and its later amendments or comparable ethical standards.
Informed consent For this type of study, formal consent is not required.
References
- 1.Klein S, Staring M, Murphy K, Viergever MA, Pluim JPW. Elastix: a toolbox for intensity based medical image registration. IEEE Trans Med Imaging. 2010;29:196–205. doi: 10.1109/TMI.2009.2035616. [DOI] [PubMed] [Google Scholar]
- 2.Shamonin DP, Bron EE, Lelieveldt BPF, Smits M, Klein S, Staring M. Fast parallel image registration on CPU and GPU for diagnostic classification of Alzheimer’s disease. Front Neuroinform. 2014;7:1–15. doi: 10.3389/fninf.2013.00050. [DOI] [PMC free article] [PubMed] [Google Scholar]
- 3.Klein S, Staring M. Elastix the manual. 2014 http://elastix.isi.uu.nl/
- 4.Otsu N. A threshold selection method from gray-level histogram. IEEE Trans Syst Man Cybern SMC. 1979;9:62–66. [Google Scholar]
- 5.Gonzalez RC, Woods RE. Digital image processing. Pearson Prentice Hall Inc; Upper Saddle River: 2008. [Google Scholar]
- 6.Taha AA, Hanbury A. Metrics for evaluating 3D medical image segmentation: analysis, selection, and tool. BMC Med Imaging. 2015;15(29):1–28. doi: 10.1186/s12880-015-0068-x. [DOI] [PMC free article] [PubMed] [Google Scholar]
- 7.Zijdenbos AP, Dawant BM, Margolin RA, Palmer A. Morphometrics analysis of white matter lesions in MR images: method and validation. IEEE Trans Med Imaging. 1994;13(4):716–724. doi: 10.1109/42.363096. [DOI] [PubMed] [Google Scholar]
- 8.Noble JH, Labadie RF, Majdani O, Dawant BM. Automatic segmentation of intra-cochlear anatomy in conventional CT. IEEE Trans Biomed Eng. 2010;58(9):2625–2632. doi: 10.1109/TBME.2011.2160262. [DOI] [PMC free article] [PubMed] [Google Scholar]
- 9.Noble JH, Warren FM, Labadie RF, Dawant BM. Automatic segmentation of the facial nerve and chorda tympani in CT images using spatially dependent feature analysis. Med Phys. 2008;35:5375–5384. doi: 10.1118/1.3005479. [DOI] [PMC free article] [PubMed] [Google Scholar]
- 10.Noble JH, Dawant BM, Warren FM, Labadie RF. Automatic identification and 3D rendering of temporal bone anatomy. Otol Neurotol. 2009;30:346–442. doi: 10.1097/MAO.0b013e31819e61ed. [DOI] [PMC free article] [PubMed] [Google Scholar]
- 11.Rodt T, Raiu P, Becker H, Bartling S, Kacher DF, Anderson M, Jolesz FA, Kikinis R. 3D visualisation of the middle ear and adjacent structures using reconstructed multi-slice CT datasets, correlating 3D images and virtual endoscopy to the 2D cross-sectional images. Neuroradiology. 2002;44:783–790. doi: 10.1007/s00234-002-0784-0. [DOI] [PubMed] [Google Scholar]
- 12.Seemann MD, Seemann O, Bonel H, Suckfull M, Englmeier K-H, Naumann A, Allen CM, Reiser MF. Evaluation of the middle and inner ear structures: comparison of hybrid rendering, virtual endoscopy and axial 2D source images. Eur Radiol. 1999;9:1851–1858. doi: 10.1007/s003300050934. [DOI] [PubMed] [Google Scholar]
- 13.Chan S, Li P, Locketz G, Salisbury K, Blevins NH. High fidelity haptic and visual rendering for patient-specific simulation of temporal bone surgery. Comput Assist Surg. 2016;21:85–101. doi: 10.1080/24699322.2016.1189966. [DOI] [PubMed] [Google Scholar]
- 14.Hassan K, Dort JC, Sutherland GR, Chan S. Evaluation of software tools for segmentation of temporal bone anatomy. Proc Med Meets Virtual Real. 2016;22:130–133. [PubMed] [Google Scholar]
- 15.Arora A, Swords C, Khemani S, Awad Z, Darzi A, Singh A, Tolley N. Virtual reality case-specific rehearsal in temporal bone surgery: a preliminary evaluation. Int J Surg. 2014;12:141–145. doi: 10.1016/j.ijsu.2013.11.019. [DOI] [PubMed] [Google Scholar]
- 16.Lee DH, Chan S, Salisbury C, Kim N, Salisbury K, Puria S, Blevins NH. Reconstruction and exploration of virtual middle-ear models derived from micro-CT datasets. Hear Res. 2010;263:198–203. doi: 10.1016/j.heares.2010.01.007. [DOI] [PMC free article] [PubMed] [Google Scholar]
- 17.Rafferty MA, Siewerdsen JH, Chan Y, Daly MJ, Moseley DJ, Jaffray DA, Irish JC. Intraoperative cone-beam CT for guidance of temporal bone surgery. Otolaryngol Head Neck Surg. 2006;134:801–808. doi: 10.1016/j.otohns.2005.12.007. [DOI] [PubMed] [Google Scholar]
- 18.Barker E, Trimble K, Chan H, Ramsden J, Nithiananthan S, James A, Bachar G, Daly M, Irish J, Siewerdsen J. Intraoperative use of cone-beam computed tomography in a cadaveric ossified cochlea model. Otolaryngol Head Neck Surg. 2009;140:697–702. doi: 10.1016/j.otohns.2008.12.046. [DOI] [PMC free article] [PubMed] [Google Scholar]
- 19.Erovic BM, Chan HHL, Daly MJ, Pothier DD, Yu E, Coulson C, Lai P, Irish JC. Intraoperative cone-beam computed tomography and multi-slice computed tomography in temporal bone imaging for surgical treatment. Otol Neurotol. 2014;150:107–114. doi: 10.1177/0194599813510862. [DOI] [PubMed] [Google Scholar]
- 20.Uneri A, Schafer S, Mirota DJ, Nithiananthan S, Otake Y, Taylor RH, Siewerdsen JH. TREK: and integrated system architecture for intraoperative cone-beam CT-guided surgery. Int J CARS. 2012;7:159–173. doi: 10.1007/s11548-011-0636-7. [DOI] [PMC free article] [PubMed] [Google Scholar]


