Abstract
Here we describe three new small-molecule activators of BMP signaling found by high throughput screening of a library of ~600,000 small molecules. Using a cell-based luciferase assay in the BMP4-responsive human cervical carcinoma clonal cell line, C33A-2D2, we identified three compounds with similar chemotypes that each ventralize zebrafish embryos and stimulate increased expression of the BMP target genes, bmp2b and szl. Because these compounds ventralize zebrafish embryos, we have termed them “ventromorphins.” As expected for BMP pathway activators, they induce the differentiation of C2C12 myoblasts to osteoblasts. Affymetrix RNA analysis confirmed the differentiation results and showed that ventromorphins treatment elicits a response similar to BMP4 treatment. Unlike Isoliquiritigenin (SJ000286237), a flavone that maximally activates the pathway after 24 hours of treatment, all three ventromorphins induced SMAD1/5/8 phosphorylation within 30 minutes of treatment and achieved peak activity within 1 hour, indicating that their responses are consistent with directly activated BMP signaling.
Keywords: BMP signaling, high throughput screening, SMAD1/5/8, ID1, BMP4, zebrafish, C2C12, C33A, osteoblast differentiation
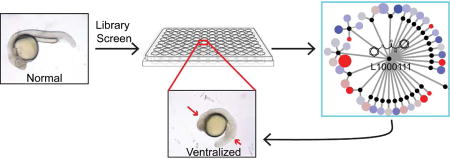
TOC image
Introduction
Bone Morphogenetic Proteins (BMPs) are members of the Transforming Growth Factor Beta (TGFβ) family of secreted signaling molecules. BMPs, originally described as inducers of bone and cartilage formation,1 are widely conserved across phyla with family members found in vertebrates, arthropods, and nematodes.2 BMP signaling governs diverse biological processes including embryonic patterning and development,2–4 stem cell renewal and differentiation,4, 5 tissue homeostasis,4, 6 and bone development.4 The twelve BMP family members form homo- and heterodimers and bind to type I and type II serine-threonine kinase transmembrane receptors.7–9 BMP2 and BMP4 bind with high affinity to the type I BMPR1A (ALK3) and BMPR1B (ALK6) receptors, while TGFβ and activins bind to the type IA activin receptor (ALK2).7–9 BMP2 and BMP4 binding induces the formation of a heterotetrameric complex composed of two BMPR1A and/or BMPR1B receptors and two BMPR2 receptors. In turn, constitutively activated BMPR2 receptors transphosphorylate BMPR1A, thereby activating its serine-threonine kinase activity.10 The activated heterotetrameric complex recruits intracellular signal transduction proteins of the Similar to Mothers Against Decapentaplegic (SMAD) family, SMAD1, SMAD5, or SMAD8, which are phosphorylated at the C-terminus.11, 12 Phospho-SMADs1/5/8 (p-SMAD1/5/8) interact with SMAD4 and translocate to the nucleus where they activate transcription of target genes such as Inhibitor of DNA Binding 1 (ID1) and ID2.13
Medulloblastoma, a cerebellar tumor, is the most common malignant pediatric brain tumor. It is characterized by four major subgroups, one of which displays constitutively activated Sonic Hedgehog (SHH) signaling.14–17 BMP2 and BMP4 antagonize SHH signaling,18 and BMP4 signaling induces irreversible differentiation of cerebellar granule neuronal progenitors (GNPs) and tumor cells from the SHH medulloblastoma subgroup.19 This finding suggested that BMP agonists might be useful as differentiation therapy for SHH medulloblastoma. Because BMP homodimers do not cross the blood brain barrier, their use as potential therapy for medulloblastoma is not an option.
Several groups, including our own, have previously identified agonists of BMP signaling, however the effects of these compounds are modest at best. Rapamycin, a mTOR inhibitor, causes upregulation of BMP2 which promotes osteoblastic differentiation.20 Spiekerkoetter et al. identified an activator of BMPR2, FK506 (tacrolimus), using a low-throughput compound screen.21 We previously identified isoliquiritigenin (SJ000286237), as an agonist of BMP signaling,22 however this chalcone scaffold raised concerns for further chemical optimization since it is from a pan assay interference compound (PAINS) class.23 To identify additional compounds that might be amenable to chemical modification for improved activity and metabolic availability, we screened a library of ~600,000 compounds using a BMP-responsive luciferase cell-based assay. We report identification of three compounds with similar chemotypes, which induced BMP signaling in a variety of assays, including morphological ventralization of zebrafish embryos, in vivo activation of direct and indirect BMP4 targets, induction of SMAD1/5/8 phosphorylation, and myoblast differentiation to osteoblasts. Based upon the ability of these compounds to ventralize zebrafish embryos, we have termed them “ventromorphins.”
Results and Discussion
Cell-based HTS assay
To find new compounds that act as BMP4 signaling agonists, we performed a high throughput screen (HTS) of a library of 643,432 compounds at a fixed concentration of 10μM using a BMP-responsive luciferase cell-based assay in a 384-well plate format. Results of the primary screen are shown in Figure S1. The average Z-prime was 0.71. Relative compound activity was calculated by subtracting the background from the DMSO negative control [compound – median (DMSO)], using log2-transformed luciferase Relative Luminescence Units (RLUs). We defined a hit as any compound displaying activity greater than two standard deviations above the median DMSO negative control signal. This generated a list of 5,287 compounds for hit validation.
For further chemical structure analysis, we performed topology mapping and clustering.24 Of the 5,287 active compounds, 267 were natural product fractions and had no defined scaffold. The remaining set of molecules were abstracted into 3,247 Bemis-Murcko scaffolds,25 which indicated sparse sampling among closely related structural analogs (1.6 molecules per scaffold). Further abstraction and clustering of the resulting scaffolds yielded the scaffold network diagram in Figure 1.
Figure 1. Summary of the high-throughput screen and hit identification.
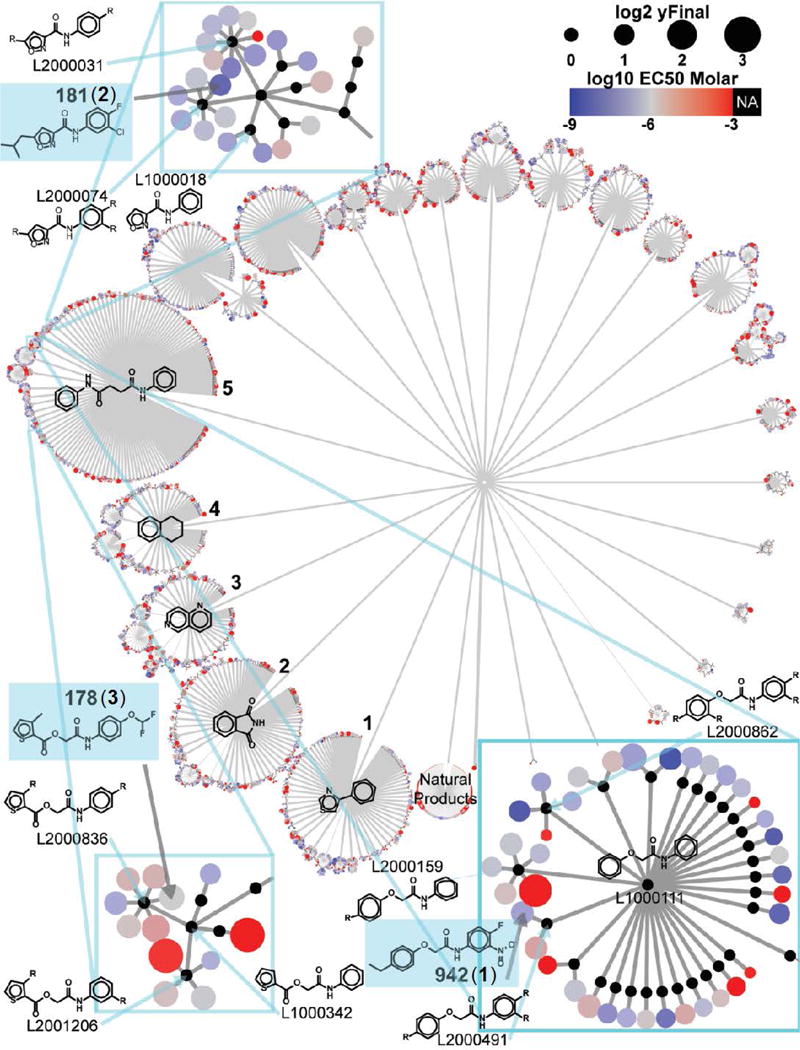
Network Graph showing the chemical structures of 5,287 hits selected based on the hit criteria from the preliminary screen. Similar structures cluster together in the branches of the network based on their molecular topology. Structure of the three hits [SJ000291942 (1), SJ000063181 (2), and SJ00037178 (3)] grouped in cluster 5 and are highlighted in blue boxes.
Selection of BMP signaling activators SJ000291942, SJ000063181, and SJ000370178
We determined the dose response of the 5,287 active compounds using a 10-point, 3-fold serial dilution, downwards from a top concentration of 50 μM. These experiments were performed in triplicate. 2,534 compounds produced reliable (R2>0.8) fits to the Hill equation giving a sigmoidal concentration-response curve. Of these, 1,604 had an EC50≤1 μM and were designated validated hits. The natural product fractions and the five largest scaffold clusters (numbered 1-5 and annotated with the structure of the cluster head) accounted for 53% of all compounds tested in dose-response. The largest cluster, represented by the diphenylsuccinamide scaffold (cluster 5), contained 834 compounds. A summary of the screening cascade is shown in Figure S2.
Despite identifying a significant number of validated hits (EC50≤1 μM), ~94% of all compounds tested in dose-response had low to modest efficacy (magnitude of response ≤4-fold the DMSO signal). Although such responses were statistically significant, their biological significance was unclear. Furthermore, certain compounds produced non-sigmoidal dose-response curves that suggested BMP pathway activation at low concentration and cytotoxicity at higher concentrations. Because small molecule activators of BMP signaling do not exist, it is difficult to define a reasonable minimal response.
BMP-signaling activators ventralize zebrafish embryos
Zebrafish have previously proven to be a useful platform for identifying compounds that modulate signaling pathways including the BMP pathway.22, 26–28 BMP signaling in vertebrates, including zebrafish, directs the formation of ventral tissues and genetic markers. Stereotypical phenotypes and gene expression resulting from increased or decreased specification of ventral tissue can provide a means to validate compounds and identify compounds that modulate BMP signaling activity.
We utilized a zebrafish phenotypic screen to test the ability of 97 hits validated by dose-response to activate the BMP pathway and produce a ventralized phenotype. The set of 97 compounds sampled 16 of the 27 existing scaffold clusters, with over 70% of compounds coming from the five largest clusters, labeled 1-5 (Figure 1). Of the tested hits, 4 showed activity at all concentrations tested but failed to fit the Hill equation (‘Super Active’); 62 compounds demonstrated sigmoidal dose-response behavior and good potency (EC50≤1 μM, ‘Sigmoidal’); 18 had non-sigmoidal behavior (‘Inverse’); 6 were only active at the highest concentration tested (‘Single-Point’); and 7 showed no response at any concentration tested (‘Inactive’) (Figure 2). The ‘Single-Point’ and ‘Inactive’ classes were expected to be inactive in the phenotypic assay and were considered negative controls. ‘Super Actives’ tend to be either highly potent compounds that were screened at too high a concentration or the result of assay artifacts. We expected most true positives in the zebrafish assay to be from the ‘Sigmoidal’ and ‘Inverse’ classes. The HTS and phenotypic screening results are reported in Table S1. This screen identified three compounds, SJ000291942 (compound 1), SJ000063181 (compound 2), and SJ000370178 (compound 3) as positive hits at 1μM (Figure 3).
Figure 2. Structure Activity Relationship (SAR) study using cScore, EC50 and zebrafish phenotypic screen.
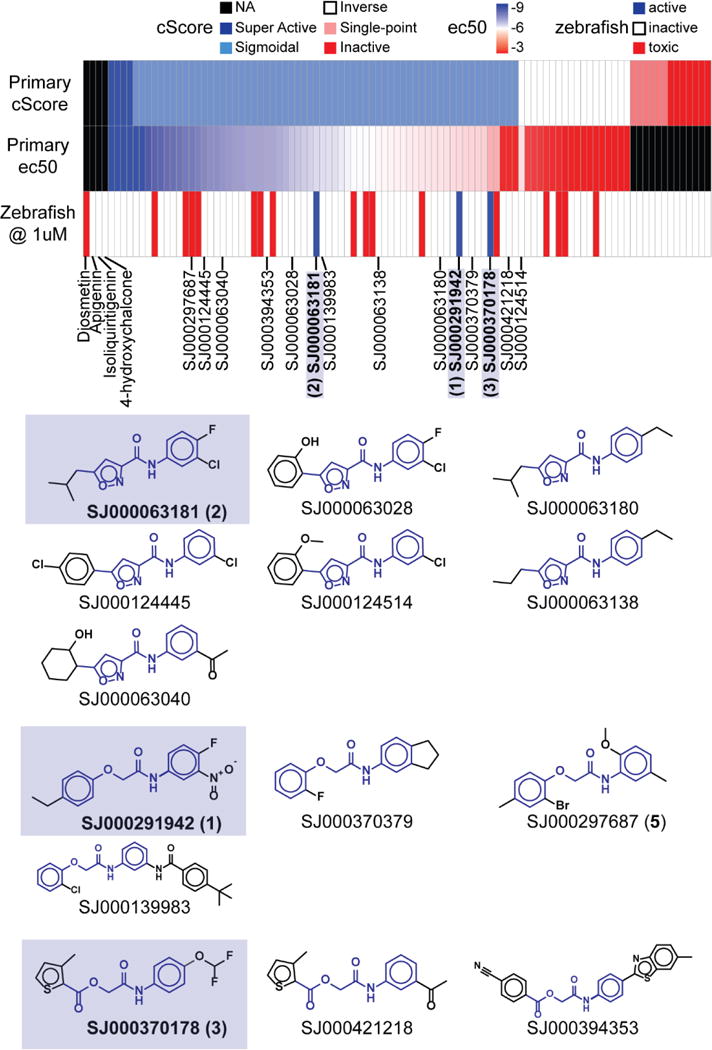
Three validated hits in the zebrafish assay [SJ000291942 (1), SJ000063181 (2), and SJ00037178 (3)] exhibited well-behaved dose-response curves class (‘Sigmoidal’) in the cell-based assay by cScore.
Figure 3. Dose-response of the three compounds in ventralization of zebrafish embryos.
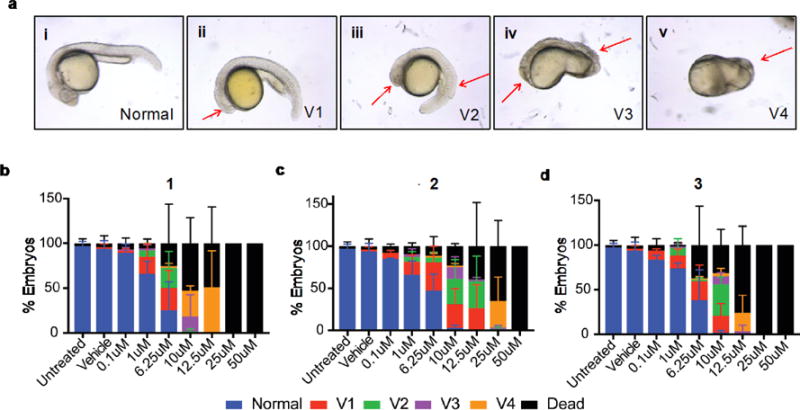
(a) Representative images (i-v) of increasing ventralized phenotypes at 24hpf. Red arrows indicate major areas of ventralization (ii-v). Distribution of phenotypes caused by each compound, 1 (b), 2 (c), and 3 (d), at the indicated doses following treatment of embryos beginning at 2hpf and scored at 24hpf. Graphs represent percent±SEM of embryos displaying a given phenotype in three independent experiments, with 20-60 embryos per condition.
During early axis patterning BMP signaling directs ventral tissue formation in zebrafish. Ectopic activation of the BMP pathway leads to a spectrum of ventralized phenotypes (Figure 3a i–v) ranging from mild cyclopia (V1; Figure 3a ii) and headlessness (V3, Figure 3a iv) to loss of all dorsoanterior tissues (V4, Figure 3a v). We examined the phenotypes of embryos treated with dose escalations of the test set of validated hits, including the BMP activator SJ000286237 (Isoliquiritigenin, compound 4) as a positive control, and scored them using this scheme.22 All three compounds tested caused a dose-dependent ventralization of the zebrafish embryo at 24 hours post fertilization (hpf). Embryos treated with 1 displayed the most severe ventralization and this compound was also the most potent. Interestingly, 1 also caused more mortality, and at lower doses than controls and the other two compounds. This demonstrates our compounds cause ventralization of embryos consistent with increased BMP signaling activity.
Interestingly, while all compounds in the ‘Single-point’ and ‘Inactive’ classes were inactive in the zebrafish assay, the three phenotypically active compounds all belonged to the class producing well-behaved, dose-response curves (‘Sigmoidal’) in the cell-based assay (Figure 2). However, these three compounds were not among the most potent compounds in that screen. Sixteen compounds, all from the ‘Sigmoidal’ and ‘Inverse’ classes, were toxic. We previously reported that the chalcones, 4, and 4-hydroxychalcone, induced a ventralization phenotype at concentrations ≥5μM, whereas the 2 flavones, diosmetin and apigenin, did not.22 Both chalcones failed to show any appreciable phenotype at 1μM, suggesting that the three novel compounds reported in this work have higher potency in vivo. The compounds 1, 2, and 3 were topologically similar N-phenylamides representing scaffold cluster 5 (Figure 2). We also identified several close analogs in the set of 97 compounds which we assayed in the phenotypic screen: all were inactive except for SJ000297687 (compound 5) which was toxic. Interestingly, this chemotype has been found to be an agonist in several unrelated luciferase screens including a SMN2 screen that identified a compound, LDN-75654, which is very similar to compound 2.29–31 The FDA-approved drugs leflunomide and its active form teriflunomide have a similar chemotype to our three hits. Leflunomide has been previously studied30, 32 and was in our initial compound screen but it did not meet the requirements to pass the EC50 cut off. We tested leflunomide and teriflunomide in zebrafish, but neither caused ventralization in zebrafish embryos (Figure S3), although they did show the previously observed ability to inhibit neural crest differentiation to pigment.
Ventromorphins induce BMP-responsive genes in zebrafish embryos
Our experiments indicate that the three compounds produce embryonic phenotypes consistent with activated BMP signaling. To evaluate whether these responses indeed arise from BMPR activation, we analyzed the expression of genes that are established direct targets of BMP signaling, bone morphogenetic protein 2b (bmp2b),33–36 even-skipped-like 1 (eve1),36–39 and sizzled (szl)36, 40 whole mount in situ hybridization of zebrafish embryos treated with compound and controls. Compounds 1, 2, and 3 all caused an increase in bmp2b (Figure 4a–e) and szl expression (Figure 4f–j). However, we did not observe an increase in eve1 expression (Figure 4k–o). These data indicate that in embryos, ventromorphins activate a subset of BMP signaling responses, likely either because they engage restricted elements of the BMP signal transduction machinery or because they activate additional modulatory programs.
Figure 4. Expression of BMP target genes in gastrula stage embryos.
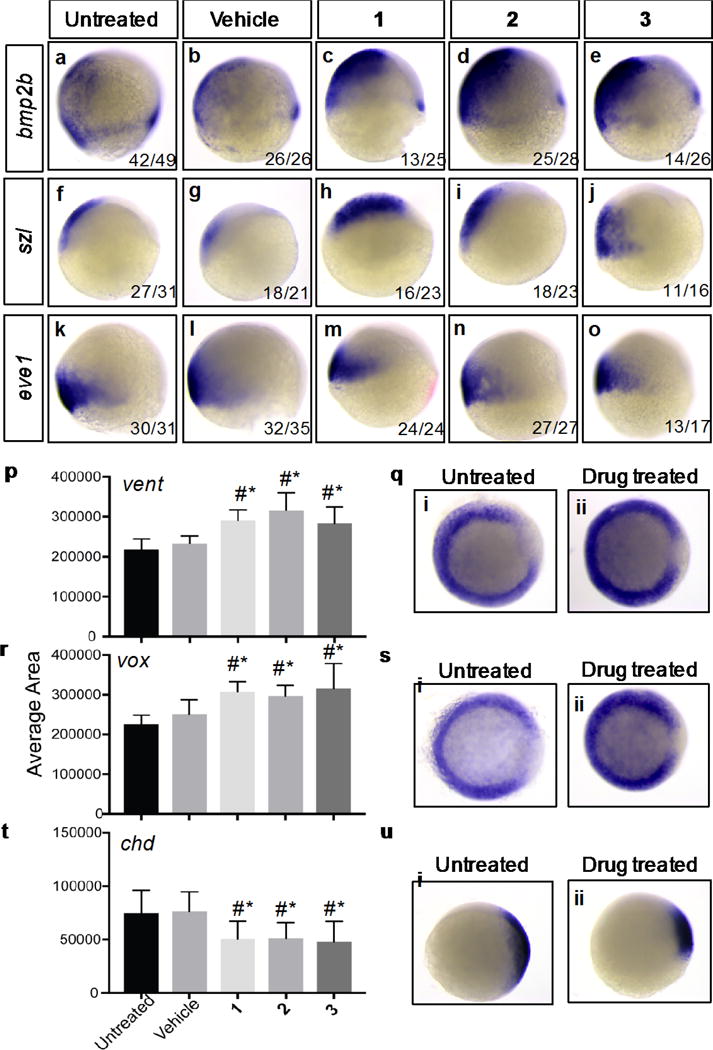
Zebrafish embryos were treated with 6.25μM of each compound beginning at 2 hours post fertilization (hpf) and examined for RNA expression patterns by in situ hybridization at 8hpf (a–o) or 6hpf (q,s,u). 8hpf (75% epiboly) embryos were examined for bmp2b (a–e), szl (f–j), and eve1 (k–o) expression. At 6hpf (shield stage) embryos were fixed and expression of the positive BMP targets vent (p,q) and vox (r,s) and the negative target chd (t,u) were examined by whole mount in situ hybridization and quantified using ImageJ. Representative untreated and compound treated expression shown right (q,s,u). Data represents average area of mRNA expression in three independent experiments and a total of 40-70 embryos per treatment.
We also examined indirect or cooperatively induced BMP targets. These included the transcriptional repressors vox (also known as vega1) and vent (also known as vega2), as well as chd, which encodes a secreted BMP inhibitor, and is repressed by vent and vox.41–43 As would be expected for embryos with ectopic BMP signaling, all three compounds expanded expression of the ventralization markers, vent (Figure 4p, q) and vox (Figure 4r, s), and decreased expression of the negative target chd compared to controls (Figure 4t, u). Together our data reveal that the ventromorphins induce phenotypic and genetic ventralization.
Ventromorphins activate BMP signaling responses in cell culture
Our zebrafish assays suggested that the compounds activate the canonical BMP signaling pathway. To extend these observations, we performed immunoblotting of protein lysates from C33A-2D2 cells stimulated with compounds at different times. All three compounds activated phosphorylation of SMAD1/5/8 (Figure 5, Figure S4) in serum-free medium (Figure S5). Like in zebrafish embryos, compound 1 was most active. It induced p-SMAD1/5/8 maximally at 1hr of treatment (Figure 5a–c). In contrast, 2 (Figure 5d–f) and 3 (Figure 5g–i) achieved peak activity 0.5hrs after stimulation. Compound 2 was the weakest activator of SMAD phosphorylation, with minimal increase in p-SMAD1/5/8 over control.
Figure 5. Activation of the canonical BMP signaling pathway.
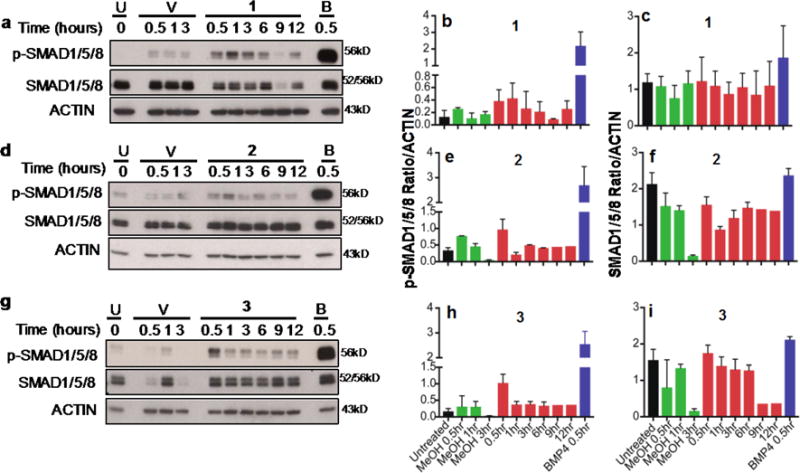
Immunoblotting analysis of C33A-2D2 cells untreated (U) or treated with: Vehicle (V, 0.034%–0.038% MeOH), 10ng BMP4 (B) or 1 (a), 2 (d), or 3 (g) for 0.5 to 12hrs as indicated. Proteins were separated on 10% or 12% PAGE gels and immunoblotted with antibodies to phosphorylated SMAD1/5/8 (p-SMAD1/5/8) or total SMAD1/5/8. ACTIN was used as loading control. Quantification of protein signal for p-SMAD1/5/8 (b,e,h) and SMAD1/5/8 (c,f,i) is indicated as the ratio of signal to actin expression ± standard deviation.
BMPs can also signal through SMAD-independent mechanisms, including the MAPK pathway.44 Immunoblotting analysis of lysates from C33A-2D2 treated with compounds revealed clear induction of the phosphorylated Extracellular Signal-regulated protein Kinase, ERK1/2 (P-ERK1/2) by compound 1 (Figure S6) but not by compounds 2 or 3 (data not shown). None of the compounds stimulated SMAD2 phosphorylation (Figure S7), which responds to other TGFβ family members. Our data demonstrate that in vitro, as in embryos, the three compounds activate selective BMP signaling responses.
Ventromorphins induce osteoblastic differentiation of myoblasts
C2C12 is a mouse myoblast cell line that differentiates into osteoblasts in response to treatment with BMP4.45–47 A hallmark of osteoblast induction by BMP is development of cellular “cobblestone” morphology. All three compounds could induce osteoblast differentiation of C2C12 cells (Figure 6), as measured by this morphologic marker, consistent with the idea that ventromorphins are capable of stimulating BMP4 signaling.
Figure 6. Differentiation of myoblastic C2C12 cells to osteoblasts.
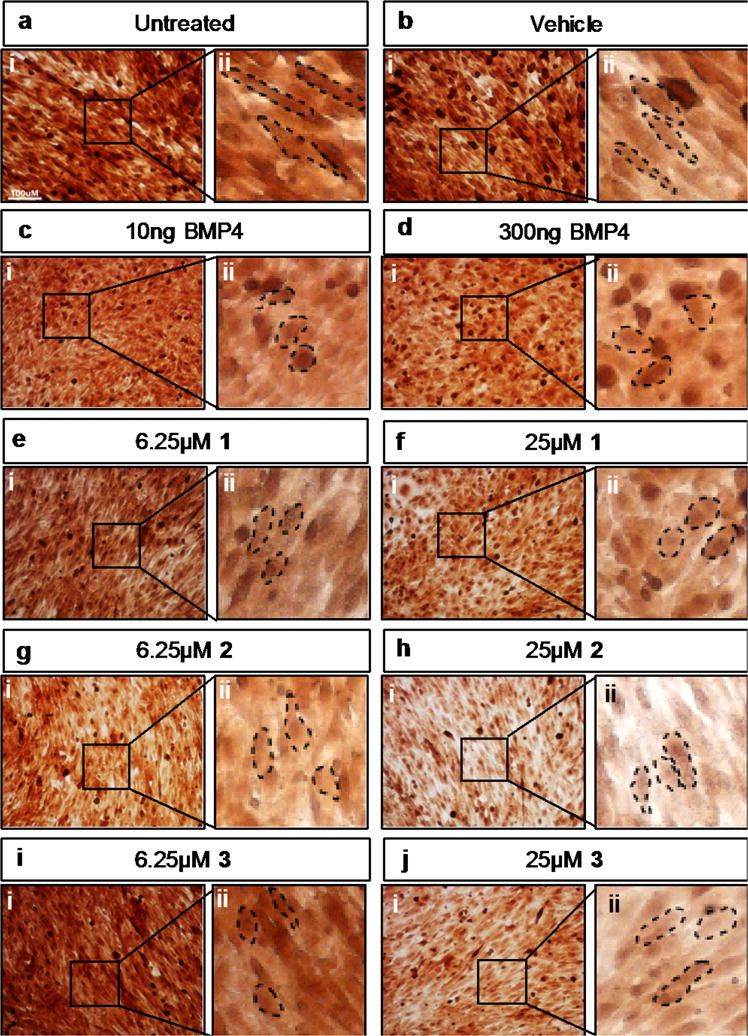
Mouse C2C12 myoblastic cells were untreated (a i,ii) or treated for 6 days with: vehicle (0.03% DMSO, b i,ii), 10ng BMP4 (c i,ii), 300ng (d i,ii) BMP4, 6.25μM 1 (e i,ii), 25μM 1 (f i,ii), 6.25μM 2 (g i,ii), 25μM 2 (h i,ii), 6.25μM 3 (i i,ii), or 25μM 3 (j i,ii). For each treatment one 20× magnification representative image (i) is displayed along with a zoomed in imaged (ii) displaying cell morphology. Scale bar for 100μM is represented in panel a. Dashed lines indicate the cells’ outline.
Differentiation of myoblasts to osteoblast by the three new compounds was confirmed by examining the changes in mRNA levels of mediators and targets of the differentiation pathway, as measured by Affymetrix gene expression array. All three compounds, and BMP4 controls, directed expression of a set of common genes (Figure 7a). As expected, the highest dose (100 and 300ng) BMP4 treatments generated a gene expression signature most similar to osteoblast expression. Low dose (10ng) BMP4 treatment aligned closely with 25μM 3 treatment and with 25μM 1 (although separated in the heat map, Figure 7a). GO analysis confirmed that genes induced by BMP4 and compound 1 corresponded to those found in osteoblasts (Figure 7b). In addition, regression analysis confirmed a correlation between BMP4 and compound 1 (Figure 7c, Figure S8) but not between BMP4 and compounds 2 or 3 (Figure S8). Expression of three targets: Alcohol dehydrogenase 7 (Adh7), Prostaglandin F receptor (Ptgfr), and Ankyrin repeat domain-containing protein 2 (Ankrd2) was confirmed by qRT-PCR. Both Adh7 and Ptgfr displayed a significant increase following BMP4 or 1 treatment compared to control (Figure 7d, e). Ankrd2 had decreased expression in cells treated with BMP4 or 1 as compared to controls, although BMP4 had a more potent effect (Figure 7f). Taken together, our data show that ventromorphins direct multiple BMP signaling responses.
Figure 7. Transcriptional profiling by Affymetrix assay.
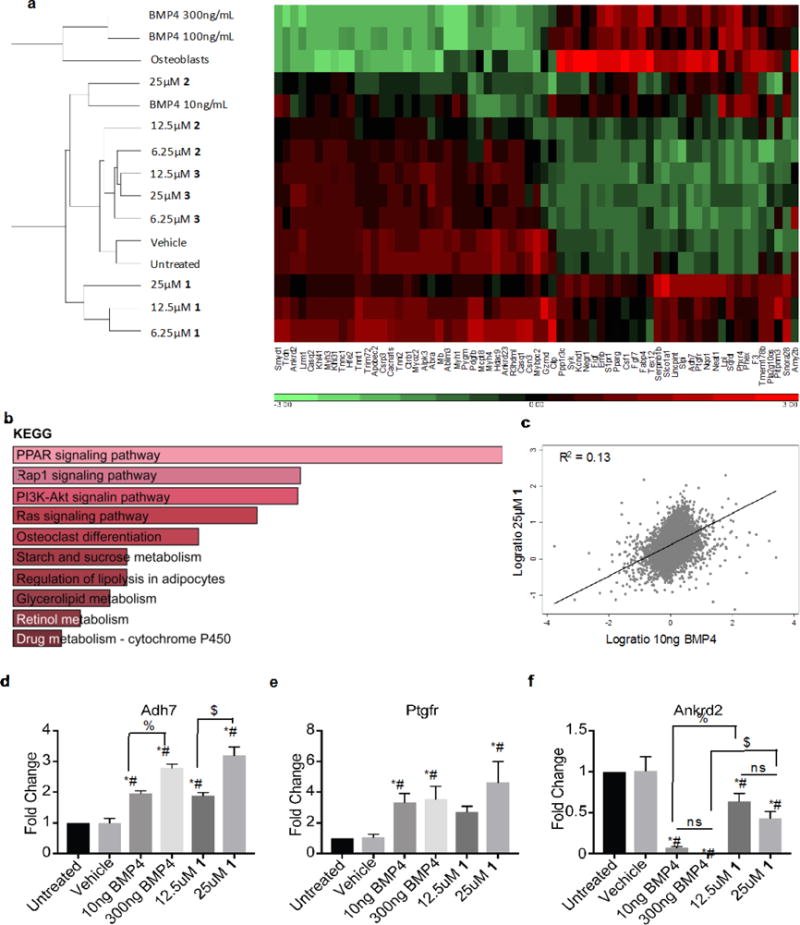
RNA expression from C2C12 myoblasts treated for 6 days with BMP4 10, 100, 300ng/ml, compounds at 6.25, 12.5, 25μg/ml, or vehicle. (a) Unsupervised heat map of genes positively or negatively correlated with BMP4 and compound 1. (b) GO analysis of 94 genes induced by at least 0.5 fold by both BMP4 and compound 1. (c) Scatter plot with regression analysis for 10ng BMP4 and 25μM compound 1. qRT-PCR for Adh7 (d), Ptgfr (e), and Ankrd2 (f) from C2C12 cells untreated, or treated with vehicle, 10ng, 300ng BMP4, 12.5μM, 25μM 1. *=significantly different than untreated (p≤0.0169). #=significantly different than vehicle (p≤0.0209). $=treatments significantly different (p≤0.05).
Conclusions
BMPs are metabologens currently used for the treatment of bone regeneration and kidney disorders. Unfortunately, BMPs are expensive to produce, bulky, and do not cross the blood-brain barrier. Their clinical use is also limited due to the supra-physiological doses required for therapeutic efficacy, which cause severe side effects.48 We believe that small molecule activators of the BMP signaling pathway identified in this manuscript would be a more cost-effective alternative and would also be potentially more deliverable to the brain than BMP molecules. Peptide and pharmacological antagonists of BMP signaling have been identified, including the naturally secreted BMP antagonist Noggin, and the small molecule Dorsomorphin that blocks SMAD1/5/8 phosphorylation. However, to our knowledge the three small molecules reported here represent the first in class small molecule activators of BMP4 signaling. As a follow up for these hit compounds, we will perform hit optimization and hit-to-lead process with more profound SAR study to improve potency through chemical modifications and target identification to understand their mechanism of action.
We previously found that BMPs can induce differentiation of GNPs and SHH medulloblastoma tumor cells suggesting that activators of BMP signaling could be used as differentiation therapy of SHH medulloblastoma.22 Improved potency of BMP activators might eventually lead to their use in tissue engineering efforts, including bone repair with less toxic effects than those described for BMP2 and BMP4. Their use could also be more cost-effective and potentially more easily deliverable. Finally, because these three small molecule agonists of the BMP can penetrate zebrafish embryos, they might be useful as chemical probes to interrogate BMP signaling.
Methods
Cell lines and tissue culture
The generation of the human cervical carcinoma C33A-2D2 subclone was previously described.22 Cells were maintained in Eagle’s medium essential medium (EMEM) supplemented with 10% fetal bovine serum (FBS), 2mM glutamine, 500units/ml penicillin and 500μg/ml streptomycin and grown at 37°C and 8% CO2. The mouse myoblast cell line C2C12 was grown in Dulbecco’s modified eagle medium (DMEM) supplemented with 5% FBS, 2mM glutamine, 500units/ml penicillin and 500μg/ml streptomycin and grown at 37°C and 8% CO2. To avoid depletion of the myoblastic population, C2C12 cells were not allowed to grow to confluence and were passaged at a density less than 70%.
Compound library selection and high throughput screening
The entire content of the St. Jude compound library (N = 643,432 unique) was screened in the primary high-throughput screening (HTS) using a human cervical carcinoma clonal reporter cell line, C33A-2D2, that provided a robust BMP4 response for the high throughput cell-based assay. Details of the method for the HTS were reported previously.22 Briefly cells were plated and compounds diluted in DMSO were added approximately 0.5hrs later. The assay plates were incubated overnight followed by luminescence assay for luciferase reporter activity with SteadyLite HTS reagent (PerkinElmer, Waltham, MA). The library was composed as follows: ~80% from commercial ‘diversity’ libraries designed to broadly sample from available scaffold space while abiding by drug-like/lead-like criteria;49 ~10% from in-house focused libraries which are based on scaffolds from major therapeutic target classes such as kinases, G-protein-coupled receptors (GPCRs), and proteases; ~5% natural product fractions from an in-house program;50 and the remaining ~5% from external collaborators and in-house lead optimization projects. CScore was determined as previously described.51
Fish Maintenance and compound administration
Wild-type zebrafish (WIK-Danio rerio) embryos were obtained and maintained in accordance with standard husbandry procedures52 and in compliance with IACUC guidelines. Embryos at approximately 2 hours post fertilization (hpf) were placed into a 6- or 12-well flat bottom dishes and treated with DMSO or compounds at a concentration of 0.1 μM to 50 μM, as indicated in the text. The treatments were as follows: 1) no treatment [E3 media (5mM NaCl, 0.17mM KCl, 0.33mM CaCl2, 0.33mM MgSO4], 2) vehicle (1% DMSO in E3), 3) 1, 4) 2, 5) 3, 6) 4. Embryos were treated until either shield stage (6hpf) or the onset of circulation (24hpf). For in situ hybridization, shield stage embryos were fixed in 4% paraformaldehyde for 24hrs. Circulation stage embryos were manually dechorionated and assessed for ventralization as previously described.53
Whole mount in situ hybridization and quantification
Probe synthesis and whole mount in situ hybridization was performed as described previously.54 The following probe constructs were used: pGenTeasa-bmp2b (bmp2b, gift of A. Lekven), pBS SK+ chordin (chd, gift of D. Kimelman), eve1 (eve1, gift of A. Lekven), pZL1-szl-BamHI (szl, gift of A. Lekven), pBS SK- vent (vent, gift of D. Kimelman), and pBS SK- vox (vox, gift of D. Kimelman). In situ hybridization signal was quantified using ImageJ (http://imagej.nih.gov/ij) by tracing the positive, correlating to mRNA expression of the indicated gene. Embryos of equivalent size were analyzed, permitting quantification of signal alterations as a general measure of altered transcript abundance, as previously.54
Immunoblotting
1.8×10⁶ C33A-2D2 cells were plated on 100mm plates, and grown for 24hrs in EMEM media supplemented with 10% FBS, 2mM glutamine, 500units/ml penicillin and 500μg/ml streptomycin at 37°C and 8% CO2. After 24hrs, the medium was changed to serum-free EMEM supplemented with 2mM glutamine, 500units/ml penicillin, and 500μg/ml streptomycin and grown overnight. The next day medium was replaced with fresh serum-free medium containing the compounds dissolved in methanol for 0.5, 1, 3, 6, 9, or 12hrs. Cells were also treated for 0.5hrs with 10ng/ml of human recombinant BMP4 (R&D Systems, Minneapolis, MN) for positive control. Methanol (MeOH) concentrations ranging from 0.034% to 0.038% for 0.5, 1, and 3hrs were used as negative control, respectively. After collection, cells were lysed (RIPA lysis buffer) and sonicated (VirSonic 475 dismembranator). Proteins were quantified using a bicinchoninic acid (BCA) protein assay reagent (Pierce, Rockford, IL) per manufacturer’s instructions. 20 g of protein lysate per sample were loaded on a 10% or 12% SDS-PAGE gel, as previously published.22 Antibodies used were rabbit polyclonal antibodies to human p-SMAD1/5/8 (homemade; 1:2500 dilution),22 SMAD1/5/8 (Santa Cruz sc-6031-R; 1:500 dilution), ID1 (Abcam #EPR7098; 1:1000 dilution), P-ERK1/2 (Cell Signaling #4370; 1:500 dilution), ERK1/2 (Cell Signaling #4696; 1:2000 dilution), p-SMAD2 (Cell Signaling #3108; 1:1000 dilution), SMAD2 (Cell Signaling #3122; 1:1000 dilution) and ACTIN (Santa Cruz sc-1615; 1:2000 dilution). Secondary antibodies were anti-rabbit IgG HRP (Cell Signaling #7074; 1:2000 dilution), anti-mouse IgG HRP (ECL/GE Healthcare NA931V, 1:2000 dilution), and anti-goat IgG HRP (Life Technologies A16005, 1:2000–1:3000 dilution).
Myoblast differentiation
Evaluation of myoblast differentiation activity was as previously described.22 Briefly, 2×10⁴ C2C12 cells were plated in 24-well plates and allowed to grow overnight at 37°C. The next morning medium was replaced with fresh medium containing 5% FBS and individual wells were treated with MeOH, 6.25 μM or 25 μM of each compound or recombinant BMP4 (10, 300ng/mL). Cells were treated for 6 days (with repeated dosing on days 4 and 6) and fixed with 3.7% formaldehyde, washed and counterstained with Neutral Red Solution (from Sigma-Aldrich, St. Louis, MO). 20× magnification images were taken on a Nikon TE 2000 E2 (20×, 0.5 Plan Fluor objective; DS-Fi1 camera).
Gene expression profiling and GO analysis
RNA expression profile of BMP4, compounds 1, 2, 3, or control treated C2C12 cells were assayed using MoGene-2_0-st-v1 Affymetrix microarrays (Mountain View, CA). Data was Robust Multi-array (RMA) summarized and quality controlled using Partek Genomics Suite 6.6 (St. Louis, MO). Gene expression responses to each drug were modelled by linear regression. Genes, which were concordantly positively or negatively correlated with drug dose for BMP4 and 1 at the 0.9 level or greater with a nominal regression p-value<.05, were visualized in an unsupervised heat map using Partek Genomics Suite 6.6. Arrays from wild type primary osteoblasts data from GEO (GSE57195) were downloaded, RMA summarized and normalized together with the other arrays to facilitate comparison in the heat map. For GO analysis in KEGG the logFC of max dose vs control was found for each drug and those 94 genes that were induced by at least 0.5 by both BMP4 and 1 were tested in Enrichr.55, 56 Scatterplots of log ratios were regressed and visualized using STATA/MP 14.2 (College Station, Texas).
Quantitative Real-Time PCR (qRT-PCR)
Total RNA was extracted from C2C12 cells (untreated, vehicle (0.036% MeOH), 10ng BMP4, 12.5μM, or 25μM of 1). RNA was extracted with TRIzol reagent (Ambion, Life Technologies). cDNAs were synthesized using High Capacity cDNA Reverse Transcription Kit (Applied Biosystems, Thermo Fisher Scientific #4374966), per the manufacturer’s instructions. QRT-PCR was performed using TaqMan Fast Advance Master Kit (Applied Biosystems, Thermo Fisher Scientific #4444557), according to the manufacturer’s procedures and performed in a QuantStudio3 machine (Applied Biosystems, Thermo Fisher Scientific). The context sequences of the primers used were listed as follows: mouse Adh7, 5′-TCGGGGAAAAGCATTCGGACTGTCC-3′ (Assay ID Mm00507750_m1); mouse Ptgfr, 5′-CTGGAGTCCCTTTCTGGTAACAATG-3′ (Assay ID Mm00436055_m1); mouse Ankrd2, 5′-GTGATGAGTTCCGTCGGACAGCACT-3′ (Assay ID Mm00508030_m1); mouse GAPDH, 5′-GGTGTGAACGGATTTGGCCGTATTG-3′ (Assay ID Mm99999915_g1). All the primers were FAM-Labeled TaqMan (Applied Biosystems, Thermo Fisher Scientific). Threshold cycle (CT) values from triplicate measurements were averaged and normalized to those obtained from an internal control gene, GAPDH. Relative gene expression was determined by the 2−ΔΔCT method.57 Data are expressed as the mean±SEM. Statistical analyses were performed in GraphPad Prism Software v.6.0. Statistical significance was determined by one way ANOVA with Tukey’s multiple comparison test (p≤0.05).
Supplementary Material
Acknowledgments
We thank Dr. Steven Finckbeiner for performing the initial zebrafish 97-compound screen, and for identification of the three compounds with similar scaffolds. We thank all members of the laboratory for helpful discussions. We are indebted to the SJCRH Cell Imaging Core, Compound Management (CM) Center for reformatting compound plates and High-Throughput Analytical Chemistry (HTAC) Center for the QC of library compounds screened, and the Hartwell Center for the Affymetrix Chip Assay. We thank Dr. Arne Lekven for the gifts of the bmb2b, eve1, szl probes and Dr. David Kimelman for the gifts of the chd, vent and vox probes.
Funding Sources. This work was funded in part by NCI grant CA096832 (MFR), Core Grant CA-02165 (MFR), James McDonnell Foundation-Brain Cancer Research Award (MFR), Cancer Center Seed Grant (MFR), AACR-Astellas USA Foundation Fellowship in Basic Cancer Research (KV), American Brain Tumor Association fellowship (ABTA, KV), and the American-Lebanese Syrian-Associated Charities of St. Jude Children’s Research Hospital.
Footnotes
Author Contributions. Conception, experimental design and direction of the work (MFR, RKG, WKC); writing of the manuscript (MFR, JRG, JM, WKC); high throughput screen (JM, AAS, WL, TC, KV); zebrafish experiments (JRG), immunoblotting (DMF, JAG); other cell-based experiments (JRG, DMF, JAG); analysis of the Affymetrix database (DF). All authors have read the manuscript.
Database access. The data discussed in this publication have been deposited in the NCBI’s Gene Expression Omnibus58 and are accessible through GEO Series accession number GSE95248 (https://www.ncbi.nlm.nih.gov/geo/query/acc.cgi?acc=GSE95248).
Conflict of interest Disclosure
The authors declare no competing interests.
References
- 1.Wozney JM, Rosen V, Celeste AJ, Mitsock LM, Whitters MJ, Kriz RW, Hewick RM, Wang EA. Novel regulators of bone formation: molecular clones and activities. Science. 1988;242:1528–1534. doi: 10.1126/science.3201241. [DOI] [PubMed] [Google Scholar]
- 2.von Bubnoff A, Cho KW. Intracellular BMP signaling regulation in vertebrates: pathway or network? Dev Biol. 2001;239:1–14. doi: 10.1006/dbio.2001.0388. [DOI] [PubMed] [Google Scholar]
- 3.Raftery LA, Sutherland DJ. TGF-beta family signal transduction in Drosophila development: from Mad to Smads. Dev Biol. 1999;210:251–268. doi: 10.1006/dbio.1999.9282. [DOI] [PubMed] [Google Scholar]
- 4.Wang RN, Green J, Wang Z, Deng Y, Qiao M, Peabody M, Zhang Q, Ye J, Yan Z, Denduluri S, Idowu O, Li M, Shen C, Hu A, Haydon RC, Kang R, Mok J, Lee MJ, Luu HL, Shi LL. Bone Morphogenetic Protein (BMP) signaling in development and human diseases. Genes Dis. 2014;1:87–105. doi: 10.1016/j.gendis.2014.07.005. [DOI] [PMC free article] [PubMed] [Google Scholar]
- 5.Morikawa M, Koinuma D, Mizutani A, Kawasaki N, Holmborn K, Sundqvist A, Tsutsumi S, Watabe T, Aburatani H, Heldin CH, Miyazono K. BMP Sustains Embryonic Stem Cell Self-Renewal through Distinct Functions of Different Kruppel-like Factors. Stem Cell Reports. 2016;6:64–73. doi: 10.1016/j.stemcr.2015.12.004. [DOI] [PMC free article] [PubMed] [Google Scholar]
- 6.Aubin J, Davy A, Soriano P. In vivo convergence of BMP and MAPK signaling pathways: impact of differential Smad1 phosphorylation on development and homeostasis. Genes Dev. 2004;18:1482–1494. doi: 10.1101/gad.1202604. [DOI] [PMC free article] [PubMed] [Google Scholar]
- 7.Koenig BB, Cook JS, Wolsing DH, Ting J, Tiesman JP, Correa PE, Olson CA, Pecquet AL, Ventura F, Grant RA, et al. Characterization and cloning of a receptor for BMP-2 and BMP-4 from NIH 3T3 cells. Mol Cell Biol. 1994;14:5961–5974. doi: 10.1128/mcb.14.9.5961. [DOI] [PMC free article] [PubMed] [Google Scholar]
- 8.ten Dijke P, Yamashita H, Sampath TK, Reddi AH, Estevez M, Riddle DL, Ichijo H, Heldin CH, Miyazono K. Identification of type I receptors for osteogenic protein-1 and bone morphogenetic protein-4. J Biol Chem. 1994;269:16985–16988. [PubMed] [Google Scholar]
- 9.Rosenzweig BL, Imamura T, Okadome T, Cox GN, Yamashita H, ten Dijke P, Heldin CH, Miyazono K. Cloning and characterization of a human type II receptor for bone morphogenetic proteins. Proc Natl Acad Sci U S A. 1995;92:7632–7636. doi: 10.1073/pnas.92.17.7632. [DOI] [PMC free article] [PubMed] [Google Scholar]
- 10.Moustakas A, Heldin CH. From mono- to oligo-Smads: the heart of the matter in TGF-beta signal transduction. Genes Dev. 2002;16:1867–1871. doi: 10.1101/gad.1016802. [DOI] [PubMed] [Google Scholar]
- 11.Chen Y, Bhushan A, Vale W. Smad8 mediates the signaling of the ALK-2 [corrected] receptor serine kinase. Proc Natl Acad Sci U S A. 1997;94:12938–12943. doi: 10.1073/pnas.94.24.12938. [DOI] [PMC free article] [PubMed] [Google Scholar]
- 12.Hoodless PA, Haerry T, Abdollah S, Stapleton M, O’Connor MB, Attisano L, Wrana JL. MADR1, a MAD-related protein that functions in BMP2 signaling pathways. Cell. 1996;85:489–500. doi: 10.1016/s0092-8674(00)81250-7. [DOI] [PubMed] [Google Scholar]
- 13.Peng Y, Kang Q, Luo Q, Jiang W, Si W, Liu BA, Luu HH, Park JK, Li X, Luo J, Montag AG, Haydon RC, He TC. Inhibitor of DNA binding/differentiation helix-loop-helix proteins mediate bone morphogenetic protein-induced osteoblast differentiation of mesenchymal stem cells. J Biol Chem. 2004;279:32941–32949. doi: 10.1074/jbc.M403344200. [DOI] [PubMed] [Google Scholar]
- 14.Pinho RS, Andreoni S, Silva NS, Cappellano AM, Masruha MR, Cavalheiro S, Vilanova LC. Pediatric central nervous system tumors: a single-center experience from 1989 to 2009. J Pediatr Hematol Oncol. 2011;33:605–609. doi: 10.1097/MPH.0b013e31822031d9. [DOI] [PubMed] [Google Scholar]
- 15.Thompson MC, Fuller C, Hogg TL, Dalton J, Finkelstein D, Lau CC, Chintagumpala M, Adesina A, Ashley DM, Kellie SJ, Taylor MD, Curran T, Gajjar A, Gilbertson RJ. Genomics identifies medulloblastoma subgroups that are enriched for specific genetic alterations. J Clin Oncol. 2006;24:1924–1931. doi: 10.1200/JCO.2005.04.4974. [DOI] [PubMed] [Google Scholar]
- 16.Kieran MW, Walker D, Frappaz D, Prados M. Brain tumors: from childhood through adolescence into adulthood. J Clin Oncol. 2010;28:4783–4789. doi: 10.1200/JCO.2010.28.3481. [DOI] [PubMed] [Google Scholar]
- 17.Ferretti E, De Smaele E, Po A, Di Marcotullio L, Tosi E, Espinola MS, Di Rocco C, Riccardi R, Giangaspero F, Farcomeni A, Nofroni I, Laneve P, Gioia U, Caffarelli E, Bozzoni I, Screpanti I, Gulino A. MicroRNA profiling in human medulloblastoma. Int J Cancer. 2009;124:568–577. doi: 10.1002/ijc.23948. [DOI] [PubMed] [Google Scholar]
- 18.Rios I, Alvarez-Rodriguez R, Marti E, Pons S. Bmp2 antagonizes sonic hedgehog-mediated proliferation of cerebellar granule neurones through Smad5 signalling. Development. 2004;131:3159–3168. doi: 10.1242/dev.01188. [DOI] [PubMed] [Google Scholar]
- 19.Zhao H, Ayrault O, Zindy F, Kim JH, Roussel MF. Post-transcriptional down-regulation of Atoh1/Math1 by bone morphogenic proteins suppresses medulloblastoma development. Gene Dev. 2008;22:722–727. doi: 10.1101/gad.1636408. [DOI] [PMC free article] [PubMed] [Google Scholar]
- 20.Lee KW, Yook JY, Son MY, Kim MJ, Koo DB, Han YM, Cho YS. Rapamycin promotes the osteoblastic differentiation of human embryonic stem cells by blocking the mTOR pathway and stimulating the BMP/Smad pathway. Stem Cells Dev. 2010;19:557–568. doi: 10.1089/scd.2009.0147. [DOI] [PubMed] [Google Scholar]
- 21.Spiekerkoetter E, Tian X, Cai J, Hopper RK, Sudheendra D, Li CG, El-Bizri N, Sawada H, Haghighat R, Chan R, Haghighat L, de Jesus Perez V, Wang L, Reddy S, Zhao M, Bernstein D, Solow-Cordero DE, Beachy PA, Wandless TJ, Ten Dijke P, Rabinovitch M. FK506 activates BMPR2, rescues endothelial dysfunction, and reverses pulmonary hypertension. J Clin Invest. 2013;123:3600–3613. doi: 10.1172/JCI65592. [DOI] [PMC free article] [PubMed] [Google Scholar]
- 22.Vrijens K, Lin W, Cui J, Farmer D, Low J, Pronier E, Zeng FY, Shelat AA, Guy K, Taylor MR, Chen T, Roussel MF. Identification of small molecule activators of BMP signaling. PLoS One. 2013;8:e59045. doi: 10.1371/journal.pone.0059045. [DOI] [PMC free article] [PubMed] [Google Scholar]
- 23.Baell JB, Holloway GA. New substructure filters for removal of pan assay interference compounds (PAINS) from screening libraries and for their exclusion in bioassays. J Med Chem. 2010;53:2719–2740. doi: 10.1021/jm901137j. [DOI] [PubMed] [Google Scholar]
- 24.Shelat AA, Guy RK. Scaffold composition and biological relevance of screening libraries. Nature Chemical Biology. 2007;3:442–446. doi: 10.1038/nchembio0807-442. [DOI] [PubMed] [Google Scholar]
- 25.Bemis GW, Murcko MA. The properties of known drugs. 1. Molecular frameworks. J Med Chem. 1996;39:2887–2893. doi: 10.1021/jm9602928. [DOI] [PubMed] [Google Scholar]
- 26.Yu PB, Hong CC, Sachidanandan C, Babitt JL, Deng DY, Hoyng SA, Lin HY, Bloch KD, Peterson RT. Dorsomorphin inhibits BMP signals required for embryogenesis and iron metabolism. Nat Chem Biol. 2008;4:33–41. doi: 10.1038/nchembio.2007.54. [DOI] [PMC free article] [PubMed] [Google Scholar]
- 27.Hao HX, Xie Y, Zhang Y, Charlat O, Oster E, Avello M, Lei H, Mickanin C, Liu D, Ruffner H, Mao X, Ma Q, Zamponi R, Bouwmeester T, Finan PM, Kirschner MW, Porter JA, Serluca FC, Cong F. ZNRF3 promotes Wnt receptor turnover in an R-spondin-sensitive manner. Nature. 2012;485:195–200. doi: 10.1038/nature11019. [DOI] [PubMed] [Google Scholar]
- 28.Kaufman CK, White RM, Zon L. Chemical genetic screening in the zebrafish embryo. Nat Protoc. 2009;4:1422–1432. doi: 10.1038/nprot.2009.144. [DOI] [PMC free article] [PubMed] [Google Scholar]
- 29.Fuentealba RA, Marasa J, Diamond MI, Piwnica-Worms D, Weihl CC. An aggregation sensing reporter identifies leflunomide and teriflunomide as polyglutamine aggregate inhibitors. Hum Mol Genet. 2012;21:664–680. doi: 10.1093/hmg/ddr500. [DOI] [PMC free article] [PubMed] [Google Scholar]
- 30.O’Donnell EF, Saili KS, Koch DC, Kopparapu PR, Farrer D, Bisson WH, Mathew LK, Sengupta S, Kerkvliet NI, Tanguay RL, Kolluri SK. The anti-inflammatory drug leflunomide is an agonist of the aryl hydrocarbon receptor. PLoS One. 2010;5 doi: 10.1371/journal.pone.0013128. [DOI] [PMC free article] [PubMed] [Google Scholar]
- 31.Cherry JJ, Osman EY, Evans MC, Choi S, Xing X, Cuny GD, Glicksman MA, Lorson CL, Androphy EJ. Enhancement of SMN protein levels in a mouse model of spinal muscular atrophy using novel drug-like compounds. EMBO Mol Med. 2013;5:1103–1118. doi: 10.1002/emmm.201202305. [DOI] [PMC free article] [PubMed] [Google Scholar]
- 32.White RM, Cech J, Ratanasirintrawoot S, Lin CY, Rahl PB, Burke CJ, Langdon E, Tomlinson ML, Mosher J, Kaufman C, Chen F, Long HK, Kramer M, Datta S, Neuberg D, Granter S, Young RA, Morrison S, Wheeler GN, Zon LI. DHODH modulates transcriptional elongation in the neural crest and melanoma. Nature. 2011;471:518–522. doi: 10.1038/nature09882. [DOI] [PMC free article] [PubMed] [Google Scholar]
- 33.Nguyen VH, Schmid B, Trout J, Connors SA, Ekker M, Mullins MC. Ventral and lateral regions of the zebrafish gastrula, including the neural crest progenitors, are established by a bmp2b/swirl pathway of genes. Dev Biol. 1998;199:93–110. doi: 10.1006/dbio.1998.8927. [DOI] [PubMed] [Google Scholar]
- 34.Hild M, Dick A, Rauch GJ, Meier A, Bouwmeester T, Haffter P, Hammerschmidt M. The smad5 mutation somitabun blocks Bmp2b signaling during early dorsoventral patterning of the zebrafish embryo. Development. 1999;126:2149–2159. doi: 10.1242/dev.126.10.2149. [DOI] [PubMed] [Google Scholar]
- 35.Goutel C, Kishimoto Y, Schulte-Merker S, Rosa F. The ventralizing activity of Radar, a maternally expressed bone morphogenetic protein, reveals complex bone morphogenetic protein interactions controlling dorso-ventral patterning in zebrafish. Mech Dev. 2000;99:15–27. doi: 10.1016/s0925-4773(00)00470-6. [DOI] [PubMed] [Google Scholar]
- 36.Langdon YG, Mullins MC. Maternal and zygotic control of zebrafish dorsoventral axial patterning. Annu Rev Genet. 2011;45:357–377. doi: 10.1146/annurev-genet-110410-132517. [DOI] [PubMed] [Google Scholar]
- 37.Gonzalez EM, Fekany-Lee K, Carmany-Rampey A, Erter C, Topczewski J, Wright CV, Solnica-Krezel L. Head and trunk in zebrafish arise via coinhibition of BMP signaling by bozozok and chordino. Genes Dev. 2000;14:3087–3092. doi: 10.1101/gad.852400. [DOI] [PMC free article] [PubMed] [Google Scholar]
- 38.Hammerschmidt M, Serbedzija GN, McMahon AP. Genetic analysis of dorsoventral pattern formation in the zebrafish: requirement of a BMP-like ventralizing activity and its dorsal repressor. Genes Dev. 1996;10:2452–2461. doi: 10.1101/gad.10.19.2452. [DOI] [PubMed] [Google Scholar]
- 39.Mullins MC, Hammerschmidt M, Kane DA, Odenthal J, Brand M, van Eeden FJ, Furutani-Seiki M, Granato M, Haffter P, Heisenberg CP, Jiang YJ, Kelsh RN, Nusslein-Volhard C. Genes establishing dorsoventral pattern formation in the zebrafish embryo: the ventral specifying genes. Development. 1996;123:81–93. doi: 10.1242/dev.123.1.81. [DOI] [PubMed] [Google Scholar]
- 40.Wei CY, Wang HP, Zhu ZY, Sun YH. Transcriptional factors smad1 and smad9 act redundantly to mediate zebrafish ventral specification downstream of smad5. J Biol Chem. 2014;289:6604–6618. doi: 10.1074/jbc.M114.549758. [DOI] [PMC free article] [PubMed] [Google Scholar]
- 41.Imai Y, Gates MA, Melby AE, Kimelman D, Schier AF, Talbot WS. The homeobox genes vox and vent are redundant repressors of dorsal fates in zebrafish. Development. 2001;128:2407–2420. doi: 10.1242/dev.128.12.2407. [DOI] [PubMed] [Google Scholar]
- 42.Melby AE, Beach C, Mullins M, Kimelman D. Patterning the early zebrafish by the opposing actions of bozozok and vox/vent. Dev Biol. 2000;224:275–285. doi: 10.1006/dbio.2000.9780. [DOI] [PubMed] [Google Scholar]
- 43.Ramel MC, Lekven AC. Repression of the vertebrate organizer by Wnt8 is mediated by Vent and Vox. Development. 2004;131:3991–4000. doi: 10.1242/dev.01277. [DOI] [PubMed] [Google Scholar]
- 44.Jeong J, Kang DI, Lee GT, Kim IY. Bone morphogenetic protein signaling: implications in urology. Korean J Urol. 2010;51:511–517. doi: 10.4111/kju.2010.51.8.511. [DOI] [PMC free article] [PubMed] [Google Scholar]
- 45.Yaffe D, Saxel O. Serial passaging and differentiation of myogenic cells isolated from dystrophic mouse muscle. Nature. 1977;270:725–727. doi: 10.1038/270725a0. [DOI] [PubMed] [Google Scholar]
- 46.Blau HM, Pavlath GK, Hardeman EC, Chiu CP, Silberstein L, Webster SG, Miller SC, Webster C. Plasticity of the differentiated state. Science. 1985;230:758–766. doi: 10.1126/science.2414846. [DOI] [PubMed] [Google Scholar]
- 47.Li G, Peng H, Corsi K, Usas A, Olshanski A, Huard J. Differential effect of BMP4 on NIH/3T3 and C2C12 cells: implications for endochondral bone formation. J Bone Miner Res. 2005;20:1611–1623. doi: 10.1359/JBMR.050513. [DOI] [PubMed] [Google Scholar]
- 48.Gottfried ON, Dailey AT. Mesenchymal stem cell and gene therapies for spinal fusion. Neurosurgery. 2008;63:380–391. doi: 10.1227/01.NEU.0000324990.04818.13. discussion 391–382. [DOI] [PubMed] [Google Scholar]
- 49.Lipinski CA. Lead- and drug-like compounds: the rule-of-five revolution. Drug discovery today Technologies. 2004;1:337–341. doi: 10.1016/j.ddtec.2004.11.007. [DOI] [PubMed] [Google Scholar]
- 50.Yang J, Liang Q, Wang M, Jeffries C, Smithson D, Tu Y, Boulos N, Jacob MR, Shelat AA, Wu YS, Ravu RR, Gilbertson R, Avery MA, Khan IA, Walker LA, Guy RK, Li XC. UPLC-MS-ELSD-PDA as a Powerful Dereplication Tool to Facilitate Compound Identification from Small-Molecule Natural Product Libraries. J Nat Prod. 2014;77:902–909. doi: 10.1021/np4009706. [DOI] [PMC free article] [PubMed] [Google Scholar]
- 51.Ouyang X, Handoko SD, Kwoh CK. CScore: a simple yet effective scoring function for protein-ligand binding affinity prediction using modified CMAC learning architecture. J Bioinform Comput Biol. 2011;9(Suppl 1):1–14. doi: 10.1142/s021972001100577x. [DOI] [PubMed] [Google Scholar]
- 52.Westerfield M. The Zebrafish Book: A guide for the laboratory use of zebrafish (Danio rerio) University of Oregon Press; Eugene, OR: 2007. [Google Scholar]
- 53.Kishimoto Y, Lee KH, Zon L, Hammerschmidt M, Schulte-Merker S. The molecular nature of zebrafish swirl: BMP2 function is essential during early dorsoventral patterning. Development. 1997;124:4457–4466. doi: 10.1242/dev.124.22.4457. [DOI] [PubMed] [Google Scholar]
- 54.Clements WK, Ong KG, Traver D. Zebrafish wnt3 is expressed in developing neural tissue. Dev Dyn. 2009;238:1788–1795. doi: 10.1002/dvdy.21977. [DOI] [PMC free article] [PubMed] [Google Scholar]
- 55.Chen EY, Tan CM, Kou Y, Duan Q, Wang Z, Meirelles GV, Clark NR, Ma’ayan A. Enrichr: interactive and collaborative HTML5 gene list enrichment analysis tool. BMC Bioinformatics. 2013;14:128. doi: 10.1186/1471-2105-14-128. [DOI] [PMC free article] [PubMed] [Google Scholar]
- 56.Kuleshov MV, Jones MR, Rouillard AD, Fernandez NF, Duan Q, Wang Z, Koplev S, Jenkins SL, Jagodnik KM, Lachmann A, McDermott MG, Monteiro CD, Gundersen GW, Ma’ayan A. Enrichr: a comprehensive gene set enrichment analysis web server 2016 update. Nucleic Acids Res. 2016;44:W90–97. doi: 10.1093/nar/gkw377. [DOI] [PMC free article] [PubMed] [Google Scholar]
- 57.Livak KJ, Schmittgen TD. Analysis of relative gene expression data using real-time quantitative PCR and the 2(-Delta Delta C(T)) Method. Methods. 2001;25:402–408. doi: 10.1006/meth.2001.1262. [DOI] [PubMed] [Google Scholar]
- 58.Edgar R, Domrachev M, Lash AE. Gene Expression Omnibus: NCBI gene expression and hybridization array data repository. Nucleic Acids Res. 2002;30:207–210. doi: 10.1093/nar/30.1.207. [DOI] [PMC free article] [PubMed] [Google Scholar]
Associated Data
This section collects any data citations, data availability statements, or supplementary materials included in this article.


