Significance
The failure in achieving a durable clinical immune response against cancer cells depends on the ability of cancer cells to establish a microenvironment that prevent cytotoxic immune cells to infiltrate tumors and kill cancer cells. Therefore, the key approach to achieving successful antitumor immune response is to harness strategies allowing the reorientation of immune cells to the tumor. Herein we reveal that inhibiting autophagy induces a massive infiltration of natural killer immune cells into the tumor bed, and a subsequent dramatic decrease in the tumor volume of melanomas. These results highlight the role of targeting autophagy in breaking the immunosuppressive tumor microenvironment barrier, thus allowing the infiltration of natural killer cells into the tumor to kill cancer cells.
Keywords: autophagy, melanoma, natural killer, CCL5, immunotherapy
Abstract
While blocking tumor growth by targeting autophagy is well established, its role on the infiltration of natural killer (NK) cells into tumors remains unknown. Here, we investigate the impact of targeting autophagy gene Beclin1 (BECN1) on the infiltration of NK cells into melanomas. We show that, in addition to inhibiting tumor growth, targeting BECN1 increased the infiltration of functional NK cells into melanoma tumors. We provide evidence that driving NK cells to the tumor bed relied on the ability of autophagy-defective tumors to transcriptionally overexpress the chemokine gene CCL5. Such infiltration and tumor regression were abrogated by silencing CCL5 in BECN1-defective tumors. Mechanistically, we show that the up-regulated expression of CCL5 occurred through the activation of its transcription factor c-Jun by a mechanism involving the impairment of phosphatase PP2A catalytic activity and the subsequent activation of JNK. Similar to BECN1, targeting other autophagy genes, such as ATG5, p62/SQSTM1, or inhibiting autophagy pharmacologically by chloroquine, also induced the expression of CCL5 in melanoma cells. Clinically, a positive correlation between CCL5 and NK cell marker NKp46 expression was found in melanoma patients, and a high expression level of CCL5 was correlated with a significant improvement of melanoma patients’ survival. We believe that this study highlights the impact of targeting autophagy on the tumor infiltration by NK cells and its benefit as a novel therapeutic approach to improve NK-based immunotherapy.
Natural killer (NK) cells are known to be a critical part of the immune system involved in tumor control. In human and animal models, NK cell deficiency leads to increased incidence of different types of tumors (1). While the role of NK cells in tumor immune surveillance is well established and experimentally supported (2), the use of NK cells is far from being successfully and fully used in the clinic, although efforts are now being undertaken to exploit their antitumor properties (3). This might be in part related to the lack of crucial knowledge about NK cell-homing capacities (4, 5) and their poor infiltration into solid tumors (6). Indeed, the long-lasting observations showing that NK cells are infrequently detected in tumor biopsies suggest that intratumoral NK cells can be associated with increased survival of cancer patients (7). Therefore, strategies aiming at increasing the infiltration of NK cells into tumors would be of great interest to improve NK-based tumor immunotherapies (8). Consequently, a deeper understanding of the mechanisms regulating NK cell infiltration will allow us to take full advantage of the tremendous antitumor capacities of NK cells and rapidly bring them to the clinical use.
In this regard, it should be emphasized that the infiltration of functional cytotoxic immune cells, including NK and cytotoxic T lymphocytes (CTLs), will likely become a major factor in achieving successful immunotherapies, notably those based on the use of immune checkpoint inhibitors. Accumulating new evidence highlights that, similar to CTLs, activated NK cells can express, under some circumstances, the immune checkpoint programmed cell death protein 1- (PD-1) (9–11) and CTL-associated antigen 4 (CTLA4) (12). Thus, it stands to reason that improving the infiltration of cytotoxic immune cells, including NKs, into the tumor bed could enhance the therapeutic benefit of NK cell-based immunotherapy and provide novel therapeutic targets that could complement the expanding armamentarium of cancer immunotherapies.
Chemokines are chemotactic cytokines playing a major role in the infiltration of immune cells into the tumor bed, and are therefore supposed to play a tumor-suppressive role (13). However, depending on the balance between several tumor-promoting and tumor-inhibiting factors, some cytokines may play a dual role in tumor promotion or tumor suppression. For example, several cytokines expressed by melanomas are involved in tumor growth and progression, including CXCL1, CXCL2, CXCL3, CXCL8, CCL2, and CCL5 (14). In contrast, it has been shown that chemotherapy can also induce the expression of cytokines, including CCL5, involved in the trafficking of T cells into the tumor bed (15). Therefore, a positive correlation between the expression of some cytokines and the clinical outcome has been proposed (16). It is now well defined that the dual role played by some cytokines as tumor-promoting or tumor-suppressing depends on the balance between tumor-promoting and tumor-inhibiting factors. Therefore, understanding the complex role of chemokines in tumor biology and the context by which they play such a dual role will contribute to the improvement of the efficacy of cancer immunotherapeutic strategies and the induction of long-lasting host antitumor immunity.
Using syngeneic melanoma and breast mouse models, we have previously reported that targeting the autophagy gene Beclin1 (BECN1) significantly inhibited tumor growth by improving NK-mediated antitumor immune response (17). Briefly, autophagy is a lysosomal degradation pathway executed at the basal level that allows cells to self-digest their own components and rid themselves of damaged organelles and misfolded proteins in well-defined structures, named autophagosomes. Such a degradation process provides nutrients to maintain cellular functions under environmental stresses, thus allowing survival of cancer cells under stress conditions (18, 19). Autophagy involves a BECN1/class III phosphoinositide-3-kinase (PI3K) complex to initiate the formation of an isolation membrane, called the phagophore (20). ATG5, another autophagy-related protein, plays a role in the elongation of the phagophore and in its subsequent maturation into the complete autophagosome (21). Consistent with the degradation property of autophagy, we have demonstrated that targeting BECN1 prevented the degradation of NK-derived GranzymeB (GzmB) in hypoxic melanoma cells, and therefore restored their susceptibility to NK cell-mediated killing (17). A growing body of evidence suggests that autophagy could operate in tumor cells as an immunosuppressive and cell-resistance mechanism, because autophagy blockade not only sensitizes tumor to chemotherapy (22) but also improves the antitumor immune response (23, 24).
In this study, we investigated the impact of targeting autophagy on the infiltration of NK cells into the tumor bed. We show that targeting BECN1 in melanoma tumor induced a massive infiltration of functional NK cells into the tumor by a mechanism involving the secretion of high levels of CCL5, since the infiltration was no longer observed after silencing CCL5. In autophagy-defective tumor cells, we provide evidence that the induction of CCL5 is transcriptionally related to the increase in the phosphorylation of c-Jun at Ser-63 and -73. We also provide clinical evidence supporting our data by showing a positive correlation between the expression of CCL5 and the NK cell marker NKp46 in melanoma patients. In addition, high expression of CCL5 was correlated with an overall improved survival of melanoma patients.
Results
Targeting Autophagy Related Gene BECN1 Improves the Recruitment of Functional NK Cells into the Tumor Bed.
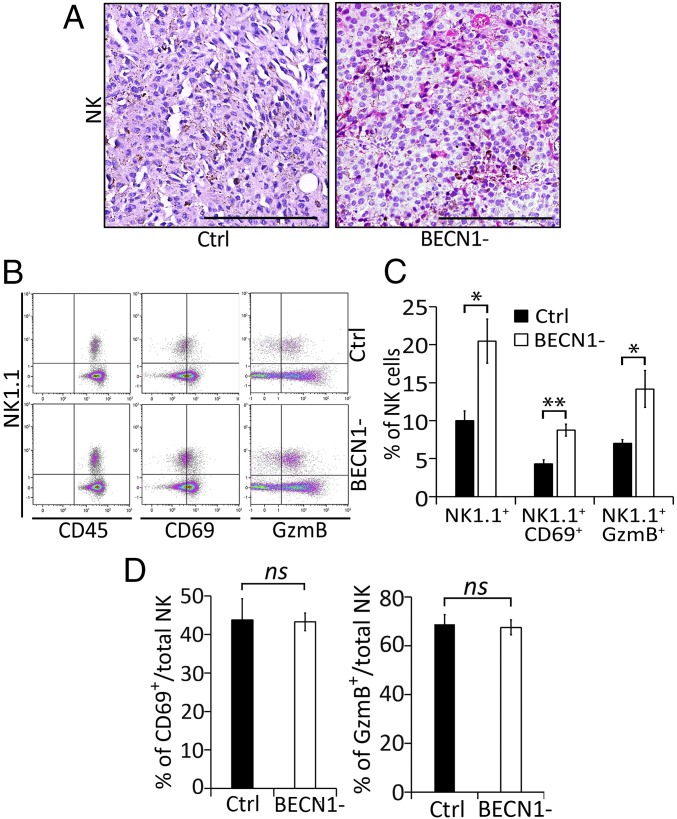
We have previously reported that targeting BECN1 significantly reduces the growth of B16-F10 mouse tumors. This effect is primarily related to the improvement of NK-mediated tumor cell killing, as such reduction was no longer observed in NK cell-depleted mice (17). Although NK cells seem to play a major role in the control of B16-F10 tumor growth, it should be emphasized that the reduced BECN1-defective (BECN1−) B16-F10 tumor volume was also rescued, but to a lesser extent, by the depletion of CD8 T cells. In this study, we investigated whether targeting BECN1 inhibits the tumor growth by improving the infiltration of NK cells into the tumor bed. Immunohistochemistry staining of tumor sections revealed a massive infiltration of NK cells into BECN1− compared with control (Ctrl) tumors (Fig. 1A).
Fig. 1.
BECN1− B16-F10 tumors contain higher numbers of active NK cells compared with Ctrl tumors. (A) Immunohistochemical staining of NK cells performed on control (Ctrl) or BECN1− B16-F10 tumor sections using anti–Asialo-GM1. (Scale bar, 200 µm.) (B) Tumor-infiltrating NK cells were stained with NK1.1, CD69-, and GzmB-specific antibodies. Total NK cells (CD45+NK1.1+) were gated and the percentage of active NK cells (NK1.1+CD69+ and NK1.1+GzmB+) was determined by multicolor flow cytometry. Images represent flow cytometric plots of CD45+NK1.1+, NK1.1+CD69+, and NK1.1+GzmB+ cells infiltrating Ctrl and BECN1− B16-F10 tumors. (C) Quantification of total NK1.1+ and active (NK1.1+CD69+ and NK1.1+GzmB+) NK cells infiltrating Ctrl and BECN1- B16-F10 tumors, reported as a percentage (%). (D) Quantification of CD69+/NK1.1+ (Left) and GzmB+/NK1.1+ (Right) cells infiltrating control Ctrl and BECN1− B16-F10 tumors, reported as a percentage (%). Results are the average ± SEM of three mice from each group. *P < 0.05; **P < 0.01; ns, not significant (two-tailed Student’s t test).
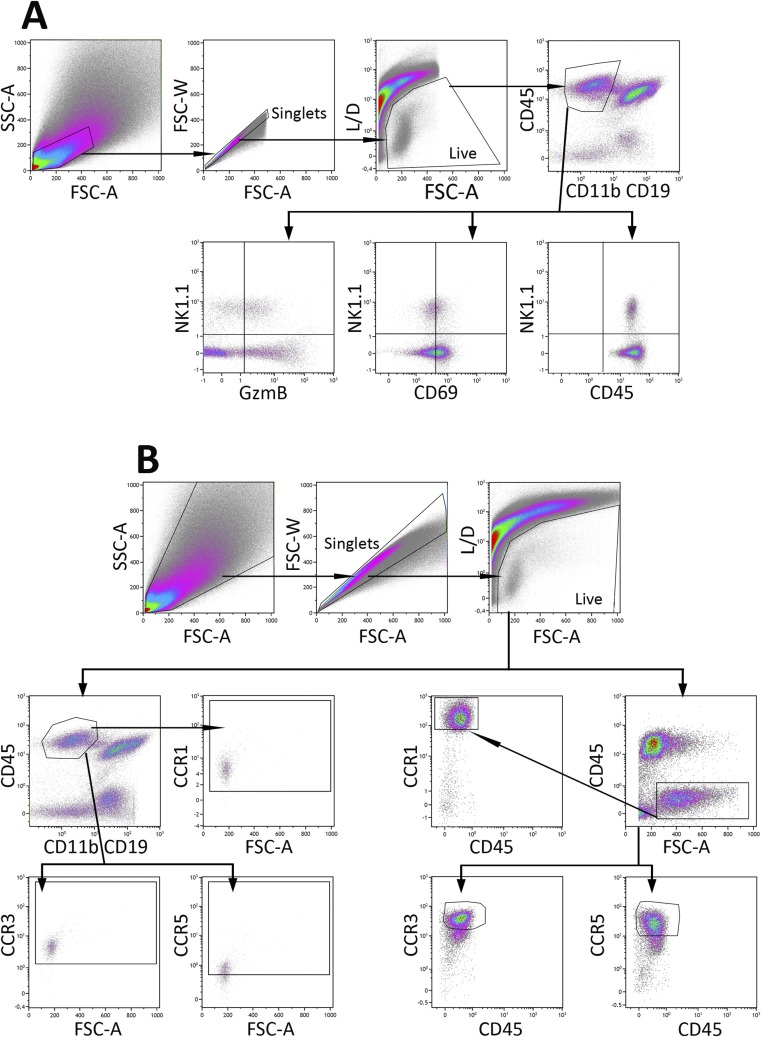
Since NK cell-infiltrating tumors could be functionally impaired/exhausted (25), we then assessed the functional properties of the NK cells that infiltrated BECN1− tumors. Flow cytometry analysis, performed based on the gating strategy described in Fig. S1, on Ctrl and BECN1− B16-F10 tumors confirmed our results obtained by immunohistochemistry result and revealed an almost twofold increase in the number of NK cell-infiltrating BECN1− tumors compared with Ctrl (Fig. 1 B and C). Furthermore, our data show that infiltrated NK cells were CD69+ and GzmB+, indicating that they were fully functional in the BECN1− tumor bed (Fig. 1 B and C). Interestingly, when reported to the total number of NK cells, no difference in the activation status of NK cells infiltrating both Ctrl and BECN1− tumors was found (Fig. 1D). This result shows that targeting BECN1 increases the number of infiltrated NK cells without affecting their activation properties. Together, our data highlight that targeting BECN1 presumably inhibits the growth of B16-F10 tumors at least in part by improving the homing of functional NK cells into the tumor bed.
Fig. S1.
Gating strategy and flow cytometric analysis. (A) Data represent dot plots demonstrating the gating and analytical processes for NK1.1, CD69, and GzmB staining of CD45+CD11b−CD19− cells from B16-F10 tumors. Cell suspensions harvested from tumors were stained with BV421–anti-NK1.1, Al700–anti-CD19, APC-R700–anti-CD11b, BUV395–anti-CD45, BV605–anti-CD69, Pacific blue anti-GzmB, and near IR-live/dead. Cells were first gated for forward scatter-A (FSC-A) vs. side scatter-A (SSC-A), and then for cell singlets forward scatter-A (FSC-A) vs. forward scatter-W (FSC-W). Live cells were gated and the gate encompassing CD45+CD11b−CD19− cells were analyzed for the expression of NK1.1, GzmB, and CD69. The quadrants were defined based on the cells stained with fluorescence-minus-one (FMO) and then applied to the plots of cells stained with positive antibodies, as shown in Fig. 1A. (B) Data represent dot plots demonstrating the gating and analytical processes for CCR1, CCR3, and CCR5 staining of NK1.1+ and tumor (CD45−) cells gated as described in A. The gates encompassing for NK1.1+ and CD45− cells were analyzed for their expression of CCR1, CCR3, and CCR5. The quadrants were defined based on the cells stained with FMO and then applied to the plots of cells stained with positive antibodies, as shown in Figs. S3 and S4.
Targeting Autophagy Induces the Expression of CCL5, Which Is Involved in the Migration of NK Cells.
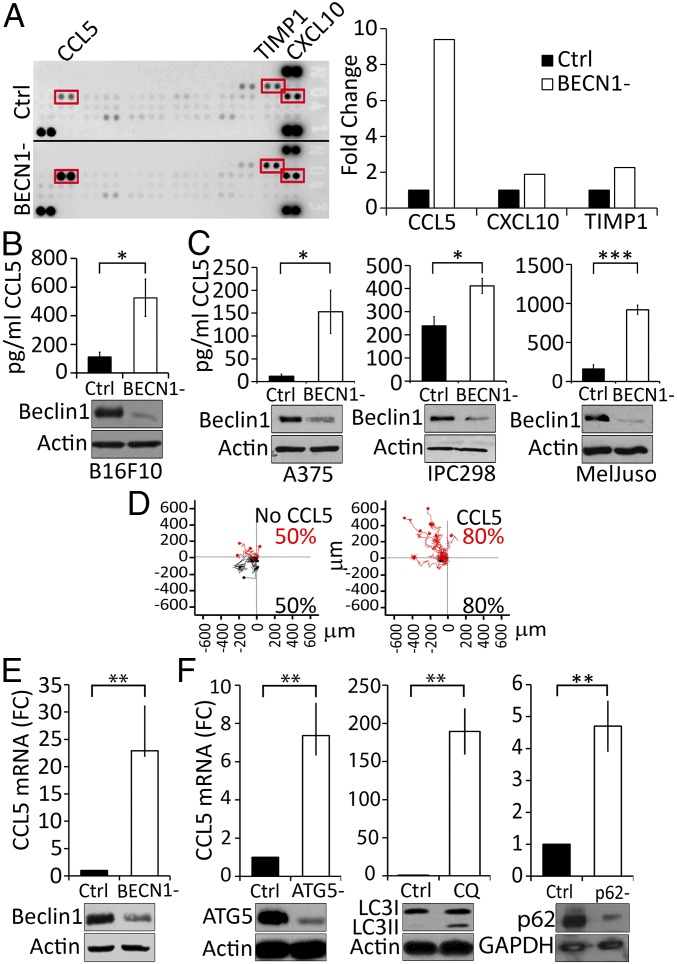
It is well established that tumors displaying high number of cytotoxic immune cells secrete high amounts of attracting chemokines (26, 27). Consequently, we evaluated whether the improvement of the infiltration of NK cells into BECN1− B16-F10 tumors is related to the regulation of some chemokines involved in the migration of NK cells. A cytokine profiling assay, performed using the conditioned medium of tumor cells, revealed that targeting BECN1 increased the secretion of several chemokines, including CCL5, CXCL10, and TIMP1 (Fig. 2A, Left). The quantification of the results obtained by cytokine arrays revealed that CCL5 was the predominant up-regulated cytokine in BECN1− tumor cells compared with CXCL10 or TIMP1 (Fig. 2A, Right). Based on these data, we focused our interest on CCL5 and quantified its level in the conditioned media of Ctrl and BECN1− B16-F10 tumor cells by ELISA. Fig. 2B shows that BECN1− cells secreted 4.5-fold more CCL5 compared with Ctrl cells (525 and 112 pg/mL for BECN1− and Ctrl, respectively).
Fig. 2.
BECN1− melanoma cells secrete high level of CCL5. (A, Left) Identification of cytokines in the supernatants of Ctrl (up) and BECN1− (down) B16-F10 cells using a Mouse Cytokine Array. Highly expressed cytokines (CCL5, TIMP1, and CXCL10) regulated in BECN1− cells are highlighted in red. (Right) Quantification of CCL5, TIMP1, and CXCL10 spots of the Left panel reported as fold-change compared with the Ctrl. (B) Quantification of CCL5 in the supernatant of Ctrl and BECN1− B16-F10 cells by ELISA. Results are the average ± SEM of three independent experiments. *P < 0.05 (two-tailed Student’s t test). (C) Expression of CCL5 in A375, IPC298, and MelJuso human melanoma cell lines. (Upper) Quantification of CCL5 secretion by ELISA in the supernatants of the indicated human melanoma cells transfected with either control (Ctrl) or BECN1 siRNA (BECN1−). Data represent the average ± SEM of four (Left and Right) or three (Center) independent experiments. *P < 0.05; ***P < 0.001 (two-tailed Student’s t test). (Lower) Expression of Beclin1 protein was assessed by Western blot. Actin was used as loading control. (D) Migration of NK92MI cell line toward recombinant CCL5 gradient. Migration of NK cells toward serum-free medium in the absence (Left) or presence of 20 ng/mL of recombinant CCL5 (Right). Red and black points represent NK cells migrating to the top and bottom compartments, respectively. The percentage of migrating NK cells are reported in the bottom of each panel. (E) Expression of CCL5 mRNA in BECN1− B16-F10 cells (Upper). The expression of Beclin1 protein was assessed by Western blot. Actin was used as loading control. **P < 0.01 (two-tailed Student's t test). (F) Expression of CCL5 in B16-F10 cells transfected with ATG5 siRNA (ATG5-) and in cells treated with chloroquine (CQ) or transfected with p62/SQSTM1 siRNA (p62-) (Upper). The expression of ATG5, LC3-I and -II, as well as p62/SQSTM1 proteins was assessed by Western blot. Actin and GAPDH were used as loading controls. Results are reported as a fold-change (FC) compared with Ctrl. Data represent the average ± SEM of three independent experiments. **P < 0.01 (two-tailed Student’s t test).
The impact of targeting BECN1 on the expression of CCL5 was further assessed in human melanoma cell lines displaying low levels of CCL5. Indeed, according the expression value (log2) of CCL5 in 62 human melanoma cell lines reported by the Cancer Cell Line Encyclopedia (https://software.broadinstitute.org/morpheus/), we selected three human melanoma cell lines—A375, IPC298, and MelJuso—displaying a relatively low expression level of CCL5 mRNA (Fig. S2). Fig. 2C shows that, similarly to B16-F10 cells, targeting BECN1 in A375, IPC298, and MelJuso human melanoma cell lines induced a significant increase in the secretion of CCL5, indicating that the up-regulation of CCL5 resulting from targeting BECN1 is not restricted to B16-F10 but can also be observed in other human melanoma cell lines.
Fig. S2.
Relative expression level of CCL5 in melanoma cell lines. Relative expression level of mRNA (log) in 162 skin cancer cell lines reported according to the Cancer Cell Line Encyclopedia (CCLE; https://software.broadinstitute.org/morpheus/). Black arrowheads indicate melanoma cell line used.
To further determine the involvement of CCL5 in the migration of NK cells, we tracked the migration of human NK cells toward a CCL5 gradient, using ibidi slides and a cell IQ platform. Fig. 2D shows that, in the absence of CCL5, NK cells migrate randomly (50% of cells to the upper and 50% to the lower compartments) in short-distance migration trajectories. Interestingly, the presence of a CCL5 gradient in the upper compartment induced directional long-distance migration of 80% of the NK cells toward that compartment. These results strongly suggest that CCL5 is a key determinant for the migration of NK cells.
A growing body of evidence has revealed that, in addition to its role in autophagy, BECN1 has several nonautophagic functions (28). We therefore investigated whether targeting other autophagy genes could also induce CCL5. We first determined whether CCL5 is regulated at mRNA level. Our results (Fig. 2E) show that, in BECN1− tumor cells, CCL5 is up-regulated at the transcription level as a significant increase in the mRNA of CCL5 was observed in BECN1− B16-F10 cells. Next, to determine to what extent the autophagy process is involved in the regulation of CCL5, we evaluated the impact of targeting other autophagy genes on the expression of CCL5. We show that, similarly to BECN1, targeting ATG5 or p62/SQSTM1 or treating cells with chloroquine, an autophagy inhibitor (Fig. 2F), resulted in a significant increase in the expression of CCL5 mRNA in B16-F10 melanoma cells. Taken together, these data provide clear evidence that—not only BECN1 but also the autophagy process—are involved in the regulation of CCL5.
Targeting BECN1 Induces the Expression of CCL5 Transcription Factor c-Jun.
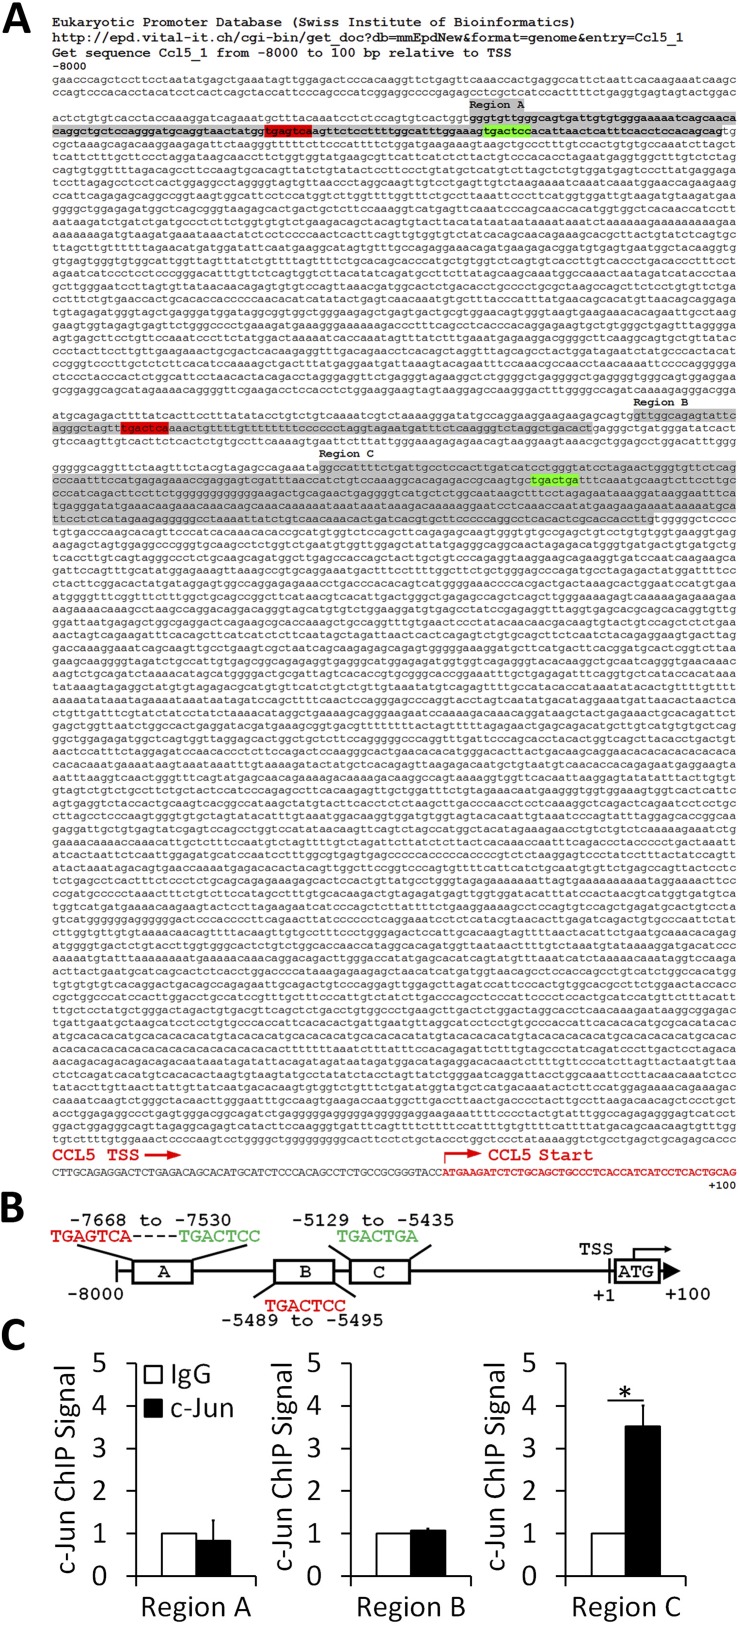
To gain more insight into the molecular mechanisms involved in the up-regulation of CCL5 mRNA in BECN1− B16-F10 cells, we focused our interest on the major transcription factor involved in the regulation of the CCL5 transcript. Indeed, the promoter region of mouse and human CCL5 contains several binding sites for well-defined transcription factors (29), including AP-1. We first assessed whether c-Jun binds to the CCL5 promoter in B16-F10 cells. We performed in silico identification of consensus (5′-TGA[C/G]TCA-3′) (30) and nonconsensus (5′-TGACTgA-3′ or 5′-TGACTCc-3′) (31) motifs for the Jun/Fos AP-1 binding site on the mouse CCL5 promoter. The promoter containing fragment has been defined using the Eukaryotic Promoter Database (Swiss Institute of Bioinformatics) from −8,000 to +100 bp relative to the transcription start site (TSS) of the mouse CCL5 gene (RefSeq NM_013653.3). Fuzznuc EMBOSS searches for patterns in nucleotide sequences software identified two consensus and two nonconsensus AP-1 binding sites, highlighted in red and green, respectively, on the sequence (shown in Fig. S3A). The positions of the consensus motifs were −7,668 and −5,489 and those of the nonconsensus motifs were −7,636 and −5,129 (Fig. S3B). ChIP was performed on CCL5-overexpressing BECN1− B16-F10 cells using anti–c-Jun ChIP grade antibody. Our results, depicted in Fig. S3C, show that c-Jun strongly binds to the nonconsensus 5′-TGACTgA-3′ motif containing region C of the CCL5 promoter, indicating that CCL5 is a direct c-Jun target gene in BECN1− B16-F10 cells.
Fig. S3.
c-Jun binds directly to the AP-1 nonconsensus motif in the CCL5 promoter. (A) The sequence from −8,000 to +100 bp relative to TSS containing CCL5 promoter defined by the Eukaryotic Promoter Database (Swiss Institute of Bioinformatics). Consensus and nonconsensus AP-1 binding motifs are highlighted in red and green, respectively. Sequences flanking AP-1 motifs (regions A, B, and C) are highlighted in gray. The TSS and ATG positions are indicated. (B) Schematic representation of AP-1 binding motifs in CCL5 promoter containing region. The position of each motif is reported. (C) ChIP was performed on BECN1− B16-F10 cells using control isotype (IgG) or anti–c-Jun antibody followed by SYBR Green reverse-transcriptase qPCR using appropriate primers for regions A, B, and C. Reverse-transcription qPCR signals were normalized to the control. Statistically significant differences (indicated by asterisks) between control and c-Jun conditions are shown (*P < 0.05). Two separate experiments (in triplicates) with the same results were performed. Error bars indicate SD.
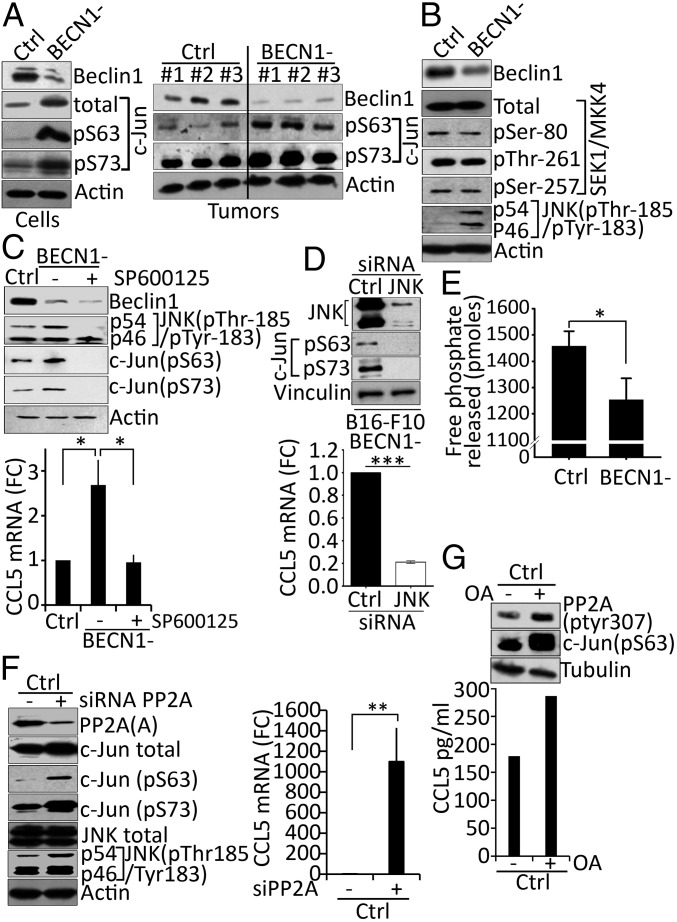
We next investigated the expression and the activation of c-Jun, the AP-1 founding member (32). It is known that c-Jun is transactivated by phosphorylation at the N terminal Ser-63 and Ser-73 residues (33, 34). Our results showed that the total and the phosphorylated level of c-Jun at both Ser-63 and Ser-73 residues were higher in BECN1− compared with control B16-F10 cells (Fig. 3A, Left). An increase in the phosphorylation of c-Jun was also observed in BECN1− tumor extracts (Fig. 3A, Right).
Fig. 3.
Targeting autophagy induces the up-regulation of CCL5 mRNA by increasing the phosphorylation of c-Jun. (A, Left) Expression of Beclin1, total c-Jun, phosphorylated c-Jun on serine 63 (pS63), and serine 73 (pS73) proteins in cell extracts from Ctrl and BECN1− B16-F10 cells. Actin was used as loading control. (Right) Expression of Beclin1, phosphorylated c-Jun on serine 63 (pS63), and serine 73 (pS73) proteins in three regions (#1, #2, #3) of Ctrl and BECN1− B16-F10 tumor extracts. Actin was used as loading control. (B) Expression of Beclin1, total and phosphorylated SEK/MKK4 on Ser-80, Thr-261, and Ser-257, and phosphorylated JNK on Thr-185/Tyr-183 in Ctrl and BECN1− B16-F10 melanoma cells. (C, Upper) Expression of Beclin1, phosphorylated JNK on Thr-185/Tyr-183, and phosphorylated c-Jun on serine 63 (pS63) and serine 73 (pS73) proteins in Ctrl and BECN1− cells untreated (−) or treated (+) with JNK inhibitor SP600125. Actin was used as loading control. (Lower) The expression of CCL5 mRNA in cells described in the Upper panel. Data are reported as fold-change (FC) compared with the Ctrl. *P < 0.05 (two-tailed Student's t test). (D, Upper) BECN1− B16-F10 melanoma cells were transfected with control (Ctrl) or JNK1/2 (JNK) siRNA. The expressions of JNK, Ser-63 (pS63), and Ser-73 (pS73) phosphorylated c-Jun were assessed 72 h after transfection. Vinculin was used as loading control. (Lower) The expression of CCL5 mRNA by real-time RT-PCR in cells described in A. Data represent the average ± SD of three independent experiments. ***P < 0.005 (two tailed Student’s t test). (E) PP2A phosphatase activity assay in Ctrl and BECN1− B16-F10 tumor cells. Data reported as picomoles of free phosphate released following incubation of PP2Ac immunoprecipitated from each cell with Threonine phosphopeptide. The result shown is the average ± SEM of five independent experiments performed in duplicate. *P < 0.05 (two-tailed Student’s t test). (F, Left) Expression of PP2A subunit A, total and phosphorylated c-Jun on serine 63 (pS63) and serine 73 (pS73) and total and phosphorylated JNK on Thr-185/Tyr-183 proteins in Ctrl B16-F10 cells untransfected (−) or transfected with PP2A siRNA targeting A subunit. Actin was used as loading control. (Right) Expression of CCL5 mRNA in the cells described in the Left panel. Data are reported as fold-change (FC) compared with the Ctrl. Results represent the average ± SEM of three independent experiments. **P < 0.01 (two-tailed Student’s t test). (G, Upper) Expression of phosphorylated PP2A on Tyr-307 PP2A and phosphorylated c-Jun on serine 63 (pS63) in Ctrl B16-F10 cells untreated (−) or treated (+) with okadaic acid (OA). (Lower) Quantification of CCL5 secreted by cells described in the Upper panel as determined by ELISA.
c-Jun phosphorylation is mediated by the upstream kinase JNK, which in turn is exclusively phosphorylated by MKK4 kinase (35). While no difference was observed in the total expression and the phosphorylation levels of MKK4, a significant increase in the phosphorylation of JNK at Thr-183 and Tyr-185 was detected in BECN1− compared with Ctrl cells (Fig. 3B), suggesting that the increased phosphorylation level of c-Jun in BECN1− cells is most likely related to an increased JNK activity. This assumption was further supported by our data showing that pharmacological (Fig. 3C, Upper) and genetic (Fig. 3D, Upper) inhibition of JNK completely suppressed, as expected, the phosphorylation of c-Jun at Ser-63 and Ser-73 residues and, more interestingly, led to a significant down-regulation of CCL5 mRNA in BECN1− tumor cells (Fig. 3 C and D, Lower).
It has long been postulated that the regulation of protein phosphorylation is partially balanced by the activity of kinases and phosphatases. The serine/threonine phosphatase, PP2A, has been described to be involved in the regulation of JNK phosphorylation and subsequently in that of its downstream protein c-Jun (36). In accordance with this, we assessed PP2A activity in Ctrl and BECN1− B16-F10 cells to determine whether the increased levels of phosphorylated JNK and phosphorylated c-Jun are related to a defect in PP2A activity. The results (Fig. 3E) revealed that PP2A activity was significantly lower in BECN1− compared with Ctrl B16-F10 cells, suggesting that the increased levels of phosphorylated JNK and phosphorylated c-Jun resulted from a decrease in the phosphatase activity of PP2A. This was further supported by our data showing that targeting PP2A subunit A genetically by siRNA in control cells increased the phosphorylation of both JNK and c-Jun (Fig. 3F, Left), and subsequently increased the expression of CCL5 (Fig. 3F, Right). Similarly, treatment of control cells with PP2A inhibitor okadaic acid inhibited its catalytic activity by increasing the phosphorylation at Tyr-307 (Fig. 3G, Upper). Such inhibition enhanced the phosphorylation of c-Jun at Ser-63 and increased the expression of CCL5 (Fig. 3G, Lower). Overall, these results provide a mechanistic clue on how targeting autophagy increases the expression of CCL5 by enhancing the phosphorylation of c-Jun.
Targeting CCL5 in BECN1− Tumors Significantly Reduces the Infiltration of NK Cells into the Tumor Bed and Prevents Tumor Regression.
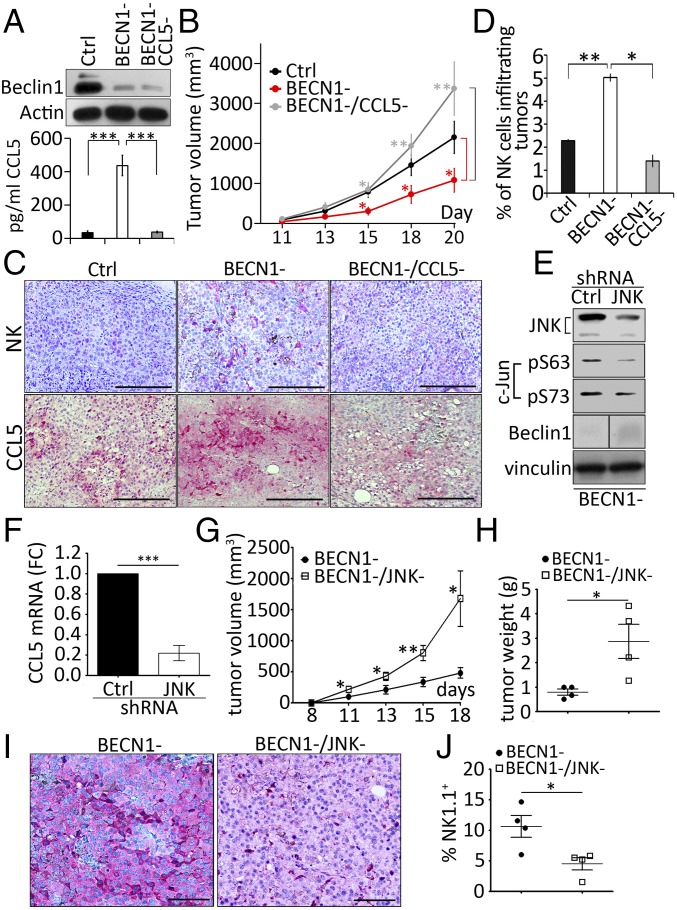
We next investigated the impact of silencing CCL5 on the tumor growth and on the infiltration of NK cells in BECN1− B16-F10 tumors. We generated B16-F10 cells defective for both BECN1 and CCL5 (BECN1−/CCL5−) and characterized them in terms of BECN1 expression and CCL5 secretion. Our results, shown in Fig. 4A, demonstrate a significant inhibition of the secretion of CCL5 in BECN1−/CCL5− cells. Fig. 4B clearly shows that the reduction of tumor growth, seen in BECN1− tumors (Fig. 4B, red curve) compared with controls (Fig. 4B, black curve), was no longer observed when CCL5 was silenced (Fig. 4B, gray curve). Interestingly, immunohistochemistry staining demonstrated that targeting CCL5 in BECN1− tumors dramatically prevented the infiltration of NK cells into the tumor bed (Fig. 4C). The quantification of the percentage of NK cells infiltrating the tumors is shown in Fig. 4D. These data provide additional support that the recruitment of NK cells into BECN1− B16-F10 tumors is driven by CCL5. Because the JNK/c-Jun pathway has been identified in vitro as the major transcription factor involved in the up-regulation of CCL5 in BECN1− tumor cells, our results showed that genetic targeting of JNK/c-Jun pathway (Fig. 4E) resulted in a dramatic decrease in CCL5 expression (Fig. 4F) and an increase in BECN1− tumor volume (Fig. 4G) and weight (Fig. 4H). Interestingly, there was a significant decrease in both the expression of tumoral CCL5 (Fig. 4I) and the infiltration of NK cells into the tumor bed (Fig. 4J and Fig. S4). Overall, our data provide evidence that JNK/c-Jun/CCL5 pathway regulates the recruitment of NK cells into BECN1− tumors.
Fig. 4.
CCL5 is the major chemokine involved in the infiltration of NK cells into BECN1− B16-F10 tumor. (A, Upper) Expression of Beclin1 protein in Ctrl, BECN1−, and BECN1−/CCL5− cells. Actin was used as loading control. (Lower) Quantification of CCL5 secreted into the supernatants of the cells described in the Upper panel. Data represent the average ± SEM of three independent experiments. ***P < 0.001 (two-tailed t test). (B) Tumor cells described above were engrafted subcutaneously in C57BL/6 mice (n = 8 per group). Tumor volume was measured at the indicated days and the average ± SEM was reported. *P < 0.05; **P < 0.01 (two-tailed Student’s t test). (C) Immunohistochemical staining of NK cells (Upper) or CCL5 (Lower) performed on indicated tumor sections using anti–Asialo-GM1 and CCL5 antibodies, respectively. (Scale bars, 200 µm.) (D) Quantification of NK cells infiltrating Ctrl, BECN1− and BECN1−/CCL5− tumors reported as a percentage (%) of the total number of cells for each tumor. Data represent the average ± SEM of two sections from two independent tumors. *P < 0.05; **P < 0.01; ns, not-significant (two-tailed Student’s t test). (E) BECN1− B16-F10 melanoma cells were infected with control (Ctrl) or JNK1/2 (JNK) shRNA. The expressions of JNK, c-Jun, and Beclin1 were assessed. Vinculin was used as loading control. The panel corresponding to the expression of Beclin1 was generated from the same blot but consolidated from noncontiguous loading. (F) The expression of CCL5 mRNA by real-time RT-PCR in cells described in E. Data represent the average ± SEM of three independent experiments. ***P < 0.005 (two tailed Student’s t test). (G) BECN1− and BECN1−/JNK− tumor cells described in E were engrafted subcutaneously in C57BL/6 mice (n = 5 or 6 per group). Tumor volume was measured at the indicated days and the average ± SEM was reported. *P < 0.05; **P < 0.01 (two-tailed Student’s t test). (H) The weight of BECN1− and BECN1−/JNK− tumors described in G at day 18. *P < 0.05 (two-tailed Student’s t test). (I) Immunohistochemical staining of CCL5 performed on BECN1− and BECN1−/JNK− tumor sections using anti-CCL5 antibody. (Scale bars, 100 µm.) (J) Quantification of NK cells infiltrating BECN1− and BECN1−/JNK− tumors reported as a percentage (%) of the total number of cells for each tumor. Data represent the average ± SEM of two sections from one independent tumor. *P < 0.05 (two-tailed Student’s t test).
Fig. S4.
The gating strategy used to quantify NK cell-infiltrating tumors.
The Expression of CCL5 Positively Correlates with Expression of the NK Cell Marker NKp46 and Predicts Improvement of Melanoma Patients’ Survival.
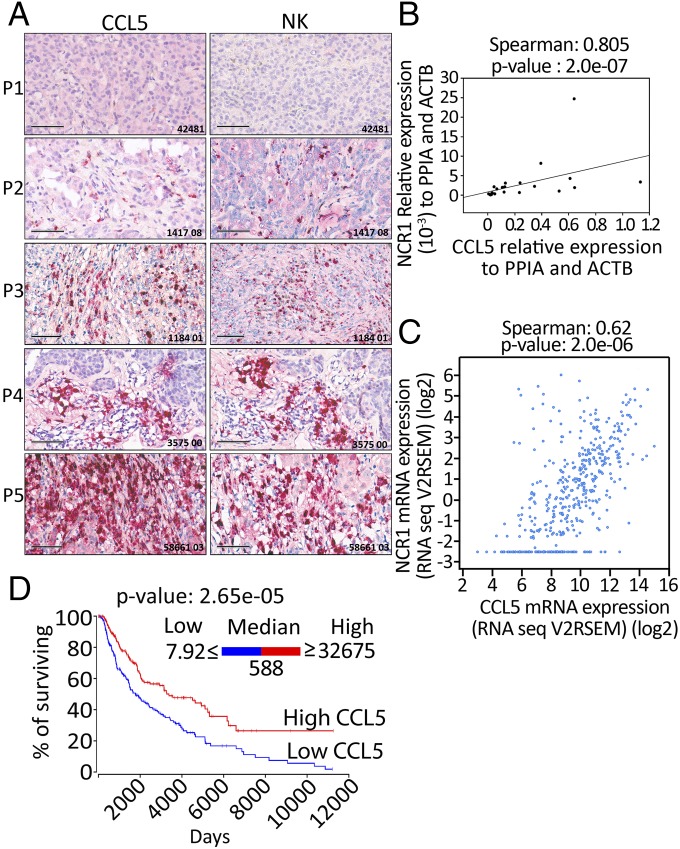
We next investigated whether a positive correlation could be found between the expression of CCL5 and the infiltration of NK cells in melanoma patients. Sections of melanoma tumor biopsies were first stained with CCL5 and assigned, according to the expression level of CCL5, as no, low, moderate, high, and very-high CCL5 staining. These tumors were further stained with the NK cell marker NKp46. Our results reveal a striking positive correlation between the expression levels of CCL5 and NKp46 (Fig. 5A). Our data were further confirmed by quantitative real-time PCR performed using mRNA isolated from a panel of 22 melanoma biopsies (Fig. 5B). To extend our study to an even larger cohort of melanoma patients, we used data from 471 skin cutaneous melanomas described in the TCGA database. As expected, a strong positive correlation was also observed between the expression of CCL5 and the expression of the NKp46 encoding gene NCR1 (Fig. 5C). Taken together, these results highly suggest that melanoma tumors expressing high levels of CCL5 are strongly infiltrated by NK cells.
Fig. 5.
CCL5 overexpression is correlated with the increase of NKp46 and the improvement of melanoma patients’ survival. (A) Twelve FFPE melanoma biopsy sections were stained with CCL5 (Left) or NKp46 (Right) antibodies and immunohistochemical analysis showed that tumor sections strongly positive for CCL5, also had an abundant number of NK cells. Five representative sections (P1 to P5) are reported. (Scale bars, 100 μm.) (B) RNA extracted from 22 melanoma biopsies were assessed for the expression of CCL5 and NKp46 encoding NCR1 gene. The Spearman test showed a significant and positive correlation between the expression of CCL5 and NCR1. (C) A similar Spearman correlation test was set up using RNA-Seq data of 471 skin cutaneous melanomas described in the TCGA database. A positive correlation was found between the expression of CCL5 and NCR1. The expression of each gene was reported as RNA-Seq V2RSEM (RNA-Seq expression estimation by expectation-maximization). (D) Kaplan–Meier survival plot of skin cutaneous melanoma (SKCM) patients generated using OncoLnc resource. TCGA data of 458 melanoma patients were assigned into low or high groups according to the expression level of CCL5 reported as RNASeq values. Patients having a CCL5 expression level ranging from 7.92 to 588 were considered as low (blue curve) and those having a CCL5 expression level ranging from 588 to 32,675 were considered as high (red curve). Statistically significant difference is indicated by P value.
We next assessed the impact of CCL5 level on the survival of 458 melanoma patients using the recently described OncoLnc resource (www.oncolnc.org). This resource links RNAseq data of particular genes with patients’ survival using clinical data from The Cancer Genome Atlas (TCGA) (37). Based on RNAseq data, the median log expression level of CCL5 in melanoma patients was 588.44 (reported as a “log”). According to the expression level of CCL5, the 458 melanoma samples were assigned into low and high CCL5-expressing groups, each of them containing 229 samples. The expression of CCL5 in the low and high groups ranged from 7.92 to 588 and from 588 to 32,675, respectively. The Kaplan–Meier survival plot reported in Fig. 5D depicts that melanoma patients with an elevated expression level of CCL5 had a significant longer survival. Taken together, these data strongly suggest that the improvement of the survival of melanoma patients displaying a high level of CCL5 is most likely due to an increase in the infiltration of NK cells into the tumors.
Discussion
The role of NK cells in the improvement of immune responses to cancer has been extensively investigated during the past few decades, and several NK cell-based immunotherapies have been proposed and are used in the clinic (38).
CCL5, also known as RANTES, is a small protein that belongs to a large family of cytokines and displays chemotaxis activity, as it is involved in inducing the migration of several leukocytes into inflammation sites (39). CCL5 is secreted by a wide variety of cells, including T cells (40), NKs (27), and some tumor cells (41). CCL5 interacts with different receptors including C-C chemokine receptor types 1, 3, and 5 (CCR1, CCR3, and CCR5) (42). Controversial data exist about the role of CCL5 in the tumor microenvironment. While some reports highlight the role of CCL5 in promoting breast cancer metastasis (43), others refer the importance of CCL5 in T cell recruitment into melanomas (26). It seems that the pro- or the antioncogenic roles of CCL5 depends on the tumor type, the nature of the cells secreting CCL5, and the different interactions within the tumor microenvironment. Although the role of CCL5 in the recruitment of NK cells in inflammation and allergic diseases has been widely studied, no data are available so far about its role in the recruitment of NK cells into the tumor microenvironment. In line with our previous work, which showed that targeting autophagy improves the NK-mediated antitumor immune response (17), we show here that inhibiting autophagy increases the expression and the release of CCL5 by murine B16-F10 tumor cells both in vitro and in vivo, which subsequently led to a massive infiltration of NK cells into the tumor bed. Because the expression of CCL5 was also observed in ATG5-defective cells and after chloroquine treatment, we strongly believe that targeting the autophagy mechanism as a whole, rather than specifically targeting BECN1, results in the improvement of the NK-mediated antitumor immune responses by inducing NK cell-homing into tumors.
It has been previously reported that CCL5 can increase the cytotoxicity of CD56+ human NK cells (44). Other studies also showed that CCL5 promotes the release of cytotoxic granules by human NK cells (45–47). We therefore asked whether an elevated level of CCL5 could enhance the cytolytic activity of NK cell-infiltrating tumors. We strongly believe that CCL5 released by BECN1− tumor cells has no impact on the activation status of NK cells as, when reported to the total number of NK cells, no differences in the expression of NK cell-activation markers CD69 and GzmB were observed in NK cell-infiltrating control or BECN1− tumors.
Another important question is to determine whether CCL5 is the only factor involved in the recruitment of NK cells. Indeed, in addition to CCL5, our cytokine array revealed that CXCL10 was found to be up-regulated in BECN1− tumor cells, although at a lower extent. Based on the fact that CXCL10 has also been described to induce the migration of NK cells (27), the involvement of CXCL10 in the homing of NK cells cannot be ruled out, and additional experiments need to be conducted to determine the relative contribution of CXCL10. Nevertheless, our data showed that targeting CCL5 was sufficient to significantly suppress the infiltration of NK cells and subsequently enhance the tumor growth in BECN1− tumors, strongly suggesting that CCL5 is the major factor involved in the recruitment of NK cells to B16-F10 melanoma tumors.
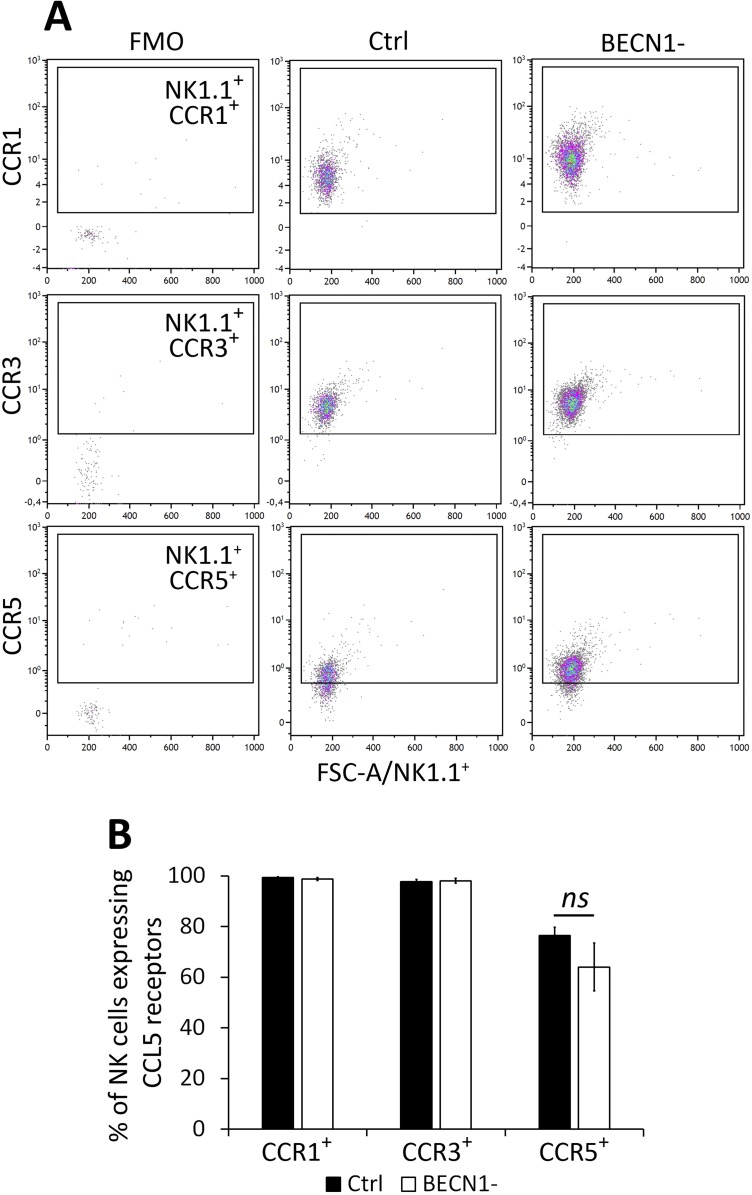
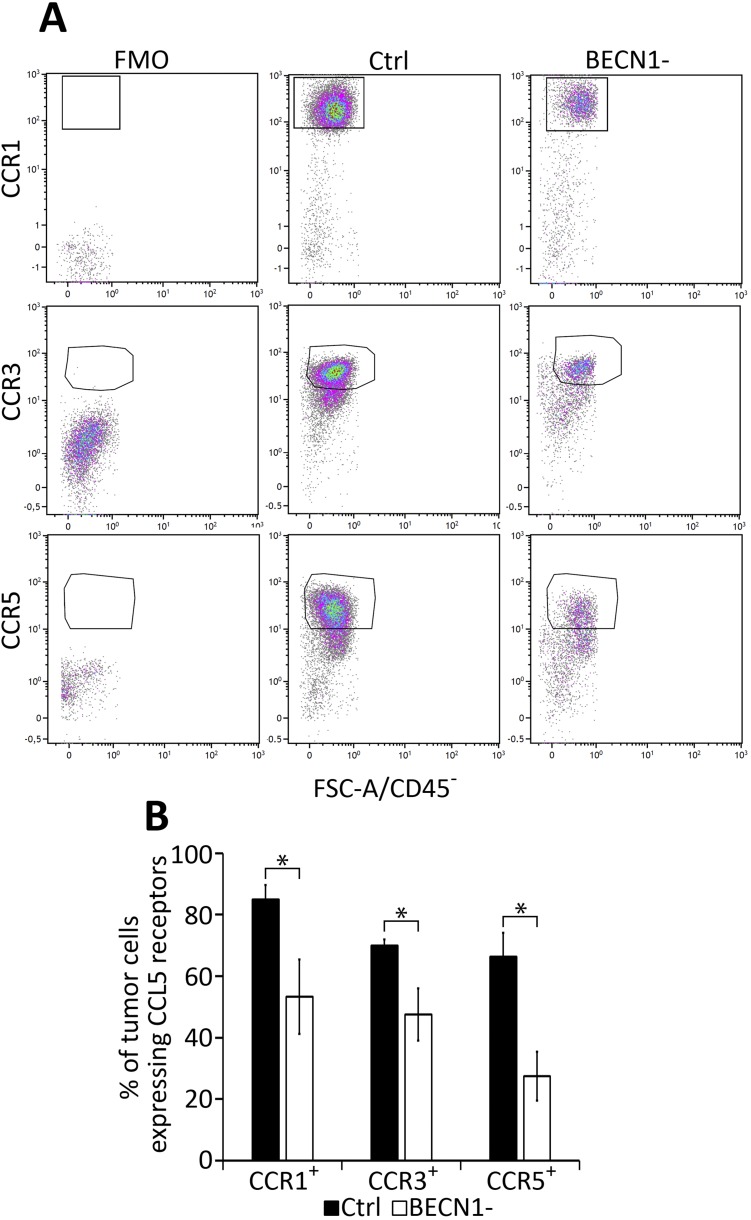
CCL5 elicits its chemo-attracting activity by acting via CCR1, CCR3, and CCR5 (48). As such, the increased migration of NK cells toward a CCL5 gradient could be related to the increased expression of CCL5 receptors on the surface of NK cells infiltrating BECN1− tumors. This possibility can be ruled out since no difference in the expression of CCR1, CCR3, and CCR5 was found on the surface of NK cells infiltrating both control and BECN1− tumors (Fig. S5). Interestingly, we even observed that BECN1− B16-F10 cells isolated from tumors exhibited significantly lower levels of CCR1, CCR3, and CCR5 compared with controls (Fig. S6). This implies that the autocrine CCL5 signaling, previously described to promote the invasion and migration of tumor cells (49), is attenuated in BECN1− tumor cells, and that CCL5 released by tumor cells primarily acts via paracrine signaling to attract NKs to the tumor bed. However, how the CCL5 receptors are regulated in BECN1− tumors remains, so far, an unresolved issue that needs to be further investigated.
Fig. S5.
Percentage of CCL5 receptors expressed on NK cells infiltrated in Ctrl and BECN1− B16-F10 tumors. NK cells infiltrating Ctrl and BECN1− B16-F10 tumors were stained with NK1.1-, CCR1-, CCR3-, and CCR5-specific antibodies and subjected to flow cytometric analyses. NK1.1+/CD45+CD11b−CD19− cells were gated and the percentage of CCR1+, CCR3+, and CCR5+ NK cells were determined. (A) Representative flow cytometry plots of NK1.1+CCR1+, NK1.1+CCR3+, and NK1.1+CCR5+ in Ctrl and BECN1− B16-F10 tumors. Quadrant settings were based on the cells stained with FMO and then applied to the plots of cells stained with positive antibodies. (B) Percentage of CCR1+, CCR3+, and CCR5+ total NK cells infiltrating Ctrl and BECN1− tumors. Not-significant differences were observed in CCR1, CCR3, and CCR5 between Ctrl and BECN1− tumors.
Fig. S6.
Percentage of CCL5 receptors expressed in Ctrl and BECN1− B16-F10 tumors. Tumor cells from Ctrl and BECN1− B16-F10 tumors were stained with CCR1-, CCR3-, and CCR5-specific antibodies and were subjected to flow cytometric analyses. CD45− cells were gated and defined as tumor cells after which the percentage of CCR1+, CCR3+, and CCR5+ tumor cells were determined. (A) Representative flow cytometry plots of CD45−CCR1+; CD45−CCR3+, and CD45−CCR5+ in Ctrl and BECN1− B16-F10 tumors. Quadrant settings were based on the cells stained with FMO and then applied to the plots of cells stained with positive antibodies. (B) Percentage of CCR1, CCR3, and CCR5 in total CD45− cells from Ctrl and BECN1− B16-F10 tumors. Data shows the significant differences in the percentage of CCR1, CCR3, and CCR5 between tumor cells from Ctrl and BECN1− tumors. Results are the average ± SEM of four mice from each group. *P < 0.05 (two-tailed Student’s t test).
Mechanistically, we provide strong evidence that targeting BECN1 induces a dramatic phosphorylation of c-Jun at both Ser-63 and Ser-73 residues through PP2A-dependent increase of JNK phosphorylation. Therefore, our results predict that c-Jun is constitutively present in control cells in an inactive form and that targeting autophagy induces the phosphorylation of c-Jun at Ser-63 and Ser-73 residues located within its transactivation domain. Such phosphorylation serves to increase both its stability and transcriptional activity, as previously reported (50, 51).
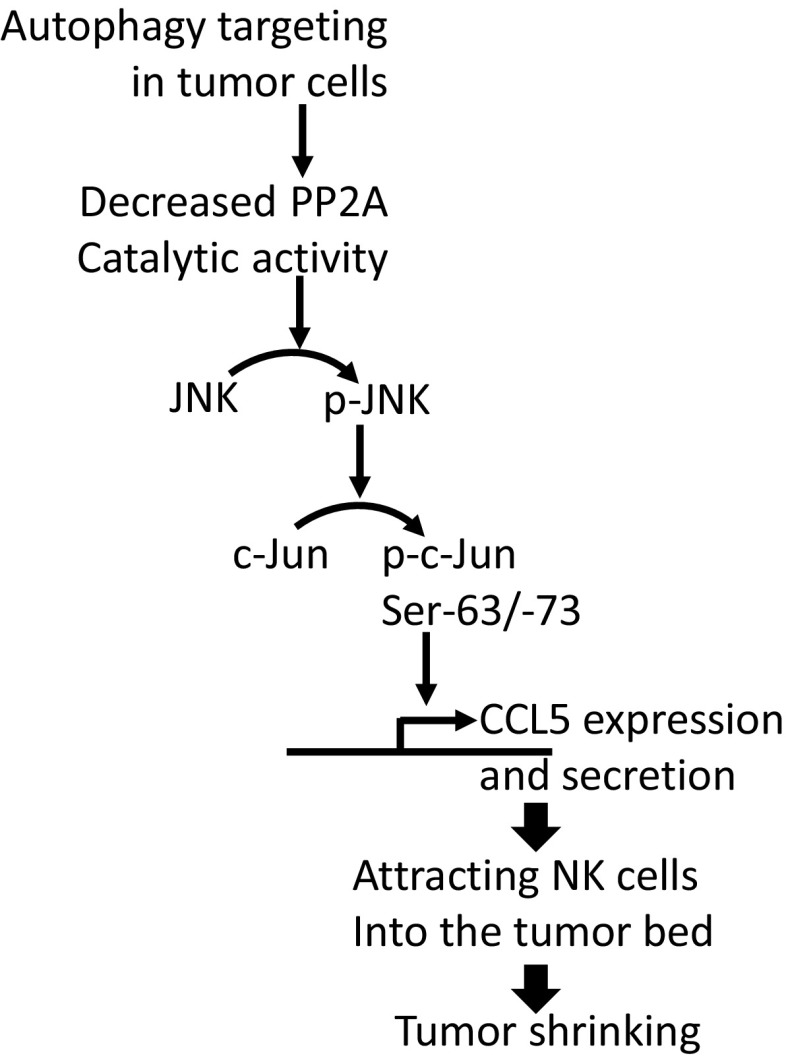
The increase in the phosphorylation of JNK/c-Jun in BECN1− cells seems to be tightly linked to the decreased activity of PP2A. Although the causal mechanisms underlying the decrease in PP2A activity in BECN1− cells remains largely unknown, our data provide an important mechanistic clue on how CCL5 is transcriptionally regulated in BECN1− tumor cells. A schematic representation of the mechanism underlying the expression of CCL5 in BECN1− cells is reported in Fig. 6. In addition, we strongly believe that the increased-phosphorylation of c-Jun at Ser-63 residue is a consequence of targeting Beclin1 rather than the up-regulation of CCL5, as the level of phosphorylated c-Jun was not affected following CCL5 silencing in BECN1− tumor cells (Fig. S7).
Fig. 6.
Schematic representation of the mechanism involved in the overexpression of CCL5 in BECN1− tumor cells. Inhibition of autophagy by targeting BECN1 decreases the catalytic phosphatase activity of PP2A by a mechanism that is not fully understood. The decreased PP2A activity leads to an increased phosphorylation of both JNK (p-JNK) and its downstream c-Jun at Ser-63 and Ser-73 (p-c-Jun Ser-63/-73). The activation of c-Jun by phosphorylation enhances the expression of CCL5 gene. CCL5 released by tumor cells attracts NK cells into the tumor bed leading to the decrease in tumor growth.
Fig. S7.
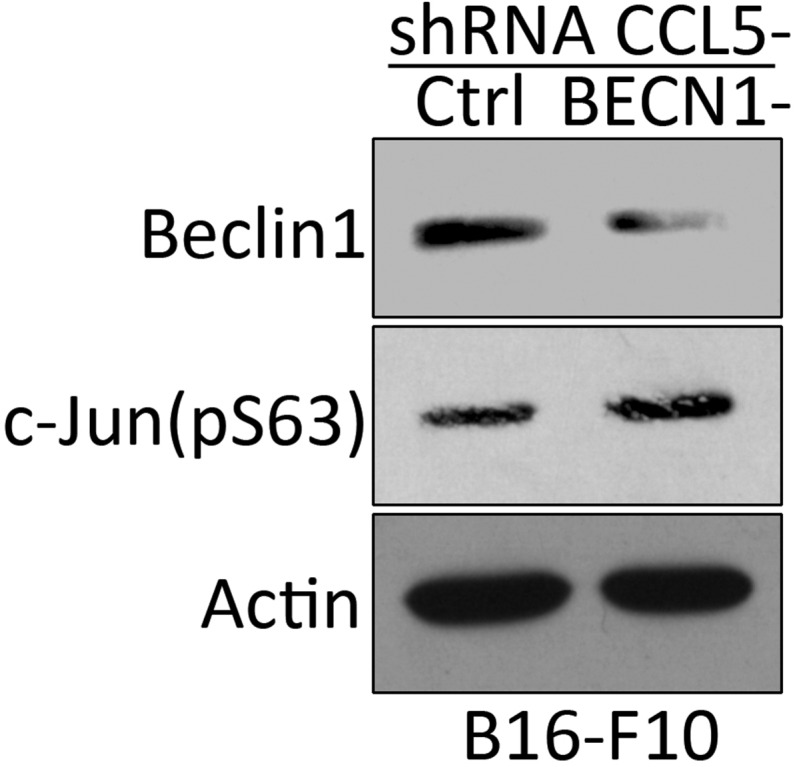
The high phosphorylation level of c-Jun on Ser-63 in BECN1− B16-F10 cells is not affected by silencing CCL5. Control and BECN1− B16-F10 cells displaying a high level of Ser-63 phosphorylated c-Jun were transfected with shRNA targeting CCL5. The expression of Beclin1 and Ser-63 (pS63) c-Jun was assessed by Western blot. Actin was used as a loading control.
It is now well established that tumor infiltration by NK cells represents a positive prognostic marker in different cancers, including colorectal (7), gastric (52), and lung carcinomas (53). It has been suggested that low NK cell numbers in tumors are likely due to their inefficient homing into the tumor bed, which could be overcome by cytokine-mediated activation (2). Furthermore, convincing evidence for a beneficial role of NK cells in the control of tumor growth was provided from clinical studies of leukemia patients who received alloreactive NK cells in the course of allogenic hematopoietic stem cell transplantation (2). Using a small cohort of melanoma tumor biopsies, we show here a striking correlation between the expression of CCL5 and NK cell marker NKp46 at the protein and mRNA levels. As tumoral CCL5 has been described to recruit T cells (54) and macrophages (55) into the tumor bed as well, we cannot exclude that melanoma tumors expressing a high level of CCL5 are not only highly infiltrated by NK cells but also by T cells and macrophages. Furthermore, it should be noted that the CCL5 staining detected in melanoma biopsies may not be only produced by tumor cells, since other cells in the tumor microenvironment—such as T cells—can also secrete CCL5, as previously reported (56, 57). Nevertheless, the positive correlation between CCL5 and NK cells was further confirmed using more than 400 melanoma patients from the TCGA database. Consistent with the fact that CCL5 induces the homing of NK cells into the tumor bed, it stands to reason that CCL5 overexpression impacts on the survival of melanoma patients. Accordingly, we show that the long-term survival of melanoma patients overexpressing CCL5 was significantly improved.
It is now well accepted that NK cells are capable of driving potent antitumor responses (58). However, tumor cells often compromise the antitumor immunity by inducing an immunosuppressive microenvironment (59). Our data reported here reveal the impact of targeting autophagy in tumor cells on the release of chemokine involved in the infiltration of NK cells. Although much remains to be learned mechanistically, this study provides a cutting-edge approach on how to switch the immunosuppressive tumor microenvironment to an immunosupportive one, allowing for the redirection of NK cells to the tumor bed. One issue of great interest that remains to be addressed is to investigate the impact of targeting autophagy on the immune landscape of tumors and on the infiltration of other populations of immune cells into the tumor bed. Nevertheless, it is our belief that the knowledge generated from this study will pave the way to fully exploit NK cells’ antitumor properties in clinical settings.
Materials and Methods
Immunoblot Assays.
Cell lysates were prepared using RIPA lysis buffer (20-188; Millipore) supplemented with a protease inhibitor mixture (11873580001; Prophac) and phosphatase inhibitor mixture 2 and 3 (P5726-5ML and P0044-5ML; Sigma). Protein concentration was determined using Bio-Rad protein assay dye reagent (500-0006; Bio-Rad). Equal amounts of proteins were loaded on SDS/PAGE gel, transferred to nitrocellulose membranes, and blocked with either 5% of milk or 5% of BSA according to the manufacturer’s instructions for each antibody. The following primary antibodies were used: Beclin1 (3738; Cell Signaling), c-Jun (9165S; Cell Signaling), phospho c-Jun S63 (9261S; Cell Signaling), phospho c-Jun S73 (3270S; Cell Signaling), LC3II (2775S; Cell Signaling), ATG5 (MBL 153-3; MBL), GAPDH (5174S; Cell Signaling), SAPK/JNK (9552S; Cell Signaling), phospho SAPK/JNK (Thr183/Tyr185) (9251S; Sell Signaling), PP2A subunit A (2041; Cell Signaling), phospho PP2A tyr307 (sc-271903; Santa Cruz), SEK1/MKK4 (9152S; Cell Signaling), phospho SEK1/MKK4 S257 (4514P; Cell Signaling), phospho SEK1/MKK4 S80 (9155S; Cell Signaling), phospho SEK1/MKK4 Thr261 (9151S; Cell Signaling), and actin (A5441; Sigma Aldrich). Blots were then incubated with horseradish peroxidase-conjugated secondary antibodies (Jackson ImmunoResearch Laboratories). Proteins were detected using enhanced chemiluminescence ECL (GE Healthcare).
RNA Extraction and Reverse-Transcriptase PCR.
Total RNAs were extracted using the miRCURY RNA isolation kit (300110; Exiqon). RNA (1 µg) from each sample was reverse-transcribed using a reverse-transcription reaction mix (Eurogentec). The reverse transcription was performed at 48 °C for 30 min. The resulting cDNA was subjected to amplification by qPCR using power SYBR green PCR master mix (Life Technologies). The RPL13 gene encoding Ribosomal Protein L13 was used as internal control. For mouse RPL13, the following primers were used: forward 5′-GGAGGGGCAGGTTCTGGTAT-3′ and reverse 5′-TGTTGATGCCTTCACAGCGT-3′. For mouse CCL5, the following primers were used: forward 5′-CTGCTGCTTTGCCTACCTCT-3′ and reverse 5′-CGAGTGACAAACACGACTGC-3′. RNAs from melanoma patients were provided by the Gustave Roussy Cancer Center, Villejuif, France. Briefly, RNAs from frozen melanoma were extracted using the Qiagen miRNEasy kit (217004; Courtaboeuf) and those from formalin-fixed paraffin-embedded (FFPE) were extracted using the Qiagen RNeasy FFPE kit (73504; Qiagen). RNAs were quantified by Nanodrop and their quality was verified by Bioanalyzer. The reverse-transcription qPCR was performed by AnyGenes Company (Tenon Hospital, Paris). Information related to the primers used amplification is the following. PPIA and ACTB genes encoding Peptidylprolyl isomerase A and actin β, respectively, were used as internal loading controls; for NKp46 encoding NCR1 gene, the forward primer is localized in exon 4 and the reverse primer is localized at the junction of exons 4 and 5; for CCL5, the forward and reverse primers are localized in exon 1 and 2, respectively; for PPIA, the forward and reverse primers are localized in exon 1 and 2, respectively; and for ACTB, the forward and reverse primers are localized in exon 6.
Cytokine Array and ELISA Measurement of Mouse and Human CCL5.
The profiling of different cytokines and chemokines was performed by Mouse cytokine array, and panel A (R&D systems) according to the manufacturer’s instructions using serum-free supernatant harvested from equal number of cells. The signal intensities of the spots were quantified by ImageJ. CCL5 secretion by cells was quantified using the CCL5/RANTES Quantikine Elisa kit (R&D Systems) according to the manufacturer’s instructions. The sensitivity of ELISA kits was 2.0 pg/mL for mouse CCL5 and 5.0 pg/mL for human CCL5.
In Vivo Tumor Growth and Flow Cytometry Analysis.
Nine-week-old C57BL/6 mice were engrafted subcutaneously with B16F10 melanoma cells (2.3 × 10⁵ cells per mouse). Tumor growth was measured using a caliper every other day starting from day 11. Tumor volume was calculated as follows: volume (cm3) = 3.14159/6 × (width × length × height). B16-F10 tumor-bearing C57BL/6 mice were killed at day 21. The mouse experiments were performed according to the Luxembourg Institute of Health's instructions and guidelines and approved by the Luxembourg Institute of Health Ethical Committee. For flow cytometry analysis, cells were dissociated from tumors in DMEM complete medium, and centrifuged for 10 min at 4 °C. Red blood cells were lysed using ACK lysing buffer (10-548E; Lonza). Cells were counted and Fc-receptors were blocked with CD16/CD32 for 30 min before staining with appropriate antibodies. The following antibodies were used: BV421 anti-mouse NK1.1 (108731; Biolegend), Al700 anti-mouse CD19 (115528; Biolegend), APC-R700 rat anti-mouse CD11b (564985; BD Horizon), BUV395 rat anti-mouse CD45 (564279; BD Horizon), BV605 Hamster anti-mouse CD69 (563290; BD Horizon), Pacific blue anti-human/mouse GzmB (515407; Biolegend) and live/dead near IR (L10119; Life Technologies). CD45+/CD11b−/CD19− cells were gated to determine the percentage of NK1.1+; NK1.1+GzmB+, and NK1.1+CD69+.
Immunohistochemistry Staining.
FFPE tumor sections (5 µm) from B16-F10 tumors were used to determine the expression of NK and CCL5/RANTES by immunohistochemistry using rabbit anti-Asialo GM1 polyclonal antibody (986-10001; Wako Chemicals) and CCL5/RANTES antibody (NBP1-19769; Novus Biologicals) respectively. The staining was performed at the Laboratory of Experimental Pathology, Gustave Roussy Cancer Center, Villejuif, France. Stained sections were scanned with the Leica Aperio AT2 scanner and the number of NK+ and CCL5+ cells were quantified by HistoWiz Company using HALO software from Indica laboratories. FFPE sections from melanoma patients were assessed for the expression of CCL5 and NKp46 using NBP1-19769 and NBP2-11820 antibodies (Novus Biological), respectively. Stained sections were scanned with Leica Aperio AT2 by HistoWiz.
Cell Culture and Treatments.
B16-F10 cells from ATCC were maintained in DMEM supplied with 10% of FBS and 1% of penicillin/streptomycin. IPC298, MelJuso and A375 cells were provided by S.K. and were maintained in RPMI medium supplied with 10% of FBS and 1% of penicillin/streptomycin. B16-F10 cells were treated with 60 µM of chloroquine during 4 h or with 20 µM of SP600125 overnight and washed before harvesting RNAs and proteins.
PP2A in Vitro Protein Phosphatase Assay.
A PP2A immunoprecipitation phosphate assay kit (Millipore) was used to detect PP2A activity according to the manufacturer’s instructions. Briefly, 200 μg of Ctrl and BECN1− B16-F10 cells lysates were used to immunoprecipitate PP2A using anti-PP2Ac antibody. PP2A bound beads were washed with phosphatase assay buffer and phosphopeptide (KRpTIRR) in serine/threonine assay buffer (750 µM) was added and incubated 10 min at 30 °C. After centrifugation, 25 μL of the supernatant was transferred to a microplate and 100 μL of Green phosphate assay was added for 15 min. The relative absorbance was measured at 630 nm. The absorbance values were compared with negative controls containing no enzyme.
Generation of BECN1− and CCL5− B16-F10 Cell Line.
Scrambled and mouse BECN1 short hairpin (shRNA) lentiviral particles were purchased from Santa Cruz Biotechnology. Cells were transduced in the presence of puromycin. Control and mouse CCL5 SureSilencing shRNA encoding plasmids were purchased from Qiagen. Transfected cells were maintained in the presence of hygromycin. Mouse JNK1 and JNK2 shRNA Lentiviral Particles were purchased from Santa Cruz Biotechnology.
In Vitro Chemotaxis Experiment.
The migration of NK92MI cells was evaluated in µ-Slide Chemotaxis3D from ibidi according to the manufacturer’s instructions. NK92MI cells (9 × 10⁶ cells/mL) cultured in serum-free medium in the absence or presence of 20 ng/mL of human recombinant CCL5/RANTES were transferred to the ibidi slide reservoirs. The time-lapse experiment was performed using Cell IQ platform during 48 h. One image was recorded every 15 min and the migration of NK92MI cells was analyzed by Tracking Tool PRO v2.0 software.
siRNA Transcfections.
Small interference RNAs (siRNA) were purchased from Qiagen. Cells were transfected using Lipofectamine RNAiMax reagent (13778-075; Life Technologies) in Opti-MEM reduced serum medium (31985070; Thermo Fisher Scientific). The following siRNAs against human Beclin1 were used: SI0005594 for IPC298 and A375, SI00055573 for MelJuso. siRNA against mouse ATG5 was SI02696806. siRNA against mouse p62 was SI02713445 (Qiagen). siRNA against mouse JNK1 was SI01300691. siRNA against JNK2 was SI01300803. Transfected cells were harvested for RNA and protein extractions.
In Vivo Experiments and Clinical Samples.
In vivo protocols were approved by the “Comité National d’Ethique de Recherche” Luxembourg, LHCE-2014-02. Clinical samples were collected from patients after having given their written informed consent in accordance with the declaration of Helsinki.
Statistical Analysis.
Statistically significant differences were evaluated using the unpaired two-tailed t test (SigmaPlot 12.5). A P value of less than 0.05 was considered statistically significant. Data were expressed as average ± SEM. The Spearman test was used to determine the correlation between the expression of CCL5 and NKp46-encoding NCR1 genes in melanoma patients. Melanoma patients’ survival curves were generated by the OncoLnc tool (open access), which uses the Kaplan–Meier method for generating the curves and a log-rank test for calculating P values.
SI Materials and Methods
The following antibodies were used to perform staining on NK and tumor cells for flow cytometry analysis: PECD191 (FAB5986P-025; R&D), Percpcy5.5 CD193 (144515; Biolegend), AF488 CD195 (107008; Biolegend), BV421 anti-mouse NK1.1 (108731; Biolegend), Al700 anti-mouse CD19 (115528; Biolegend), APC-R700 Rat anti-mouse CD11b (564985; BD Horizon), and BUV395 Rat anti-mouse CD45 (564279; BD Horizon).
Acknowledgments
We thank Lea Guyonnet from the National Cytometry Platform at Luxembourg Institute of Health for her assistance in flow cytometry analysis; Olivia Bawa from the Gustave Roussy Cancer Center for her assistance in immunohistochemistry staining; and Cristina Maximo from Luxembourg Institute of Health for proofreading the manuscript. This work was supported by grants from Fond National de la Recherche, Luxembourg (Grant FNR-AFR 7842786 to T.M.), Luxembourg Institute of Health (Grant LHCE 2013 11 05 to B.J.), Fonds de la Recherche Scientifique FNRS Televie (Grants 7.6503.16 to T.A. and B.J., 7.4664.15 to M.Z.N. and B.J., and 7.4571.15 to E.V. and B.J.), Fondation Cancer, Luxembourg (Grants FC/2012/02 and F/2016/01 to B.J. and G.B.), Calouste Gulbenkian Foundation (Grant P.1333237 to T.M. and B.J.), Ligue Contre le Cancer (Équipes Labellisées), and Institut National du Cancer (to S.C.).
Footnotes
The authors declare no conflict of interest.
This article is a PNAS Direct Submission. C.G.D. is a guest editor invited by the Editorial Board.
This article contains supporting information online at www.pnas.org/lookup/suppl/doi:10.1073/pnas.1703921114/-/DCSupplemental.
References
- 1.Orange JS. Natural killer cell deficiency. J Allergy Clin Immunol. 2013;132:515–525, quiz 526. doi: 10.1016/j.jaci.2013.07.020. [DOI] [PMC free article] [PubMed] [Google Scholar]
- 2.Waldhauer I, Steinle A. NK cells and cancer immunosurveillance. Oncogene. 2008;27:5932–5943. doi: 10.1038/onc.2008.267. [DOI] [PubMed] [Google Scholar]
- 3.Guillerey C, Huntington ND, Smyth MJ. Targeting natural killer cells in cancer immunotherapy. Nat Immunol. 2016;17:1025–1036. doi: 10.1038/ni.3518. [DOI] [PubMed] [Google Scholar]
- 4.Bernardini G, Santoni A. The pathophysiological role of chemokines in the regulation of NK cell tissue homing. Crit Rev Oncog. 2014;19:77–90. doi: 10.1615/critrevoncog.2014010386. [DOI] [PubMed] [Google Scholar]
- 5.Maghazachi AA. Role of chemokines in the biology of natural killer cells. Curr Top Microbiol Immunol. 2010;341:37–58. doi: 10.1007/82_2010_20. [DOI] [PubMed] [Google Scholar]
- 6.Sconocchia G, et al. Melanoma cells inhibit NK cell functions. Cancer Res. 2012;72:5428–5429, author reply 5430. doi: 10.1158/0008-5472.CAN-12-1181. [DOI] [PubMed] [Google Scholar]
- 7.Coca S, et al. The prognostic significance of intratumoral natural killer cells in patients with colorectal carcinoma. Cancer. 1997;79:2320–2328. doi: 10.1002/(sici)1097-0142(19970615)79:12<2320::aid-cncr5>3.0.co;2-p. [DOI] [PubMed] [Google Scholar]
- 8.Melero I, Rouzaut A, Motz GT, Coukos G. T-cell and NK-cell infiltration into solid tumors: A key limiting factor for efficacious cancer immunotherapy. Cancer Discov. 2014;4:522–526. doi: 10.1158/2159-8290.CD-13-0985. [DOI] [PMC free article] [PubMed] [Google Scholar]
- 9.Alvarez IB, et al. Role played by the programmed death-1-programmed death ligand pathway during innate immunity against Mycobacterium tuberculosis. J Infect Dis. 2010;202:524–532. doi: 10.1086/654932. [DOI] [PubMed] [Google Scholar]
- 10.Hassan SS, Akram M, King EC, Dockrell HM, Cliff JM. PD-1, PD-L1 and PD-L2 gene expression on T-cells and natural killer cells declines in conjunction with a reduction in PD-1 protein during the intensive phase of tuberculosis treatment. PLoS One. 2015;10:e0137646. doi: 10.1371/journal.pone.0137646. [DOI] [PMC free article] [PubMed] [Google Scholar]
- 11.Norris S, et al. PD-1 expression on natural killer cells and CD8(+) T cells during chronic HIV-1 infection. Viral Immunol. 2012;25:329–332. doi: 10.1089/vim.2011.0096. [DOI] [PubMed] [Google Scholar]
- 12.Stojanovic A, Fiegler N, Brunner-Weinzierl M, Cerwenka A. CTLA-4 is expressed by activated mouse NK cells and inhibits NK cell IFN-γ production in response to mature dendritic cells. J Immunol. 2014;192:4184–4191. doi: 10.4049/jimmunol.1302091. [DOI] [PubMed] [Google Scholar]
- 13.Chow MT, Luster AD. Chemokines in cancer. Cancer Immunol Res. 2014;2:1125–1131. doi: 10.1158/2326-6066.CIR-14-0160. [DOI] [PMC free article] [PubMed] [Google Scholar]
- 14.Payne AS, Cornelius LA. The role of chemokines in melanoma tumor growth and metastasis. J Invest Dermatol. 2002;118:915–922. doi: 10.1046/j.1523-1747.2002.01725.x. [DOI] [PubMed] [Google Scholar]
- 15.Hong M, et al. Chemotherapy induces intratumoral expression of chemokines in cutaneous melanoma, favoring T-cell infiltration and tumor control. Cancer Res. 2011;71:6997–7009. doi: 10.1158/0008-5472.CAN-11-1466. [DOI] [PubMed] [Google Scholar]
- 16.Lim JY, Gerber SA, Murphy SP, Lord EM. Type I interferons induced by radiation therapy mediate recruitment and effector function of CD8(+) T cells. Cancer Immunol Immunother. 2014;63:259–271. doi: 10.1007/s00262-013-1506-7. [DOI] [PMC free article] [PubMed] [Google Scholar]
- 17.Baginska J, et al. Granzyme B degradation by autophagy decreases tumor cell susceptibility to natural killer-mediated lysis under hypoxia. Proc Natl Acad Sci USA. 2013;110:17450–17455. doi: 10.1073/pnas.1304790110. [DOI] [PMC free article] [PubMed] [Google Scholar]
- 18.Mizushima N. Autophagy in protein and organelle turnover. Cold Spring Harb Symp Quant Biol. 2011;76:397–402. doi: 10.1101/sqb.2011.76.011023. [DOI] [PubMed] [Google Scholar]
- 19.Yang Z, Klionsky DJ. Mammalian autophagy: Core molecular machinery and signaling regulation. Curr Opin Cell Biol. 2010;22:124–131. doi: 10.1016/j.ceb.2009.11.014. [DOI] [PMC free article] [PubMed] [Google Scholar]
- 20.Klionsky DJ, et al. Guidelines for the use and interpretation of assays for monitoring autophagy (3rd edition) Autophagy. 2016;12:1–222. doi: 10.1080/15548627.2015.1100356. [DOI] [PMC free article] [PubMed] [Google Scholar]
- 21.Choi AM, Ryter SW, Levine B. Autophagy in human health and disease. N Engl J Med. 2013;368:1845–1846. doi: 10.1056/NEJMc1303158. [DOI] [PubMed] [Google Scholar]
- 22.Yang ZJ, Chee CE, Huang S, Sinicrope FA. The role of autophagy in cancer: Therapeutic implications. Mol Cancer Ther. 2011;10:1533–1541. doi: 10.1158/1535-7163.MCT-11-0047. [DOI] [PMC free article] [PubMed] [Google Scholar]
- 23.Noman MZ, Janji B, Berchem G, Mami-Chouaib F, Chouaib S. Hypoxia-induced autophagy: A new player in cancer immunotherapy? Autophagy. 2012;8:704–706. doi: 10.4161/auto.19572. [DOI] [PubMed] [Google Scholar]
- 24.Noman MZ, et al. Blocking hypoxia-induced autophagy in tumors restores cytotoxic T-cell activity and promotes regression. Cancer Res. 2011;71:5976–5986. doi: 10.1158/0008-5472.CAN-11-1094. [DOI] [PubMed] [Google Scholar]
- 25.Ardolino M, et al. Cytokine therapy reverses NK cell anergy in MHC-deficient tumors. J Clin Invest. 2014;124:4781–4794. doi: 10.1172/JCI74337. [DOI] [PMC free article] [PubMed] [Google Scholar]
- 26.Harlin H, et al. Chemokine expression in melanoma metastases associated with CD8+ T-cell recruitment. Cancer Res. 2009;69:3077–3085. doi: 10.1158/0008-5472.CAN-08-2281. [DOI] [PMC free article] [PubMed] [Google Scholar]
- 27.Robertson MJ. Role of chemokines in the biology of natural killer cells. J Leukoc Biol. 2002;71:173–183. [PubMed] [Google Scholar]
- 28.Wirawan E, et al. Beclin1: A role in membrane dynamics and beyond. Autophagy. 2012;8:6–17. doi: 10.4161/auto.8.1.16645. [DOI] [PubMed] [Google Scholar]
- 29.Nelson PJ, Kim HT, Manning WC, Goralski TJ, Krensky AM. Genomic organization and transcriptional regulation of the RANTES chemokine gene. J Immunol. 1993;151:2601–2612. [PubMed] [Google Scholar]
- 30.Li M, Ge Q, Wang W, Wang J, Lu Z. c-Jun binding site identification in K562 cells. J Genet Genomics. 2011;38:235–242. doi: 10.1016/j.jgg.2011.05.004. [DOI] [PubMed] [Google Scholar]
- 31.Selvaraj S, Kono H, Sarai A. Specificity of protein-DNA recognition revealed by structure-based potentials: Symmetric/asymmetric and cognate/non-cognate binding. J Mol Biol. 2002;322:907–915. doi: 10.1016/s0022-2836(02)00846-x. [DOI] [PubMed] [Google Scholar]
- 32.Rauscher FJ, 3rd, Voulalas PJ, Franza BR, Jr, Curran T. Fos and Jun bind cooperatively to the AP-1 site: Reconstitution in vitro. Genes Dev. 1988;2:1687–1699. doi: 10.1101/gad.2.12b.1687. [DOI] [PubMed] [Google Scholar]
- 33.Hibi M, Lin A, Smeal T, Minden A, Karin M. Identification of an oncoprotein- and UV-responsive protein kinase that binds and potentiates the c-Jun activation domain. Genes Dev. 1993;7:2135–2148. doi: 10.1101/gad.7.11.2135. [DOI] [PubMed] [Google Scholar]
- 34.Dérijard B, et al. JNK1: A protein kinase stimulated by UV light and Ha-Ras that binds and phosphorylates the c-Jun activation domain. Cell. 1994;76:1025–1037. doi: 10.1016/0092-8674(94)90380-8. [DOI] [PubMed] [Google Scholar]
- 35.Hietakangas V, et al. Activation of the MKK4-JNK pathway during erythroid differentiation of K562 cells is inhibited by the heat shock factor 2-beta isoform. FEBS Lett. 2001;505:168–172. doi: 10.1016/s0014-5793(01)02810-1. [DOI] [PubMed] [Google Scholar]
- 36.Shanley TP, Vasi N, Denenberg A, Wong HR. The serine/threonine phosphatase, PP2A: Endogenous regulator of inflammatory cell signaling. J Immunol. 2001;166:966–972. doi: 10.4049/jimmunol.166.2.966. [DOI] [PubMed] [Google Scholar]
- 37.Anaya J. OncoLnc: Linking TCGA survival data to mRNAs, miRNAs, and lncRNAs. PeerJ Comput Sci. 2016;2:e67. [Google Scholar]
- 38.Berrien-Elliott MM, Romee R, Fehniger TA. Improving natural killer cell cancer immunotherapy. Curr Opin Organ Transplant. 2015;20:671–680. doi: 10.1097/MOT.0000000000000243. [DOI] [PMC free article] [PubMed] [Google Scholar]
- 39.Zlotnik A, Yoshie O. The chemokine superfamily revisited. Immunity. 2012;36:705–716. doi: 10.1016/j.immuni.2012.05.008. [DOI] [PMC free article] [PubMed] [Google Scholar]
- 40.Marçais A, et al. Cell-autonomous CCL5 transcription by memory CD8 T cells is regulated by IL-4. J Immunol. 2006;177:4451–4457. doi: 10.4049/jimmunol.177.7.4451. [DOI] [PubMed] [Google Scholar]
- 41.Soria G, et al. Mechanisms regulating the secretion of the promalignancy chemokine CCL5 by breast tumor cells: CCL5’s 40s loop and intracellular glycosaminoglycans. Neoplasia. 2012;14:1–19. doi: 10.1593/neo.111122. [DOI] [PMC free article] [PubMed] [Google Scholar]
- 42.Pakianathan DR, Kuta EG, Artis DR, Skelton NJ, Hébert CA. Distinct but overlapping epitopes for the interaction of a CC-chemokine with CCR1, CCR3 and CCR5. Biochemistry. 1997;36:9642–9648. doi: 10.1021/bi970593z. [DOI] [PubMed] [Google Scholar]
- 43.Velasco-Velázquez M, Xolalpa W, Pestell RG. The potential to target CCL5/CCR5 in breast cancer. Expert Opin Ther Targets. 2014;18:1265–1275. doi: 10.1517/14728222.2014.949238. [DOI] [PubMed] [Google Scholar]
- 44.Maghazachi AA, Al-Aoukaty A, Schall TJ. CC chemokines induce the generation of killer cells from CD56+ cells. Eur J Immunol. 1996;26:315–319. doi: 10.1002/eji.1830260207. [DOI] [PubMed] [Google Scholar]
- 45.Yoneda O, et al. Fractalkine-mediated endothelial cell injury by NK cells. J Immunol. 2000;164:4055–4062. doi: 10.4049/jimmunol.164.8.4055. [DOI] [PubMed] [Google Scholar]
- 46.Loetscher P, Seitz M, Clark-Lewis I, Baggiolini M, Moser B. Activation of NK cells by CC chemokines. Chemotaxis, Ca2+ mobilization, and enzyme release. J Immunol. 1996;156:322–327. [PubMed] [Google Scholar]
- 47.Taub DD, Sayers TJ, Carter CR, Ortaldo JR. Alpha and beta chemokines induce NK cell migration and enhance NK-mediated cytolysis. J Immunol. 1995;155:3877–3888. [PubMed] [Google Scholar]
- 48.Schall TJ, Bacon K, Toy KJ, Goeddel DV. Selective attraction of monocytes and T lymphocytes of the memory phenotype by cytokine RANTES. Nature. 1990;347:669–671. doi: 10.1038/347669a0. [DOI] [PubMed] [Google Scholar]
- 49.Long H, et al. Autocrine CCL5 signaling promotes invasion and migration of CD133+ ovarian cancer stem-like cells via NF-κB-mediated MMP-9 upregulation. Stem Cells. 2012;30:2309–2319. doi: 10.1002/stem.1194. [DOI] [PubMed] [Google Scholar]
- 50.Musti AM, Treier M, Bohmann D. Reduced ubiquitin-dependent degradation of c-Jun after phosphorylation by MAP kinases. Science. 1997;275:400–402. doi: 10.1126/science.275.5298.400. [DOI] [PubMed] [Google Scholar]
- 51.Smeal T, Hibi M, Karin M. Altering the specificity of signal transduction cascades: Positive regulation of c-Jun transcriptional activity by protein kinase A. EMBO J. 1994;13:6006–6010. doi: 10.1002/j.1460-2075.1994.tb06946.x. [DOI] [PMC free article] [PubMed] [Google Scholar]
- 52.Ishigami S, et al. Prognostic value of intratumoral natural killer cells in gastric carcinoma. Cancer. 2000;88:577–583. [PubMed] [Google Scholar]
- 53.Villegas FR, et al. Prognostic significance of tumor infiltrating natural killer cells subset CD57 in patients with squamous cell lung cancer. Lung Cancer. 2002;35:23–28. doi: 10.1016/s0169-5002(01)00292-6. [DOI] [PubMed] [Google Scholar]
- 54.Liu J, et al. Local production of the chemokines CCL5 and CXCL10 attracts CD8+ T lymphocytes into esophageal squamous cell carcinoma. Oncotarget. 2015;6:24978–24989. doi: 10.18632/oncotarget.4617. [DOI] [PMC free article] [PubMed] [Google Scholar]
- 55.Svensson S, et al. CCL2 and CCL5 are novel therapeutic targets for estrogen-dependent breast cancer. Clin Cancer Res. 2015;21:3794–3805. doi: 10.1158/1078-0432.CCR-15-0204. [DOI] [PubMed] [Google Scholar]
- 56.Halama N, et al. Tumoral immune cell exploitation in colorectal cancer metastases can be targeted effectively by anti-CCR5 therapy in cancer patients. Cancer Cell. 2016;29:587–601. doi: 10.1016/j.ccell.2016.03.005. [DOI] [PubMed] [Google Scholar]
- 57.Zumwalt TJ, Arnold M, Goel A, Boland CR. Active secretion of CXCL10 and CCL5 from colorectal cancer microenvironments associates with GranzymeB+ CD8+ T-cell infiltration. Oncotarget. 2015;6:2981–2991. doi: 10.18632/oncotarget.3205. [DOI] [PMC free article] [PubMed] [Google Scholar]
- 58.Dahlberg CI, Sarhan D, Chrobok M, Duru AD, Alici E. Natural killer cell-based therapies targeting cancer: Possible strategies to gain and sustain anti-tumor activity. Front Immunol. 2015;6:605. doi: 10.3389/fimmu.2015.00605. [DOI] [PMC free article] [PubMed] [Google Scholar]
- 59.Rabinovich GA, Gabrilovich D, Sotomayor EM. Immunosuppressive strategies that are mediated by tumor cells. Annu Rev Immunol. 2007;25:267–296. doi: 10.1146/annurev.immunol.25.022106.141609. [DOI] [PMC free article] [PubMed] [Google Scholar]


