Significance
To provide optimal host defense, the full spectrum of antibody-based immunity requires natural antibodies and immunization-induced antigen-specific antibodies. Here we show that the PTIP (Pax transactivation domain-interacting protein) chromatin regulator is induced by B cell activation to potentiate the establishment of steady-state and postimmune serum antibody levels. It does so by promoting activation-associated proliferation and differentiation of all the major B cell subsets, at least in part, through regulating the NF-κB pathway. With the genetic basis still unknown for a majority of patients with common variable immunodeficiency, further work investigating how PTIP controls cell signaling may generate valuable new insight for human health and disease.
Keywords: antibody, B cell biology, B-1, IgM, immunodeficiency
Abstract
B cell receptor signaling and downstream NF-κB activity are crucial for the maturation and functionality of all major B cell subsets, yet the molecular players in these signaling events are not fully understood. Here we use several genetically modified mouse models to demonstrate that expression of the multifunctional BRCT (BRCA1 C-terminal) domain-containing PTIP (Pax transactivation domain-interacting protein) chromatin regulator is controlled by B cell activation and potentiates steady-state and postimmune antibody production in vivo. By examining the effects of PTIP deficiency in mice at various ages during ontogeny, we demonstrate that PTIP promotes bone marrow B cell development as well as the neonatal establishment and subsequent long-term maintenance of self-reactive B-1 B cells. Furthermore, we find that PTIP is required for B cell receptor- and T:B interaction-induced proliferation, differentiation of follicular B cells during germinal center formation, and normal signaling through the classical NF-κB pathway. Together with the previously identified role for PTIP in promoting sterile transcription at the Igh locus, the present results establish PTIP as a licensing factor for humoral immunity that acts at several junctures of B lineage maturation and effector cell differentiation by controlling B cell activation.
The full spectrum of vertebrate humoral antibody immunity is made up of natural antibodies and postimmune antigen-specific antibodies (1). Natural antibodies are produced by innate-like B-1 cells enriched for reactivities to carbohydrate moieties found on common microbial pathogens as well as self-glycolipids and play an established role in immune surveillance and the clearance of cellular debris (2). Together with marginal zone (MZ) B cells, B-1 cells also mount rapid thymus-independent (TI) antibody responses against blood-borne pathogens and provide an important first line of defense during early stages of infection (3, 4). The far more prevalent follicular (FO) B-2 B cell subset, on the contrary, undergoes T-dependent (TD) affinity maturation and antibody class-switch recombination (CSR) in germinal centers (GCs) of secondary lymphoid organs to provide high-affinity IgG responses during the later stages of infection as well as immunological memory. Together, the different B cell subsets perform nonredundant functions to provide optimal host defense.
The PTIP protein is a ubiquitously expressed, nuclear-localized chromatin regulator containing six BRCT (BRCA1 C-terminal) domains. It has been described as an adaptor protein and is implicated in gene regulation, DNA replication, and DNA repair (5). Even though PTIP associates with the MLL3/MLL4 methyltransferase complex, it also has the capacity to function in gene expression independently from this complex (6) and in DNA repair with the 53BP1 protein (7). In B cells, PTIP is required for sterile transcription of switch regions at the Ig heavy-chain (Igh) locus and subsequent IgH CSR to multiple IgG isotypes in a manner independent from MLL3/MLL4 (6, 8, 9). Here we use mouse genetics to demonstrate that PTIP additionally establishes steady-state and postimmune IgM and IgG antibody production in vivo by regulating the development, activation, and survival of B cell subsets, at least in part, via the classical NF-κB signaling pathway.
Results
PTIP Is Required for Antibody Production in Vivo.
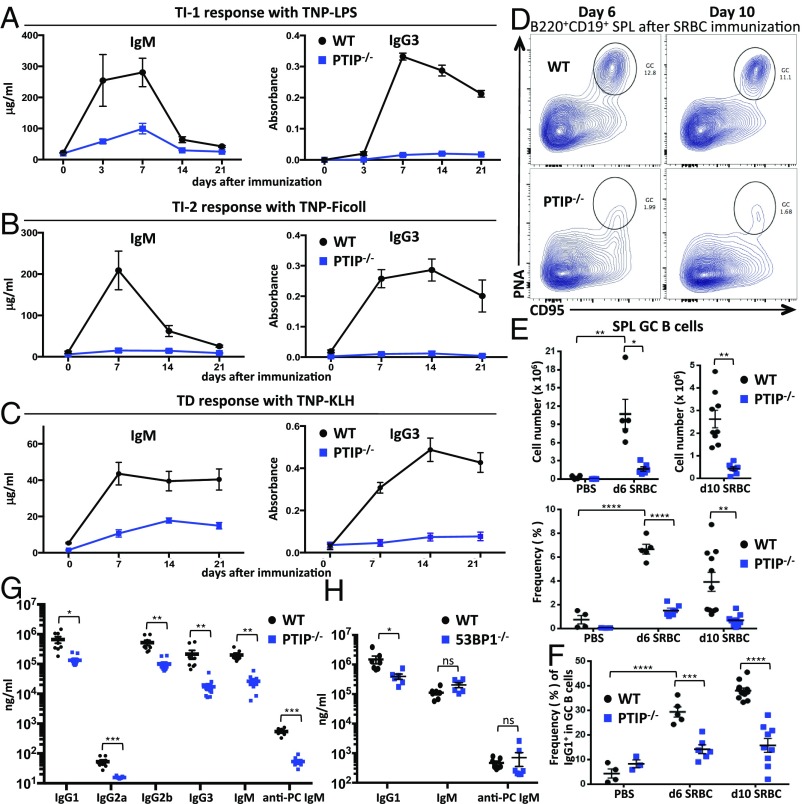
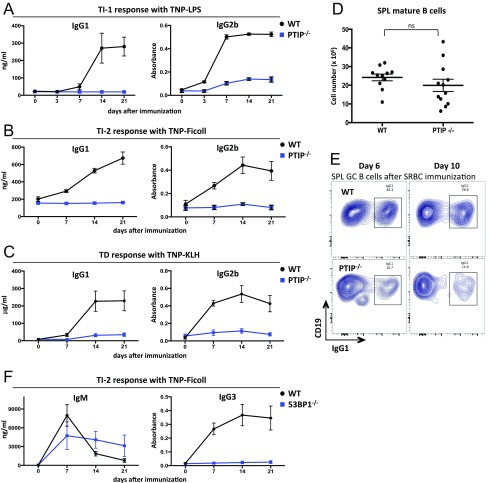
PTIP is known to facilitate IgH class-switching in stimulated B cells ex vivo (6, 8). To begin to determine the role of PTIP in antibody responses in vivo, we immunized CD19cre/+PTIPflox/flox (referred to here as PTIP−/−) mice and assayed antigen-specific antibody levels from serum over a 3-wk period. We used TNP-LPS as a TI type 1 antigen, TNP-Ficoll as a TI type 2 antigen, and TNP-KLH as a TD antigen. Serum from PTIP−/− mice harbored a near-complete block in the levels of TNP-specific IgG3 after immunization compared with CD19cre/+PTIP+/+ controls (referred to as WT) at 7 d postimmunization (Fig. 1 A–C, Right), in line with previous ex vivo findings (6, 8). IgG1 and IgG2b responses were similarly altered in PTIP−/− mice (Fig. S1 A–C). Interestingly, PTIP−/− mice showed impaired levels of TNP-specific IgM across the three different immunization schemes, ranging from 2.8- to 14-fold decreases at 7 d postimmunization, suggesting a physiological role beyond regulation of CSR (Fig. 1 A–C, Left). We conclude that PTIP promotes antigen-specific IgM and IgG responses in vivo, despite being largely dispensable for the development of most splenic B cells (8) (Fig. S1D).
Fig. 1.
PTIP is required for steady-state and antigen-induced antibody production in vivo. Mice were immunized with (A) TNP-LPS, (B) TNP-Ficoll, or (C) TNP-KLH, and anti-TNP-specific IgM or IgG3 serum levels were measured by ELISA at the indicated days before and after immunization. Data are from four mice of each genotype in A, four mice in B, and seven mice in C, and are plotted as Ig concentration or the absorbance for the serum dilution that gave half optical density (mean ± SEM). Experiments were repeated at least two times. P values at 7 d after immunization are as follows: (A) IgM, *P = 0.03; IgG3, ****P < 0.0001; (B) IgM, *P = 0.02; IgG3, ***P = 0.0003; (C) IgM, ***P = 0.001; IgG3, ****P < 0.0001. (D) Flow cytometric analysis of GC B cells in the spleen at the indicated days after immunization with SRBCs. (E) GC B cell numbers (Top) and frequencies (Bottom) from spleens (as in D) of at least three mice with PBS, five mice at 6 d, and nine mice at 10 d per genotype postimmunization. Data are presented as mean ± SEM. (Top) Day 6, *P = 0.02; day 10, **P = 0.003; PBS vs. day 6 in WT, **P = 0.001. (Bottom) Day 6, ****P < 0.0001; day 10, **P = 0.002; PBS vs. day 6 in WT, ****P < 0.0001. (F) Flow cytometric analyses of IgG1+ frequencies among GC B cells as in D. Data are presented as mean ± SEM. Day 6, ***P = 0.0005; day 10, ****P < 0.0001; PBS vs. day 6 in WT, ****P < 0.0001. (G) ELISA analysis of total Ig levels from sera of unimmunized mice. Data are from at least six mice of each genotype and are presented as mean ± SEM. IgG1, *P = 0.015; IgG2a, ***P = 0.001; IgG2b, **P = 0.005; IgG3, **P = 0.004; IgM, **P = 0.002; anti-PC IgM, ***P = 0.0006. (H) ELISA analysis of total Ig levels from sera of unimmunized mice. Data are from at least six mice of each genotype and are presented as mean ± SEM. IgG1, *P = 0.046; others not significant (ns). Statistics were generated by using a two-tailed unpaired t test with Welch’s correction.
Fig. S1.
Mice were immunized with (A) TNP-LPS, (B and F) TNP-Ficoll, or (C) TNP-KLH, and the indicated anti-TNP-specific serum antibody levels were measured by ELISA at the indicated days before and after immunization. Data are from four mice of each genotype in A, B, and F and seven mice in C and are plotted as Ig concentration or absorbance for the serum dilution that yielded half optical density (mean ± SEM). Experiments except in F were repeated at least two times. P values at 7 d after immunization are as follows: (A) IgG2b, ****P < 0.0001; (B) IgG1, *P = 0.013; IgG2b, **P = 0.002; (C) IgG1, *P = 0.03; IgG2b, ****P < 0.0001; (F) IgM, P = 0.4 [not significant (ns)]; IgG3, *P = 0.016. In A, P value for IgG1 is P = 0.017 (asterisk) at 21 d after immunization. (D) Cell numbers of CD19+B220+CD93− mature B cells in spleens from at least 11 mice of each genotype. Data are presented as mean [P = 0.27, not significant (ns)]. Statistics were performed by using a two-tailed unpaired t test with Welch’s correction. (E) Flow cytometric analysis of antigen-induced splenic GC B cells harvested from mice 6 and 10 d after SRBC immunization. Data demonstrate impaired IgG1 class-switching among GC B cells in PTIP−/− mice. Data representative of multiple mice.
In view of the profound impairments in antibody responses to TI and TD antigens in PTIP-deficient mice, we examined GC formation in these mice. Mice were immunized with the TD antigen sheep red blood cells (SRBCs) and GC B cells were assayed from spleens. At 6 and 10 d postimmunization, PTIP−/− mice displayed severely impaired frequencies and numbers of GC (CD19+B220+PNA+CD95+) B cells compared with control mice (Fig. 1 D and E). Consistent with IgG1 class-switching defects associated with PTIP deficiency (6, 8) (Fig. S1 A–C), IgG1+ frequencies were also impaired among GC B cells in SRBC-immunized PTIP−/− mice compared with controls (Fig. 1F and Fig. S1E). We conclude that PTIP promotes TD GC B cell differentiation after immunization in vivo.
To determine antibody levels at steady state, we analyzed serum from unimmunized animals. We found that PTIP−/− mice displayed a 7.6-fold decrease in serum IgM levels in addition to severely reduced IgG1, IgG2a, IgG2b, and IgG3 levels (Fig. 1G). At steady state, IgM antibodies are highly enriched for specificities against carbohydrate moieties such as phosphorylcholine (PC) and serve an important function in immune surveillance and the removal of cellular debris (2). To determine whether the decrease in steady-state serum IgM levels from PTIP−/− mice was linked to a deficiency in such protective natural antibodies, we measured PC-specific IgM titers and observed a 10-fold decrease (Fig. 1G). Thus, PTIP critically potentiates steady-state and postimmune levels of IgM and IgG antibodies in vivo.
PTIP harbors DNA repair functions that are, at least in part, mediated by its physical association with 53BP1 (7); however, consistent with other reports (10, 11), we found decreased IgG1 but normal total IgM in the serum of 53BP1−/− mice (Fig. 1H). In addition, PC-specific IgM levels from 53BP1−/− mice were indistinguishable from those from controls (Fig. 1H). Furthermore, even though antigen-specific IgG3 levels were severely impaired upon challenging 53BP1−/− mice with the TI type 2 TNP-Ficoll antigen, we found antigen-specific IgM to be indistinguishable vs. controls (Fig. S1F). These results suggest that PTIP promotes natural and antigen-induced IgM levels independently from its association with 53BP1 and its involvement in DNA repair.
PTIP Deficiency Causes a Partial Block in B Cell Development.
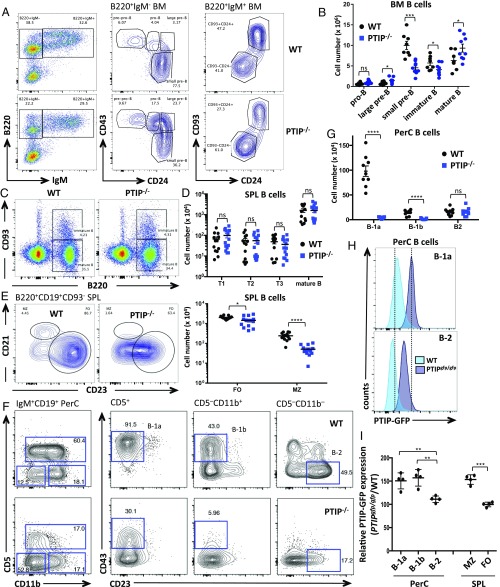
To begin to investigate the underlying cause for such profound immunodeficiency, we analyzed the B cell compartments in unperturbed PTIP−/− mice. Bone marrow from PTIP−/− and control mice was first analyzed to ascertain whether loss of PTIP affects B cell development. Although no differences were observed in pro-B (CD93+B220+CD19+IgM−CD43+CD24med) cells, numbers of small pre-B (CD93+B220+CD19+IgM−CD43−CD24+) cells were decreased 2.2-fold in PTIP−/− bone marrow compared with controls, along with a subtle 1.4-fold decrease in immature (CD93+B220+CD19+IgM+CD24+) B cells (Fig. 2 A and B). Numbers of large pre-B (CD93+B220+CD19+IgM−CD43+CD24hi) cells and mature (CD93−B220+CD19+IgM+CD24−) B cells in the bone marrow were concomitantly increased 1.9-fold and 1.5-fold, respectively, comparable to controls (Fig. 2 A and B). We conclude that loss of PTIP leads to a mild B cell development defect marked by an inefficient transition of large cycling pre-B cells to small quiescent pre-B cells at a developmental time when Ig light-chain rearrangement is initiated in response to pre-B cell receptor (BCR) signaling.
Fig. 2.
PTIP deficiency causes a partial block in B cell development and impairs establishment of innate-like B cell subsets. (A) Flow cytometric analysis of bone marrow cells from adult mice. (B) Numbers of developing B cells from bone marrow of at least eight mice per genotype. Data are presented as mean ± SEM. Large pre-B, *P = 0.02; small pre-B, ***P = 0.0006; immature B, *P = 0.05; mature B, *P = 0.03; pro-B, P = 0.08 [not significant (ns)]. (C–E) Flow cytometric analyses of splenic B cells from adult mice. (D) B cell numbers from spleens as in C and E from at least 13 mice. Data are presented as mean ± SEM. (Top) P > 0.3 for all comparisons, which is not significant (ns). (Bottom) FO, *P = 0.028; MZ, ****P < 0.0001. (F) Flow cytometric analyses of peritoneal cavity B cells from adult mice. (G) B cell numbers from peritoneal cavities as in F from at least nine mice of each genotype. Data are presented as mean ± SEM. B-1a and B-1b, ****P < 0.0001; B-2, P = 0.9, which is not significant (ns). (H) Flow cytometric analysis of PTIP-GFP expression in freshly isolated peritoneal cavity B cells. (I) Mean PTIP-GFP expression intensities from B cells as in H relative to WT controls from four mice. PerC, B-2 vs. B-1b, **P = 0.009; B-2 vs. B-1a, **P = 0.01; SPL, FO vs. MZ, ***P = 0.0005. Statistics were performed by using a two-tailed unpaired t test with Welch’s correction.
PTIP Deficiency Impairs Establishment of Innate-Like B Cells.
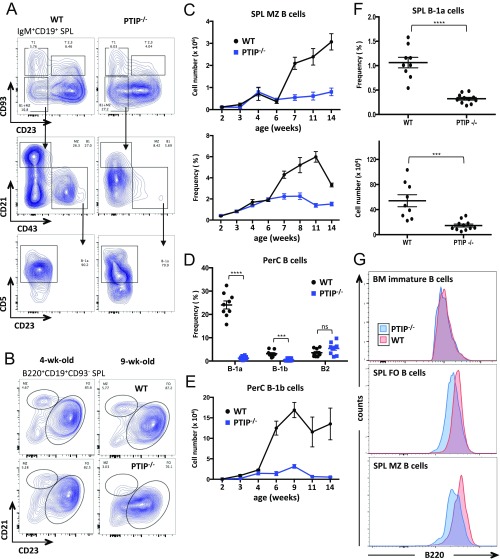
Spleens from PTIP−/− mice showed similar frequencies and numbers of transitional (CD93+B220+) and mature (CD93−B220+) B cells vs. control animals (Fig. 2 C and D), yet displayed a subtle 1.4-fold decrease in FO B cells (Fig. 2 D and E). In contrast, we observed a 4.7-fold decrease in the number of MZ B cells from PTIP−/− mice (Fig. 2 D and E and Fig. S2 A–C). This observation is intriguing, as MZ B cells contribute to TI IgM production (3) and share with B-1 B cells a stronger dependency on BCR-mediated signals for maturation and maintenance (3, 12, 13).
Fig. S2.
(A) Flow cytometric analyses of splenic B cells highlighting MZ and B-1a B cell gates. Representative of multiple mice. (B) Flow cytometric analyses of splenic B cells from mice at the indicated ages highlighting the MZ and FO B cell gates. Representatives of multiple mice. (C) MZ B cell numbers (Top) and frequencies (Bottom) as in B at the indicated age (in weeks) during development. Data are from at least three mice of each age and genotype and are presented as mean ± SEM. Cell numbers at 7 wk, *P = 0.016; cell frequencies at 7 wk, **P = 0.0016. (D) Flow cytometric analyses of B cell frequencies from peritoneal cavities of at least nine mice of each genotype. Data are presented as mean ± SEM. B-1a, ****P < 0.0001; B-1b, ***P = 0.0003; B-2, P = 0.08 [not significant (ns)]. (E) B-1b cell numbers at the indicated age (in weeks) after birth. Data are from at least three mice of each age and genotype and are represented as mean ± SEM. B-1b cell numbers at 6 wk (*P = 0.017). (F) B-1a cell frequencies (Top) and numbers (Bottom) from spleens as in A from at least nine mice for each genotype. Data are presented as mean ± SEM. Cell frequencies, ****P < 0.0001); cell numbers, ***P = 0.003. (G) Flow cytometric analyses of cell surface B220 expression on the indicated bone marrow and splenic B cell subsets from adult mice. Data representative of multiple mice. Statistics were obtained (C–F) by using a two-tailed unpaired t test with Welch’s correction.
B-1 B cells largely reside in the peritoneal cavity and, in mice, are divided into the CD5+ B-1a subset, which preferentially mature during fetal and neonatal life, and the continuously replenished CD5− B-1b subset. To determine whether the defect in natural IgM production in PTIP−/− mice might be explained by PTIP regulation of B-1 B cells, we analyzed peritoneal cavity cells from PTIP−/− and control mice by FACS. Among CD19+IgM+ peritoneal cavity B cells, we observed severe reductions in the frequencies and numbers of B-1a and B-1b cells (Fig. 2 F and G and Fig. S2 D and E). Specifically, B-1a (CD19+IgM+CD5+CD43+CD23−) cells were nearly absent and B-1b (CD19+IgM+CD5−CD43+CD11b+CD23−) cell numbers were decreased by 9.6-fold compared with control mice (Fig. 2G). In stark contrast, the numbers of conventional B (CD19+IgM+CD5−CD43−CD11b−CD23+) cells in the peritoneal cavity were indistinguishable vs. control mice (Fig. 2G). A similar decrease in B-1a cell numbers was observed in the spleen (Fig. S2 A and F). Residual PTIP−/− B-1a and B-1b cells exhibited alterations in their surface phenotype, including lower expression levels of CD43 and CD11b (Fig. 2F); moreover, surface expression of B220 (Fig. 2 A and C and Fig. S2G) and CD23 (Fig. 2 E and F and Fig. S2B) were lower on conventional B cells from PTIP−/− mice compared with controls. We conclude that PTIP promotes the generation and/or maintenance of innate-like B-1a and B-1b cells in unperturbed mice. Our observation of the concomitant decrease in B-1 and MZ B cell populations in PTIP−/− mice likely explains the observed impairment in steady-state as well as antigen-induced IgM production (Fig. 1).
To better understand the requirement for PTIP protein in various B cell subsets, we measured PTIP expression at the single-cell level by using a previously described knock-in mouse model that expresses GFP-tagged PTIP under the control of its endogenous regulatory elements (PTIPgfp/gfp) (6). Interestingly, PTIP-GFP protein levels were higher in the B-1a, B-1b, and MZ B cell populations compared with conventional B-2 cells (Fig. 2 H and I). Together with the GC defects, these results from innate-like B cells are consistent with a functional requirement for PTIP in cells that have a strong dependency on BCR-mediated signals for maturation and maintenance.
PTIP Is Required for Neonatal B Cell Maturation.
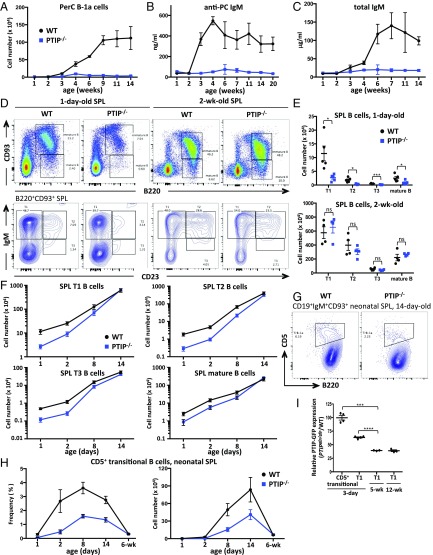
With B cell development in the bone marrow only being mildly reduced, possibly leading to a slower establishment of mature conventional B cell pools, the profound loss of B-1 cells and natural IgM in mice lacking PTIP remained curious. To better understand the reason for such immunodeficiency, we further investigated B-1a cell maturation in greater detail. Shortly after birth, rapid accumulation of B-1a cells in the peritoneal cavity (Fig. 3A) coincides with the increase in total and PC-specific serum IgM levels, as seen in 3-wk-old WT mice (Fig. 3 B and C). Strikingly, only a negligible increase in B-1a cell numbers are found in PTIP−/− peritoneal cavities throughout ontogeny, and natural antibody titers remain flat-lined (Fig. 3 A–C and Fig. S3A).
Fig. 3.
PTIP is required for neonatal B cell maturation and the establishment of serum natural IgM levels. (A) B-1a cell numbers at the indicated age (in weeks) after birth. Data are from at least three mice for each age and genotype and are represented as mean ± SEM. (B and C) ELISA analysis of anti-PC IgM (B) and total IgM (C) levels from sera of unimmunized mice at the indicated age (in weeks) after birth. Data are from at least three mice for each age and genotype and are represented as mean ± SEM. At 3 wk, **P = 0.008 for A and **P = 0.01 for B. At 4 wk, **P = 0.009 for C. (D–F) Flow cytometric analyses and cell numbers of splenic B cells at the indicated ages with at least four mice of each genotype per age. Data are presented as mean ± SEM. (E, Top) For 1 d old, T1 (*P = 0.029), T2 (*P = 0.012), T3 (***P = 0.002), and mature B cells (*P = 0.04); (E, Bottom) for 2 wk old, P > 0.3 for all comparisons, which is not significant (ns). (F) For 2 d old, T1 (*P = 0.02), T2 (*P = 0.02), T3 (*P = 0.025), and mature B cells (*P = 0.05). (G) Flow cytometric analysis of neonatal CD93+ immature splenic B cells. A representative of 14-d-old mice. (H) Transitional B-1a cell frequencies (Left) and numbers (Right) from neonatal spleens as in G. Data are from at least three mice of each genotype and are presented as mean ± SEM. Cell frequency at 1 d (*P = 0.019); cell numbers at 1 d (*P = 0.019). (I) Flow cytometric mean PTIP-GFP expression intensities relative to WT controls on freshly isolated splenic transitional B cells at the indicated ages from at least three mice. Three-day CD5+ transitional vs. 5-wk T1 (***P = 0.0007), 3-d T1 vs. 5-wk T1 (****P < 0.0001). Statistics were performed by using a two-tailed unpaired t test with Welch’s correction.
Fig. S3.
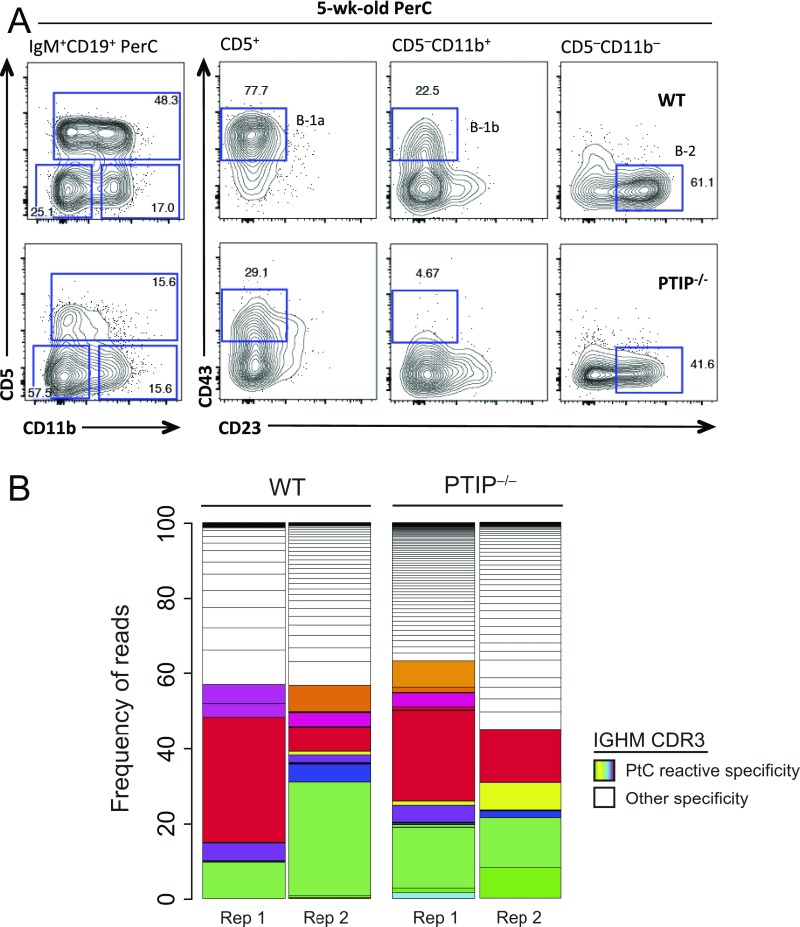
(A) Flow cytometric analyses of peritoneal cavity B cells from 5-wk-old mice as used for VDJ-Seq and microarray analysis. Representatives of multiple mice. (B) Stacked bar graphs illustrate frequencies of individual CDR3 specificities in the peritoneal B-1a population of 5-wk-old mice. CDR3 clonotypes are defined through VDJ-Seq transcript analysis of the Igh-μ locus and mapped to a reference library of PtC-reactive CDR3 clones. Uniquely color-coded segments indicate different PtC-reactive CDR3s. Two representative mice of each genotype are shown.
B-1a cells are not efficiently generated in adult life and sustain their peripheral presence through bone marrow-independent self-maintenance (14). To assess if a maturation defect could contribute to the observed decrease in B-1a cell representation in PTIP-deficient mice, we analyzed transitional B cells from spleens of neonatal mice known to efficiently give rise to B-1a B cells (15). Compared with controls, spleens from 1-d-old neonatal PTIP−/− mice showed decreased frequencies of transitional (CD93+B220+) B cells, including lower cell numbers of the three distinct transitional stages: T1 (CD93+B220+IgM+CD23−), T2 (CD93+B220+IgM+CD23+), and T3 (CD93+B220+IgMloCD23−; Fig. 3 D and E). Similar results were obtained for mature (CD93−B220+) B cells, and results were also similar at 2 d of age (Fig. 3 D–F). Remarkably, by 2 wk of age and later in adult mice as described earlier (Fig. 2 C and D), these splenic B cell maturation defects were no longer apparent (Fig. 3 D–F). A developmentally restricted neonatal CD5+ transitional B cell subset (CD19+CD93+B220loIgM+CD5+) was recently identified that predominantly gives rise to B-1a cells (16). We readily detected the transient developmental wave of such CD5+ transitional B cells in 2-d- to 2-wk-old control mice; however, consistent with a defect in B-1a cell development, the percentage and absolute number of CD5+ transitional B cells showed a marked decrease in the absence of PTIP (Fig. 3 G and H). Moreover, PTIPgfp/gfp mice showed higher PTIP protein levels in transitional B cells from 3-d-old mice compared with mice at 5 or 12 wk of age (Fig. 3I), coinciding with the peak of B-1a cell output during ontogeny. These results collectively demonstrate a reliance on high PTIP expression during neonatal B lymphopoiesis, consistent with a requirement for PTIP for the output of B-1a cells and natural IgM levels.
PTIP-Deficient B-1a Cells Are Unable to Maintain Long-Term Survival of Self-Reactive Clones.
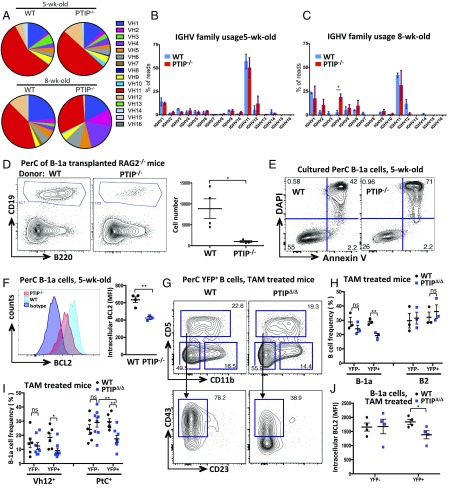
B-1a cells are enriched for self-reactive specificities and rely mainly on self-antigen driven survival to maintain their peripheral population through life (12). The most common BCR specificity among B-1a cells is directed toward the self-glycolipid phosphatidylcholine (PtC) (17, 18) exposed on the surface of damaged cells. In light of the observed defects in neonatal B-1a cell development, we sought to understand whether the failure of B-1a cells to accumulate and establish a sizable population in PTIP-deficient mice is a consequence of an inability to produce a self-reactive BCR repertoire. To this end, we performed high-throughput Igh-μ repertoire analysis by (variable, diversity, joining) deep sequencing (VDJ-Seq) of the residual peritoneal cavity B-1a cell populations in 5- and 8-wk-old PTIP−/− mice (as shown in Fig. 2F and Fig. S3A). Upon extraction of the identities and frequencies of CDR3 clonotypes, we found the B-1a repertoire of 5-wk-old PTIP−/− mice to harbor comparable frequencies of PtC-reactive CDR3s vs. age-matched controls (Fig. 4 A and B and Fig. S3B). This result demonstrates that bona fide B-1a specificities can be generated in the absence of PTIP. Strikingly, the representation of this specificity is markedly decreased in 8-wk-old PTIP−/− mice, evident by a trend toward decreased usage of the VH12 segment known to encode the PtC specificity and an increased usage of VH4 (Fig. 4 A–C). Thus, although PTIP-deficient mice can successfully generate a small number of B-1a cells with the appropriate self-reactive BCR specificities, these clones fail to be maintained through self-antigen driven positive selection. Thus, the apparent lack of B-1a cells in adult PTIP−/− mice may be a compound effect from defects in B-1a cell maturation (Fig. 3) and peripheral maintenance.
Fig. 4.
PTIP-deficient B-1a cells are unable to maintain long-term survival of self-reactive clones. (A) Usage frequencies of the indicated BCR IgM heavy-chain V-segment families (IGHV) in the peritoneal B-1a population of 5- and 8-wk-old mice. Data are from at least three mice for each age and genotype and are presented as means. (B and C) V-family usage frequencies of the indicated IgM VH gene segments (IGHV) in sorted B-1a cells from (B) 5-wk-old and (C) 8-wk-old mice (*P = 0.03). Data are from at least three mice for each age and genotype and are presented as mean ± SEM. (D, Left) Flow cytometric analysis of B cells from peritoneal cavity of RAG1−/− 2 wk after transplantation of FACS sorted B-1a cells. A total of 40,000 WT or PTIP−/− FACS-sorted B-1a cells were injected i.p. into recipient RAG1−/− mice. (D, Right) B cell numbers from peritoneal cavities from at least three transplanted mice for each genotype. Data are presented as means (*P = 0.04). (E) Flow cytometric analysis of cultured B-1a cells from peritoneal cavity to assess survival after 48 h. Sorted B-1a cells were pooled from at least five mice of each genotype. (F) Flow cytometric analysis of BCL2 intracellular expression in B-1a cells from peritoneal cavities of 5-wk-old mice. (Left) Representative plot and (Right) mean expression intensities from at least three mice of each genotype (**P = 0.004). (G) Flow cytometric analysis of peritoneal cavity YFP+ IgM+CD19+ B cells from mice 4 wk after TAM administration. (Bottom) Skewing of CD43 expression on CD5+ B-1a cells in the mutant. Representative from multiple mice. Note the labeling of the PTIPΔ/Δ genotype, abbreviated from Cre-ERT2+Rosa26YFP/YFPPTIPflox/flox, in which YFP is expressed (as a marker of Cre recombinase expression) upon TAM administration to the mice. WT mice have genotype Cre-ERT2+Rosa26YFP/YFPPTIP+/+ and were administered TAM in parallel (statistics are shown in Fig. S4). (H) B cell frequencies within the YFP gate from peritoneal cavities of three mice of each genotype 1 wk after TAM administration. Data are presented as mean ± SEM. YFP+ B-1a, PTIPΔ/Δ vs. WT [**P = 0.008; for other comparisons, P > 0.05, not significant (ns)]. (I) B-1a cell frequencies within the YFP gate displaying reactivity to Vh12 (Left) or PtC liposomes (Right) from peritoneal cavities from at least six mice of each genotype 4 wk after TAM administration. Data are presented as mean ± SEM. YFP+ Vh12+, PTIPΔ/Δ vs. WT (*P = 0.029); YFP− Vh12+, PTIPΔ/Δ vs. WT [P = 0.6, not significant (ns)]. YFP+ PtC liposome+, PTIPΔ/Δ vs. WT (**P = 0.003); PTIPΔ/Δ PtC liposome+, YFP+ vs. YFP− (**P = 0.01); YFP− PtC liposome+, PTIPΔ/Δ vs. WT [P = 0.3, not significant (ns)]. (J) Mean BCL2 intracellular expression intensities in peritoneal cavity B-1a cells from four mice of each genotype 4 wk after TAM administration. YFP+, PTIPΔ/Δ vs. WT (*P = 0.04). Data representative of two independent experiments. Statistics were obtained by using a two-tailed unpaired t test with Welch’s correction.
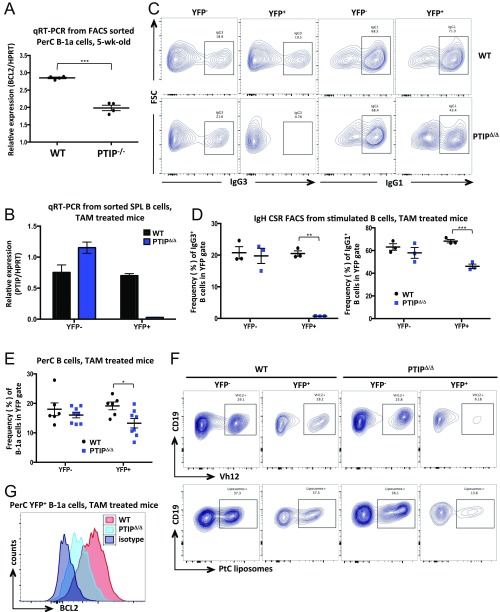
To establish a direct role of PTIP in mature B-1a cell survival and maintenance in vivo without the influence of bone marrow influx, we FACS sorted PTIP−/− and control B-1a cells from 5-wk-old mice and transplanted equal numbers intraperitoneally into RAG1−/− recipient mice. Two weeks after transplantation, markedly fewer B cells remained in recipients of PTIP−/− cells compared with controls (Fig. 4D). This survival defect could be recapitulated upon in vitro culturing in media, in which PTIP−/− B-1a cells from 5-wk-old mice were found to have a reduced frequency of live Annexin V−DAPI− cells after 48 h (Fig. 4E). Consistent with these results, we measured the expression of the antiapoptotic BCL2 gene and found it to be significantly reduced at the mRNA and protein levels in PTIP−/− B-1a cells compared with controls (Fig. 4F and Fig. S4A). We conclude that PTIP promotes B-1a cell survival and is associated with increased BCL2 expression.
Fig. S4.
(A) Quantitative real-time PCR analysis of BCL2 expression from FACS-sorted peritoneal cavity B-1a cells of 5-wk-old mice. Data are from a single sorting experiment with four mice of each genotype and are presented as mean ± SEM (***P = 0.0009). (B) Quantitative real-time PCR analysis of PTIP expression in splenic B cells FACS-sorted on YFP expression from mice 6 wk after TAM administration, indicating efficient PTIP deletion in YFP+ populations. Data are from a single sorting experiment with four mice of each genotype and are presented as mean ± SEM. (C) Flow cytometric analysis of splenic B cells harvested from mice 1 wk after TAM administration and stimulated to undergo IgG3 (Left) or IgG1 (Right) class-switching for 4 d. Data demonstrate impaired IgH class-switching in YFP+ cells from PTIPΔ/Δ mice and indicate efficient PTIP deletion in YFP+ populations. Data representative of multiple mice. (D) IgG3+ (Left) and IgG1+ (Right) frequencies from stimulated B cells as in C from three mice of each genotype. Data are presented as mean ± SEM. YFP+PTIPΔ/Δ vs. WT, IgG3 (**P = 0.0018), IgG1 (***P = 0.001). (E) B-1a cell frequencies from peritoneal cavities of at least six mice of each genotype 4 wk after TAM administration. Data are presented as mean ± SEM. YFP+, PTIPΔ/Δ vs. WT (*P = 0.014). (F) Flow cytometric analysis of B-1a cell frequencies displaying reactivity to Vh12 (Top) or PtC liposomes (Bottom) from peritoneal cavities 4 wk after TAM administration. Representatives of multiple mice. (G) Flow cytometric analyses of BCL2 intracellular expression in YFP+ B-1a cells from peritoneal cavities 4 wk after TAM administration. Data representative of multiple mice in two independent experiments.
To formally rule out any developmental influence on B-1a cell survival, we crossed PTIPflox/flox mice with a mouse strain expressing tamoxifen (TAM)-inducible Cre-ERT2 to assess the effects of TAM-induced deletion of PTIP expression. In adult mice, bone marrow-dependent influx into the B-1a compartment is low; therefore, any observed phenotypes in the immediate weeks following TAM treatment of adult mice can be attributed to changes in the functionality of mature B-1a cells rather than developmental consequences. To visualize the frequency of Cre recombinase-expressing cells in these mice, we crossed in the Rosa26-stop-YFP Cre-reporter allele to generate Cre-ERT2+Rosa26YFP/YFPPTIPflox/flox (herein referred to as PTIPΔ/Δ) and control mice (Cre-ERT2+Rosa26YFP/YFPPTIP+/+, herein referred to as WT). Upon validating efficient Cre-mediated deletion (Fig. S4 B–D), we observed that several in vivo phenotypes of PTIP−/− mice were also recapitulated following inducible PTIP deletion. First, a significant decrease in the frequency of B-1a but not B-2 B cells could be observed among YFP+ peritoneal cavity cells of PTIPΔ/Δ mice after TAM administration (Fig. 4 G and H and Fig. S4E). Second, within the B-1a cell gate, frequencies of VH12+ and PtC liposome+ cells were decreased in YFP+ cells of PTIPΔ/Δ mice (Fig. 4I and Fig. S4F), consistent with PTIP being required for self-antigen driven peripheral maintenance (Fig. 4 A–C). Finally, YFP+ B-1a cells from treated PTIPΔ/Δ mice displayed decreased BCL2 expression compared with controls (Fig. 4J and Fig. S4G). Taken together, these results formally establish a crucial role for PTIP in the survival of adult B-1a cells that is distinct from any developmental effects of PTIP deficiency.
PTIP Is Required for B Cell Activation via the NF-κB Pathway.
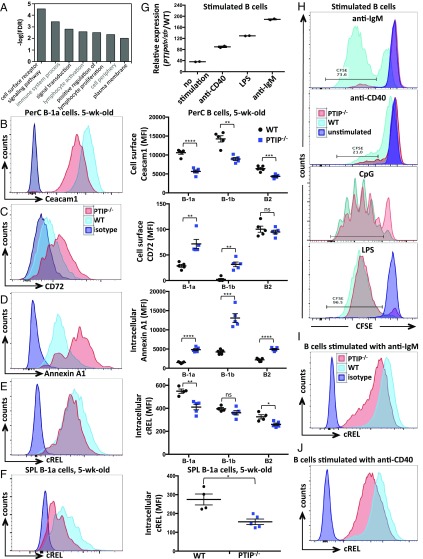
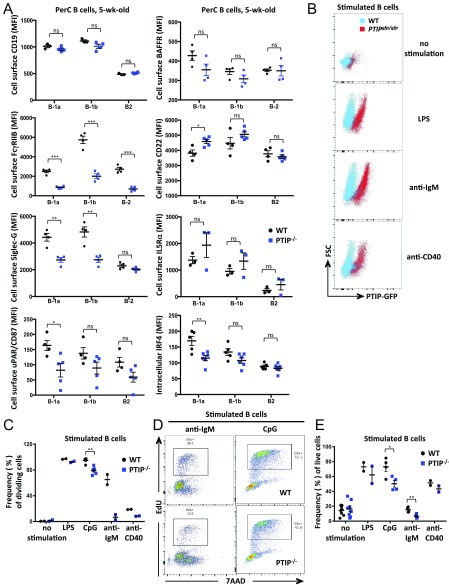
To elucidate the molecular function of PTIP, we subjected sorted B-1a cells from 5-wk-old PTIP−/− and control animals to microarray-based global analyses of gene expression changes. In total, PTIP-deficient B-1a cells revealed 137 genes whose expression was down-regulated and 78 genes whose expression was up-regulated by at least twofold (Dataset S1). Interestingly, many differentially expressed genes were associated with signal transduction in the immune system, indicative of a role for PTIP in regulating signaling events (Fig. 5A). To further investigate this notion, we screened for the expression of a panel of proteins known to play a role in B-1a cell signaling by FACS. Although many of these did not change (CD19, BAFFR, and IL5RA; Fig. S5A), a few notable proteins were differentially expressed in the absence of PTIP. These include decreased Ceacam1/CD66a (Fig. 5B) and FcγRIIB (Fig. S5A), which were identified by the microarray, as well as increased CD72 (Fig. 5C) and CD22, and decreased CD43 and Siglec-G (Fig. S5A). Notably, Ceacam1 promotes signaling through the canonical NF-κB pathway (19), whereas CD72 can oppose it (20). Furthermore, the microarray identified an increase in the mRNA levels of Anxa1, encoding Annexin A1, a negative regulator of canonical NF-κB signaling (21, 22) (Dataset S1). Increased Annexin A1 was validated at the protein level by intracellular FACS in B-1a, B-1b, and B-2 B cells (Fig. 5D). These findings are intriguing in lieu of the crucial role of the NF-κB pathway in promoting B-1 and MZ B cell development as well as B cell survival through the regulation of Bcl2 family members (23, 24). To further investigate a potential role of PTIP in NF-κB signaling, we measured the expression of NF-κB proteins in freshly isolated PTIP−/− B-1a cells from 5-wk-old mice. These analyses revealed decreased intracellular levels of cREL (Fig. 5 E and F) along with NF-κB targets urokinase plasminogen activator (uPA) and IRF4 (Fig. S5A), suggesting that the absence of PTIP may perturb the classical NF-κB pathway and thereby lead to the observed impairments in the B-1 population.
Fig. 5.
PTIP is required for B cell activation via the NF-κB pathway. (A) Canonical pathways and biological processes overrepresented in the genes deregulated from microarray analysis of PTIP−/− relative to control-sorted B-1a cells from 5-wk-old mice. (B–E) Flow cytometric analysis of Ceacam1 (B) and CD72 (C) surface expression and Annexin A1 (D) and cREL (E) intracellular expression in B cells from peritoneal cavities of 5-wk-old mice. (Left) A representative plot from B-1a cells. (Right) Mean expression intensities in peritoneal cavity B cells from at least four mice of each genotype. (B) B-1a (****P < 0.0001); B-1b (**P = 0.002); B-2 (***P = 0.001). (C) B-1a (**P = 0.007); B-1b (**P = 0.002); B-2 [P = 0.47, not significant (ns)]. (D) B-1a (****P = 0.0001); B-1b (***P = 0.001); and B-2 (****P < 0.0001). (E) B-1a (**P = 0.003); B-1b [P = 0.16, not significant (ns)]; B-2 (*P = 0.03). (F) Flow cytometric analysis of cREL intracellular expression in B-1a cells from spleens of 5-wk-old mice. (Left) Representative plot. (Right) Mean expression intensities in splenic B cells from four mice of each genotype (*P = 0.018). Statistics were obtained by using a two-tailed unpaired t test with Welch’s correction. (G) Flow cytometric mean PTIP-GFP expression intensities in splenic B cells relative to WT controls from two adult mice after 3 d of the indicated stimulation. (H) Flow cytometric analysis of CFSE-labeled splenic B cells with or without the indicated stimulation for 3 d. (I) Flow cytometric analysis of cREL intracellular expression in splenic B cells stimulated with anti-IgM for 18 h. (J) Flow cytometric analysis of cREL intracellular expression in splenic B cells stimulated with anti-CD40 for 24 h. (H–J) Representatives from multiple mice 7–8 wk of age, with statistics shown in Fig. S5.
Fig. S5.
(A) Flow cytometric analyses of mean expression intensities for the indicated cell surface or intracellular proteins in peritoneal cavity B cells from 5-wk-old mice. Data are from at least three mice of each genotype. FcγRIIB: B-1a, ***P = 0.0002; B-1b, ***P = 0.0004; B-2, ***P = 0.0003. CD22: B-1a, *P = 0.025. Siglec-G: B-1a, **P = 0.004; B-1b, **P = 0.006. uPA receptor (uPAR): B-1a, *P = 0.022. IRF4: B-1a, **P = 0.007; P < 0.05 for other indicated comparisons; others show P > 0.05, which is not significant (ns). (B) Flow cytometric analysis of PTIP-GFP expression in splenic B cells from adult mice with or without the indicated stimulation for 3 d. (C) Flow cytometric analyses of splenic B cells after the indicated stimulation for 3 d showing frequencies of dividing cells. Data are from six mice of each genotype for CpG and two mice of each genotype for other stimulations. CpG, **P = 0.0003. (D) Flow cytometric analysis of EdU incorporation in splenic B cells stimulated with anti-IgM or CpG after 3 d indicating reduced frequency of cells in S phase. Representatives from multiple mice. (E) Flow cytometric analyses of splenic B cells after the indicated stimulation for 3 d showing frequencies of live cells. Data are from at least two mice of each genotype. CpG, *P = 0.03; anti-IgM, **P = 0.01. (C–E) Mice used were 7–8 wk of age. Statistics were obtained (A, C, and E) by using a two-tailed unpaired t test with Welch’s correction.
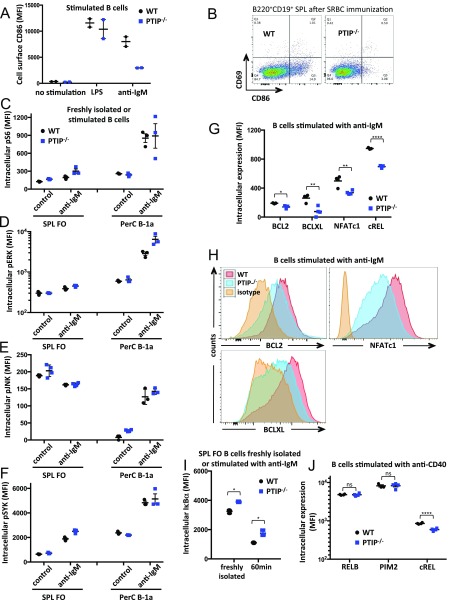
The molecular program of steady-state B-1 cells often shares characteristics with that of their activated FO B-2 counterparts (2). Thus, we hypothesized that, even though PTIP only subtly reduces FO B-2 numbers at steady state (Fig. 2 D and E), it may regulate their function upon activation. Consistent with this notion, we found PTIP protein expression in mature splenic B cells cultured for 3 d to be increased 2.5-fold, 3.6-fold, or 5.2-fold upon anti-CD40, LPS, or BCR cross-linking, respectively, by using PTIPgfp/gfp mice (Fig. 5G and Fig. S5B). To directly assess the role of PTIP in BCR-induced FO B-2 B cell activation, we first measured cell proliferation by way of carboxyfluorescein N-hydroxysuccinimidyl ester (CFSE) dilution. Strikingly, proliferation of PTIP−/− splenic B cells was entirely abrogated in response to stimulation with anti-IgM antibody (Fig. 5H and Fig. S5C), with fewer cells undergoing active DNA replication as measured by EdU incorporation (Fig. S5D). An impairment in proliferation was also observed in PTIP−/− B cells in response to anti-CD40 (Fig. 5H and Fig. S5C). Interestingly, LPS and the TLR9 ligand CpG oligonucleotide stimulations induced extensive proliferation in WT and PTIP−/− B cells, although the fraction of B cells that underwent activation-induced proliferation was subtly decreased in the absence of PTIP (Fig. 5H and Fig. S5 C and D). Survival of PTIP−/− B cells was reduced by 2.4-fold upon stimulation with anti-IgM antibody but was less affected in response to other stimulations (Fig. S5E). Together, these data suggest that PTIP is required for specific aspects of B-2 cell activation downstream of antigen- and T:B interaction-induced activation rather than general cell cycle progression. Consistent with this notion, stimulated PTIP−/− B cells showed reduced cell surface expression of the CD86 activation marker in vitro and in vivo following anti-IgM stimulation and SRBC immunization, respectively (Fig. S6 A and B). These results indicate a crucial role for induced PTIP protein levels in propagating molecular events downstream of BCR ligation.
Fig. S6.
(A) Flow cytometric analyses of mean expression intensities for the cell surface CD86 activation marker in B cells stimulated with LPS or anti-IgM after 3 d. (B) Flow cytometric analysis of splenic B cells harvested from mice 10 d after SRBC immunization. Data demonstrate impaired surface expression of CD86 on B cells from PTIP−/− mice. Representatives of six mice of each genotype. (C–F) Flow cytometric analyses of mean intracellular expression intensities for phospho-S6 (C), phospho-ERK (D), phospho-JNK (E), and phospho-SYK (F) signaling in freshly isolated and anti-IgM-stimulated splenic FO and peritoneal cavity B-1a B cells. Stimulated cells were fixed after 10 min for pS6, 5 min for pERK, 10 min for pJNK, and 2 min for pSYK. Data are from at least three mice of each genotype. (G) Mean intracellular expression intensities of NF-κB signaling components as in H from four mice of each genotype. BCL2, *P = 0.018; BCLXL, **P = 0.004; NFATc1, **P = 0.006; cREL, ****P < 0.0001. (H) Intracellular flow cytometry analyses of indicated NF-κB signaling component expression in splenic B cells stimulated with anti-IgM for 1 d. Data representative of multiple mice. (I) Flow cytometric analysis of mean intracellular expression intensities for IκBα in freshly isolated and anti-IgM-stimulated splenic FO B cells. Stimulated cells were also incubated with cycloheximide and fixed after 60 min. Data are from three mice of each genotype (*P < 0.02). (J) Flow cytometric analysis of mean intracellular expression intensities for NF-κB signaling components in splenic B cells stimulated with anti-CD40 for 1 d. Data are from four mice of each genotype [cREL, ****P = 0.0001; RELB and PIM2, P = 0.9, which is not significant (ns)]. (A and C–J) Mice used were 7–8 wk of age. Statistics were obtained (G, I, and J) by using a two-tailed unpaired t test with Welch’s correction.
To identify signaling pathways that might be altered in PTIP-deficient FO B-2 B cells, we performed intracellular FACS analyses for phosphorylation events triggered by BCR cross-linking. We found no differences with respect to phospho-S6 (Fig. S6C), phospho-ERK (Fig. S6D), phospho-JNK (Fig. S6E), or phospho-SYK (Fig. S6F), consistent with normal membrane-proximal signaling and activation of the PI3K/AKT/mTOR and MAPK pathways. We did, however, detect significantly decreased protein expression of cREL (Fig. 5I and Fig. S6G) and the NF-κB target genes NFATc1, BCLXL, and BCL2 in PTIP−/− B cells (Fig. S6 G and H). These results constitute further evidence that the classical NF-κB pathway is impaired in the absence of PTIP. Consistent with these data, we observed elevated levels of IκBα in both freshly isolated and anti-IgM-stimulated FO B-2 B cells from PTIP−/− mice (Fig. S6I). The classical and the alternative NF-κB pathways are activated in B cells when stimulated with anti-CD40 antibody (25, 26). To determine whether PTIP also regulates the alternative NF-κB pathway, we interrogated the expression of RELB and its target gene PIM2 in anti-CD40 stimulated PTIP−/− and control B cells. Although we again observed decreased cREL expression, RELB and PIM2 were unchanged (Fig. 5J and Fig. S6J). Altogether, these results demonstrate a requirement for PTIP in promoting signaling via the classical NF-κB pathway in steady-state B-1a cells and FO B-2 B cells in response to BCR or CD40 engagement, providing an explanation for the apparent lack of postimmune antibody and GC responses upon TI and TD immunizations (Fig. 1).
Discussion
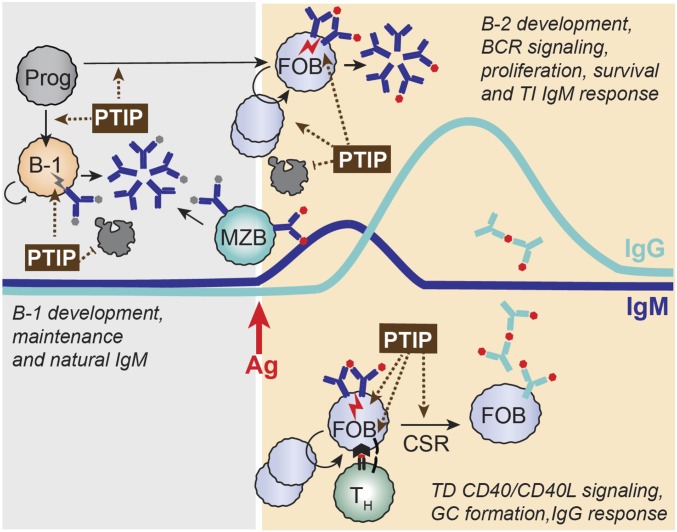
In this study, we use mouse genetics to establish a crucial role for PTIP in licensing the humoral arm of the adaptive immune system in vivo, through regulating key activation and signaling events critical for multiple aspects of B cell development and function (Fig. 6). By using a PTIP-GFP knock-in mouse model, we demonstrate that cellular levels of PTIP protein correlate with BCR signaling strength, being elevated in steady-state innate-like B cell subsets and stimulated FO B cells. By using mice that lack PTIP in a B cell-specific manner, we show a partial block in B cell development at the pre-B cell stage, a severe impairment in neonatal B-1a cell maturation, and defective GC B cell differentiation. In addition, we find that sustained PTIP expression in adult mice is required to promote the long-term maintenance of bona fide self-reactive B-1a cells. Although the steady-state numbers of splenic B-2 cells are not markedly reduced in PTIP-deficient mice, these cells fail to undergo BCR or CD40 stimulation-induced proliferation, at least in part, because of a defect in the classical NF-κB pathway. These results significantly expand the list of PTIP-dependent B cell functions beyond promoting sterile transcription at the Igh locus and CSR (6, 8, 9) and indicate a key role for PTIP in activation-associated proliferation, survival, and differentiation triggered by antigen engagement and T:B interaction. Consequently, PTIP deficiency results in severe hypo-IgM, hypogammaglobulinemia, and profoundly blunted antibody responses to TD and TI antigen immunization, hallmarks of primary common variable immunodeficiency (CVID).
Fig. 6.
Model showing multiple points of PTIP involvement in B cell activation-associated proliferation/differentiation for licensing humoral immunity. PTIP regulates multiple aspects of B cell development and function including (i) the development of B-1 B cells in neonatal life and their self-renewal/survival in adult life, contributing to natural IgM levels in serum before antigen stimulation; (ii) efficient differentiation of small pre-B cells in response to pre-BCR signaling during B cell development; (iii) facilitating signal transduction in response to BCR engagement to promote B cell activation and proliferation/survival, contributing to TI production of antigen-specific IgM during the initial phase of the antibody response; (iv) facilitating signal transduction in response to CD40/CD40L engagement to promote B cell activation and proliferation upon cognate T cell-B cell interaction including GC B cell differentiation; and (v) activating sterile transcription at “switch regions” within the Igh locus to promote IgG class-switching. Ag, antigen; Prog, progenitor; TH, helper T cell. Gray dots signify self-antigens; red dots signify foreign antigens.
Although the precise molecular targets by which PTIP mediates its function in B cell signaling remain to be elucidated, we provide multiple lines of evidence in PTIP-deficient B-1a cells and activated B-2 B cells for deregulation of the classical NF-κB pathway. In addition to decreased cREL and increased IκBα at steady state and in response to anti-IgM, we find protein levels of a handful of NF-κB target genes to be decreased in PTIP-deficient B cells, including BCL2, BCLXL (27, 28), NFATc1 (29), uPA, IRF4 (30), and CD23 (31). These findings indicate a requirement for PTIP in the classical NF-κB pathway and are in line with (i) the established role of the NF-κB pathway in B-1 cell development (15, 24, 25, 32), (ii) evidence for a role of NF-κB downstream of pre-BCR signaling in small pre-B cells (28, 33–36), and (iii) FO B-2 cell functionality including activation-induced proliferation, survival, antibody production, GC differentiation, and CSR (24–26, 37). Although the role of NF-κB signaling in the development of FO B cells may primarily be to promote BCL2 or BCLXL expression for antiapoptotic effects (27, 28, 34), evidence suggests that BCL2-independent functions of NF-κB play a major role in B-1, MZ, and GC B cells and hint at prominent roles during activation-associated differentiation (24, 27, 37). Considering that the cREL NF-κB protein plays an important role in antigen-mediated BCR activation (38) and that sustained cREL activation in response to BCR signaling requires de novo cREL transcription (39), we speculate that PTIP may function in the activation and/or expression of this protein. Several other PTIP-regulated genes have also previously been shown to influence the NF-κB pathway including CD72 (20, 40), Ceacam1 (19), and Annexin A1 (21, 22). Future studies aimed at determining the contribution of each of these signaling components to the various junctures of PTIP involvement in B cell biology (Fig. 6) will be needed to map the PTIP-dependent genetic program establishing humoral immunity.
The striking lack of steady-state levels of serum IgM in PTIP-deficient mice despite normal numbers of overall splenic B cells correlates with the combined loss of B-1 and MZ B cells. These innate-like B cell subsets act in concert to mediate the majority of TI antibody production (2–4), and their development differs from FO B-2 cells in their increased dependency on BCR signaling. For example, B-1a and MZ B cells are positively selected on self-antigen during maturation and their unique clonal representation depends on continued self-antigen exposure (12, 13, 17). Indeed, numerous mouse models deficient in B-1 cells show concomitant defects in MZ B cells (3, 25), including those harboring perturbations in BCR signaling and the NF-κB pathway. We speculate that the B-1 and MZ B cell defects associated with PTIP deficiency stem from a common impairment in signaling and manifest together as a general reduction in natural and postimmune IgM levels. Furthermore, the aforementioned characteristics of innate-like B cells along with the observed higher PTIP protein levels in B-1 and MZ B cells compared with FO B cells are consistent with PTIP protein expression being positively regulated by BCR signaling. Similarly, the elevated expression of and reliance on PTIP protein during neonatal B lymphopoiesis hint toward elevated BCR signaling early in life.
PTIP is a multifunctional chromatin regulator known to dynamically contribute to several multimeric protein complexes to regulate transcription and DNA repair in response to changes in cellular demand (5). A common denominator for our observed PTIP functions in humoral immunity, including the previously described regulation of sterile transcription at the Igh locus (6, 8), is that they operate independently from its interaction with the 53BP1 DNA repair protein. Consistent with this, perturbations of other DNA damage response factors do not impact steady-state or postimmune IgM responses. Moreover, B cells lacking PTIP do not have an inherent defect in cell cycle progression. Thus, we speculate that PTIP-dependent transcriptional regulation rather than its involvement in DNA repair/replication is responsible for the observed effects on humoral immunity. Although MLL4 complexes containing PTIP have been shown to regulate B cell gene expression, phenotypic differences between PTIP- and MLL4-deficient mice (6, 41, 42) point toward an MLL4-independent role for PTIP in humoral immunity.
Although much remains to be understood about how PTIP is regulated by, and in turn regulates, BCR and T:B interaction-triggered molecular events, a model is emerging in which PTIP fundamentally controls humoral immunity at multiple junctures of B cell development and differentiation (Fig. 6). Our results place PTIP in a molecular node required for B cell activation important for humoral immune responses in health and disease. CVID is the most prevalent primary antibody deficiency; with a highly heterogeneous disease origin, the genetic abnormality remains unknown in a majority of patients (43). Further work investigating the mechanism of PTIP function in this context and how it controls the NF-κB pathway may generate valuable new insight.
Materials and Methods
Bone marrow and spleens were subjected to RBC lysis. Antibodies are detailed in Table S1. FACS experiments on freshly isolated cells used a DAPI negative live lymphocyte gate. Intracellular staining experiments used the Zombie Aqua fixable viability kit (BioLegend). Cells were acquired on BD LSRFortessa and sorted on a BD FACSAria III Cell Sorter. All other methods are described in SI Materials and Methods.
Table S1.
Antibodies used in flow cytometry experiments
| Antibody | Fluorochrome | Clone | Company | Intracellular kit* |
| AA4.1 (CD93) | PE-Cy7 | AA4.1 | eBioscience | — |
| AA4.1 (CD93) | PerCP-Cy5.5 | AA4.1 | eBioscience | — |
| AA4.1 (CD93) | PE-CF594 | AA4.1 | BD Biosciences | — |
| Annexin A1 | — | EPR19342 | Abcam | 1 |
| Armenian Hamster IgG isotype control | FITC | eBio299Arm | eBioscience | — |
| B220 | PE-CF594 | RA3-6B2 | BD Biosciences | — |
| B220 | FITC | RA3-6B2 | BD Biosciences | — |
| B220 | Alexa Fluor 700 | RA3-6B2 | BD Biosciences | — |
| BAFF-R | PE | 7H22-E16 | Biolegend | — |
| BCL2 | PE-Cy7 | 10C4 | eBioscience | 1 |
| BCLXL | PE | 7B2.5 | SouthernBiotech | 1 |
| cREL | PE | 1RELAH5 | eBioscience | 2 |
| CD11b | APC-eFluor 780 | M1/70 | eBioscience | — |
| CD16/32 (FcγRIIb) | PE-Cy7 | 93 | Biolegend | — |
| CD19 | Alexa Fluor 700 | 1D3 | eBioscience | — |
| CD19 | APC-eFluor 780 | 1D3 | eBioscience | — |
| CD1d | FITC | 1B1 | Biolegend | — |
| CD21 | FITC | 7G6 | BD Biosciences | — |
| CD21 | APC | 7G6 | BD Biosciences | — |
| CD21 | PE | 7G6 | BD Biosciences | — |
| CD22 | PE | OX-97 | Biolegend | — |
| CD23 | PerCP-eFluor 710 | B3B4 | eBioscience | — |
| CD23 | PE-CF594 | B3B4 | eBioscience | — |
| CD24 | PE | M1/69 | eBioscience | — |
| CD43 | APC | S7 | BD Biosciences | — |
| CD43 | PE-Cy7 | S7 | BD Biosciences | — |
| CD5 | PE-CF594 | 53–7.3 | eBioscience | — |
| CD5 | PE-Cy7 | 53–7.3 | eBioscience | — |
| CD5 | PE | 53–7.3 | eBioscience | — |
| CD66a (CEACAM1) | PE | CC1 | eBioscience | — |
| CD72 | FITC | K10.6 | BD Biosciences | — |
| CD95 | PE-Cy7 | Jo2 | BD Biosciences | — |
| DOPC/CHOL liposomes | Marina Blue | F60103F-MB | FormuMax Scientific | — |
| Goat anti-rabbit IgG H&L-ab150079 | Alexa Fluor 647 | polyclonal | Abcam | — |
| IgG1 | Biotin | A85-1 | BD Pharmingen | — |
| IgG3 | Biotin | R40-82 | BD Pharmingen | — |
| IgM | PerCP-eFluor 710 | II/41 | eBioscience | — |
| IgM | APC-eFluor 780 | II/41 | eBioscience | — |
| IgM | APC | II/41 | eBioscience | — |
| IgM | FITC | II/41 | eBioscience | — |
| IκBα | PE | MFRDTRK | eBioscience | 1 |
| IL5Rα (CD125) | PE | T21 | BD Biosciences | — |
| IRF4 | FITC | 3 E 4 | eBioscience | 2 |
| Mouse IgG2b, κ isotype control | FITC | 27–35 | BD Biosciences | — |
| Mouse IgG1, κ isotype control | PE | MOPC-21 | Biolegend | — |
| Mouse IgG1, κ isotype control | APC | P3.6.2.8.1 | eBioscience | — |
| Mouse IgG1, κ isotype control | PE-Cy7 | P3.6.2.8.1 | eBioscience | — |
| Mouse IgG3, κ isotype control | PE | MG3-35 | Biolegend | — |
| NFATc1 | PE | 7A6 | Biolegend | 2 |
| Phospho-ERK1/2 (T202/Y204) | APC | MILAN8R | eBioscience | 3 |
| Phospho-SAPK/JNK (Thr183/Tyr185) | Alexa Fluor 647 | G9 | Cell Signaling Technology | 3 |
| Phospho-ZAP-70/SYK (Y319/Y352) | APC | n3kobu5 | eBioscience | 3 |
| Phospho-S6 (Ser235/236) | Alexa Fluor 647 | E57.2.2E | Cell Signaling Technology | 3 |
| PIM2 | — | EPR6987 | Abcam | 1 |
| PNA | FITC | — | Vector Laboratories | — |
| Rabbit IgG isotype control | — | EPR25A | Abcam | — |
| Rabbit IgG isotype control-3452 | Alexa Fluor 647 | Polyclonal | Cell Signaling Technology | — |
| Rat IgG1, κ isotype control | PE | G0114F7 | Biolegend | — |
| Rat IgG2a, κ isotype control | PE | R35-95 | BD Biosciences | — |
| Rat IgG2a, κ isotype control | FITC | eBR2a | eBioscience | — |
| Rat IgG2a, κ isotype control | PE-Cy7 | eBR2a | eBioscience | — |
| Rel B | — | D7D7W | Cell Signaling Technology | 2 |
| Siglec G | APC | SH2.1 | eBioscience | — |
| Streptavidin | APC | — | eBioscience | — |
| uPAR (CD87) | PE | 109801 | R&D Systems | — |
| VH12 | APC | C5C | Gift from Klaus Rajewsky | — |
*Kit 1, Intracellular Fixation & Permeabilization Buffer set (no. 88882400; eBioscience); kit 2, Transcription Factor Buffer set (no. 562574; BD Biosciences); kit 3, Fixation Buffer and True-Phos Perm Buffer (no. 420801, 425401; Biolegend).
SI Materials and Methods
Mice and Immunizations.
PTIPflox/flox (44), PTIPgfp/gfp (6), CD19Cre (no. 006785; Jackson Laboratory), Cre-ERT2 (no. 008085; Jackson Laboratory), Rosa26-stop-YFP (no. 006148; Jackson Laboratory), 53BP1−/− (11), and RAG1−/− (no. 002216; Jackson Laboratory) mice were previously described. For Cre-ERT2 experiments, TAM (Sigma) was administered by oral gavage at 200 μg/g once per day five times within 1 wk. Mice were injected i.p. with 10 μg TNP-LPS (T-5065) in PBS solution, 50 μg TNP-Ficoll (F-1300) in PBS solution, 100 μg TNP-KLH (T-5060; LGC Biosearch) in Imject Alum (Thermo scientific), or 1 × 10⁹ SRBCs (Cedarlane) in PBS solution. All experiments were performed in compliance with the Danish Working Environment Authority, the Danish Animal Experiment Inspectorate, and the University of Copenhagen Department of Experimental Medicine.
B Cell Cultures.
Splenic B cells were isolated by depletion with α-CD43 beads (Miltenyi Biotech) and cultured in complete RPMI. Cells were stimulated for the indicated times with anti-IgM F(ab′)2 (10 μg/mL; eBioscience), LPS (25 μg/mL; Sigma), anti-CD40 (10 μg/mL; BD Bioscience), CpG ODN 1826 (10 μg/mL; Invivogen), α-IgD-dextran (2.5 ng/mL; FinaBio), RP105 (0.5 μg/mL; BD Pharmingen), and/or IL4 (5 ng/mL; Sigma) as specified. CFSE labeling (5 μM) was performed at 37 °C for 10 min. The EdU labeling kit (Life Technologies) and the Annexin V apoptosis detection kit (BioLegend) were used according to the manufacturer’s instructions.
ELISA.
Total, TNP-specific, and PC-specific serum Ig were assayed by ELISA on the indicated days before or after immunization. For total Ig, plates were coated with anti-mouse IgM (no. 46501; Biolegend) or IgG (no. 1030–01; Southern Biotechnology). For TNP-specific Ig, plates were coated with 2.5 μg per well TNP-BSA capturing antigen (no. T-5050; LGC Biosearch). For PC-specific Ig, plates were coated with 0.25 μg per well PC-BSA (no. PC-1011; LGC Biosearch). Serial dilutions of serum samples were added to the wells for 1.5 h at 37 °C. Plates were washed and incubated with HRP-conjugated goat anti-mouse IgG1 (no. 1070–05), IgG2a (no. 1080–05), IgG2b (no. 1090–05), IgG3 (no. 1100–05), or IgM (no. 1020–05; Southern Biotechnology). In all cases, wells were developed with the Ultra TMB peroxidase substrate system (Thermo Scientific) and OD was measured at 450 nm by using a Fluostar Omega microplate reader (BMG-Labtech). Purified mouse Ig standards that were used to calculate titers included IgG1 (no. 401401), IgG2a (no. 401501), IgG2b (no. 401201), IgG3 (no. 401301), IgM (no. 401601; Biolegend), and E06 for PC (no. 330001s; Avanti Polar Lipids).
Quantitative RT-PCR.
FACS-sorted B cells were subjected to RNA extraction (RNeasy Plus Micro or Mini kits; Qiagen), reverse transcription (SuperScript III First-Strand Synthesis SuperMix; Invitrogen), and quantitative PCR (SYBR Green PCR Master Mix; Applied Biosystems). Oligo sequences are detailed in Table S2.
Table S2.
Oligonucleotide sequences used in PCR reactions
| Name of oligo | Sequence |
| HPRT | 5′-TGCCGAGGATTTGGAAAAAGTG-3′ |
| 5′-CACAGAGGGCCACAATGTGATG-3′ | |
| PTIP | 5′-GCAGCAGCAGCAGCTTTTTG-3′ |
| 5′-TGCTCGGGATAGTCCGCAAT-3′ | |
| BCL2 | 5′-CTGCACCTGACGCCCTTCACC-3′ |
| 5′-CACATGACCCCACCGAACTCAAAGA-3′ | |
| VDJ-seq | |
| TSO | 5′-/5BiosG/AAGCAGTGGTArUCAACGCAGAGrUTCAGTGrGrGrG-3′ |
| IgM Rev | 5′-CTGATACCCTGGATGACTTC-3′ |
| TSO amp fwd | 5′-TCGTCGGCAGCGTCAGATGTGTATAAGAGACAGAAGCAGTGGTATCAACGCAGAGT-3′ |
| IgHM amp rev | 5′-GTCTCGTGGGCTCGGAGATGTGTATAAGAGACAGGGAAGACATTTGGGAAGGACTGACT-3′ |
5BiosG, 5′ biotinylated G, r, RNA bases.
Microarray.
Total RNA with RIN numbers >8 from B-1a cells sorted from 22 WT and 29 PTIP−/− mice were divided into four unique biological replicates per genotype and analyzed with a GeneChip Mouse Gene 2.0 ST Array (Affymetrix). Data were deposited in the Gene Expression Omnibus database with accession no. GSE98402.
VDJ-Seq.
Lysates from 5,000 or 1,000 B-1a cells from 5-wk-old or 8-wk-old mice, respectively, were subjected to template-specific cDNA synthesis and template switching reverse transcription (SMARTScribe Reverse Transcriptase kit; Clontech Takara). Oligo sequences are detailed in Table S2. A total of 2 ng of amplified cDNA was indexed (Nextera XT indexing kit; Illumina) and sequenced by using the MiSeq V3 600c paired-end sequencing kit (Illumina). Paired-end reads were merged by using PEAR (45). FASTQ files were read by using R (R Core Team, 2015; https://www.r-project.org/) with the ShortRead package and converted to FASTA files subsequently submitted to IMGT/HighV-QUEST (46) for annotation.
All analyses of annotated VDJ-seq data were performed by using R in combination with the stringr, plyr, dplyr, and gplots packages. Only annotated sequences containing productively recombined IgM sequences with annotated D and CDR3 sequences were considered for analysis. A minimum read per cell cutoff was set to exclude sequences obtained through sequencing errors and low sequencing depth. This cutoff was defined as the number of productive reads per number of input cells. Clones with read frequencies above this cutoff were used for subsequent analysis. IgM IGHV families were determined based on IMGT/HighV-QUEST annotation of sequences. To determine PtC-reactive CDR3 sequences in the test samples, a reference library was generated by FACS-sorting 10,000 PtC-reactive peritoneal cavity B-1 B cells from control WT C57BL/6 mice and subjecting this sample to VDJ-seq as described. The obtained annotated Igh-μ sequence information was used to generate a reference list of CDR3 amino acid sequences (CDR3AA) encoding the PtC-reactive specificities and was subsequently used to cross-reference the CDR3AA sequences in the tested samples.
Supplementary Material
Acknowledgments
We thank G. Cruz for FACS sorting, O. Østrup for microarray analysis, K. Rajewsky for Vh12 antibody, University of Copenhagen Department of Experimental Medicine animal caretakers, and A. Mund for discussions. This work was supported by Independent Research Fund Denmark with a Sapere Aude Starting Grant (to J.A.D.) and postdoctoral fellowship (to L.M.S.); the Danish Cancer Society (to J.A.D.); Novo Nordisk Foundation Grant NNF14CC0001 (to J.A.D.); and grants from the Swedish Cancer Foundation (to J.Y.), Swedish Research Council (to J.Y.), European Research Council (to J.Y.), StemTherapy (to J.Y.), Knut and Alice Wallenberg Foundation (to J.Y.), Swedish Cancer Foundation (to E.J.G.), and Wenner–Gren Foundations (to S.V.).
Footnotes
The authors declare no conflict of interest.
This article is a PNAS Direct Submission.
Data deposition: The data reported in this paper have been deposited in the Gene Expression Omnibus (GEO) database, https://www.ncbi.nlm.nih.gov/geo (accession no. GSE98402).
This article contains supporting information online at www.pnas.org/lookup/suppl/doi:10.1073/pnas.1707938114/-/DCSupplemental.
References
- 1.Baumgarth N, et al. Innate and acquired humoral immunities to influenza virus are mediated by distinct arms of the immune system. Proc Natl Acad Sci USA. 1999;96:2250–2255. doi: 10.1073/pnas.96.5.2250. [DOI] [PMC free article] [PubMed] [Google Scholar]
- 2.Baumgarth N. B-1 cell heterogeneity and the regulation of natural and antigen-induced IgM production. Front Immunol. 2016;7:324. doi: 10.3389/fimmu.2016.00324. [DOI] [PMC free article] [PubMed] [Google Scholar]
- 3.Martin F, Oliver AM, Kearney JF. Marginal zone and B1 B cells unite in the early response against T-independent blood-borne particulate antigens. Immunity. 2001;14:617–629. doi: 10.1016/s1074-7613(01)00129-7. [DOI] [PubMed] [Google Scholar]
- 4.Haas KM, Poe JC, Steeber DA, Tedder TF. B-1a and B-1b cells exhibit distinct developmental requirements and have unique functional roles in innate and adaptive immunity to S. pneumoniae. Immunity. 2005;23:7–18. doi: 10.1016/j.immuni.2005.04.011. [DOI] [PubMed] [Google Scholar]
- 5.Daniel JA, Nussenzweig A. The AID-induced DNA damage response in chromatin. Mol Cell. 2013;50:309–321. doi: 10.1016/j.molcel.2013.04.017. [DOI] [PMC free article] [PubMed] [Google Scholar]
- 6.Starnes LM, et al. A PTIP-PA1 subcomplex promotes transcription for IgH class switching independently from the associated MLL3/MLL4 methyltransferase complex. Genes Dev. 2016;30:149–163. doi: 10.1101/gad.268797.115. [DOI] [PMC free article] [PubMed] [Google Scholar]
- 7.Callen E, et al. 53BP1 mediates productive and mutagenic DNA repair through distinct phosphoprotein interactions. Cell. 2013;153:1266–1280. doi: 10.1016/j.cell.2013.05.023. [DOI] [PMC free article] [PubMed] [Google Scholar]
- 8.Daniel JA, et al. PTIP promotes chromatin changes critical for immunoglobulin class switch recombination. Science. 2010;329:917–923. doi: 10.1126/science.1187942. [DOI] [PMC free article] [PubMed] [Google Scholar]
- 9.Schwab KR, Patel SR, Dressler GR. Role of PTIP in class switch recombination and long-range chromatin interactions at the immunoglobulin heavy chain locus. Mol Cell Biol. 2011;31:1503–1511. doi: 10.1128/MCB.00990-10. [DOI] [PMC free article] [PubMed] [Google Scholar]
- 10.Manis JP, et al. 53BP1 links DNA damage-response pathways to immunoglobulin heavy chain class-switch recombination. Nat Immunol. 2004;5:481–487. doi: 10.1038/ni1067. [DOI] [PubMed] [Google Scholar]
- 11.Ward IM, et al. 53BP1 is required for class switch recombination. J Cell Biol. 2004;165:459–464. doi: 10.1083/jcb.200403021. [DOI] [PMC free article] [PubMed] [Google Scholar]
- 12.Hayakawa K, et al. Positive selection of natural autoreactive B cells. Science. 1999;285:113–116. doi: 10.1126/science.285.5424.113. [DOI] [PubMed] [Google Scholar]
- 13.Wen L, et al. Evidence of marginal-zone B cell-positive selection in spleen. Immunity. 2005;23:297–308. doi: 10.1016/j.immuni.2005.08.007. [DOI] [PubMed] [Google Scholar]
- 14.Montecino-Rodriguez E, Dorshkind K. B-1 B cell development in the fetus and adult. Immunity. 2012;36:13–21. doi: 10.1016/j.immuni.2011.11.017. [DOI] [PMC free article] [PubMed] [Google Scholar]
- 15.Montecino-Rodriguez E, Dorshkind K. Formation of B-1 B cells from neonatal B-1 transitional cells exhibits NF-κB redundancy. J Immunol. 2011;187:5712–5719. doi: 10.4049/jimmunol.1102416. [DOI] [PMC free article] [PubMed] [Google Scholar]
- 16.Pedersen GK, et al. B-1a transitional cells are phenotypically distinct and are lacking in mice deficient in IκBNS. Proc Natl Acad Sci USA. 2014;111:E4119–E4126. doi: 10.1073/pnas.1415866111. [DOI] [PMC free article] [PubMed] [Google Scholar]
- 17.Yang Y, et al. Distinct mechanisms define murine B cell lineage immunoglobulin heavy chain (IgH) repertoires. eLife. 2015;4:e09083. doi: 10.7554/eLife.09083. [DOI] [PMC free article] [PubMed] [Google Scholar]
- 18.Mercolino TJ, Arnold LW, Hawkins LA, Haughton G. Normal mouse peritoneum contains a large population of Ly-1+ (CD5) B cells that recognize phosphatidyl choline. Relationship to cells that secrete hemolytic antibody specific for autologous erythrocytes. J Exp Med. 1988;168:687–698. doi: 10.1084/jem.168.2.687. [DOI] [PMC free article] [PubMed] [Google Scholar]
- 19.Khairnar V, et al. CEACAM1 induces B-cell survival and is essential for protective antiviral antibody production. Nat Commun. 2015;6:6217. doi: 10.1038/ncomms7217. [DOI] [PMC free article] [PubMed] [Google Scholar]
- 20.Li DH, et al. CD72 down-modulates BCR-induced signal transduction and diminishes survival in primary mature B lymphocytes. J Immunol. 2006;176:5321–5328. doi: 10.4049/jimmunol.176.9.5321. [DOI] [PubMed] [Google Scholar]
- 21.Zhang Z, Huang L, Zhao W, Rigas B. Annexin 1 induced by anti-inflammatory drugs binds to NF-kappaB and inhibits its activation: Anticancer effects in vitro and in vivo. Cancer Res. 2010;70:2379–2388. doi: 10.1158/0008-5472.CAN-09-4204. [DOI] [PMC free article] [PubMed] [Google Scholar]
- 22.Bist P, et al. Annexin-1 interacts with NEMO and RIP1 to constitutively activate IKK complex and NF-κB: Implication in breast cancer metastasis. Oncogene. 2011;30:3174–3185. doi: 10.1038/onc.2011.28. [DOI] [PubMed] [Google Scholar]
- 23.Pedersen GK, Ádori M, Karlsson Hedestam GB. NF-κB signaling in B-1 cell development. Ann N Y Acad Sci. 2015;1362:39–47. doi: 10.1111/nyas.12800. [DOI] [PubMed] [Google Scholar]
- 24.Derudder E, et al. Canonical NF-κB signaling is uniquely required for the long-term persistence of functional mature B cells. Proc Natl Acad Sci USA. 2016;113:5065–5070. doi: 10.1073/pnas.1604529113. [DOI] [PMC free article] [PubMed] [Google Scholar]
- 25.Sasaki Y, Iwai K. Roles of the NF-κB pathway in B-lymphocyte biology. Curr Top Microbiol Immunol. 2016;393:177–209. doi: 10.1007/82_2015_479. [DOI] [PubMed] [Google Scholar]
- 26.Gerondakis S, Siebenlist U. Roles of the NF-kappaB pathway in lymphocyte development and function. Cold Spring Harb Perspect Biol. 2010;2:a000182. doi: 10.1101/cshperspect.a000182. [DOI] [PMC free article] [PubMed] [Google Scholar]
- 27.Grossmann M, et al. The anti-apoptotic activities of Rel and RelA required during B-cell maturation involve the regulation of Bcl-2 expression. EMBO J. 2000;19:6351–6360. doi: 10.1093/emboj/19.23.6351. [DOI] [PMC free article] [PubMed] [Google Scholar]
- 28.Derudder E, et al. Development of immunoglobulin lambda-chain-positive B cells, but not editing of immunoglobulin kappa-chain, depends on NF-kappaB signals. Nat Immunol. 2009;10:647–654. doi: 10.1038/ni.1732. [DOI] [PMC free article] [PubMed] [Google Scholar]
- 29.Berland R, Wortis HH. Normal B-1a cell development requires B cell-intrinsic NFATc1 activity. Proc Natl Acad Sci USA. 2003;100:13459–13464. doi: 10.1073/pnas.2233620100. [DOI] [PMC free article] [PubMed] [Google Scholar]
- 30.Grumont RJ, Gerondakis S. Rel induces interferon regulatory factor 4 (IRF-4) expression in lymphocytes: Modulation of interferon-regulated gene expression by rel/nuclear factor kappaB. J Exp Med. 2000;191:1281–1292. doi: 10.1084/jem.191.8.1281. [DOI] [PMC free article] [PubMed] [Google Scholar]
- 31.Lu KT, Sinquett FL, Dryer RL, Song C, Covey LR. c-Rel plays a key role in deficient activation of B cells from a non-X-linked hyper-IgM patient. Blood. 2006;108:3769–3776. doi: 10.1182/blood-2006-03-008839. [DOI] [PMC free article] [PubMed] [Google Scholar]
- 32.Pohl T, et al. The combined absence of NF-kappa B1 and c-Rel reveals that overlapping roles for these transcription factors in the B cell lineage are restricted to the activation and function of mature cells. Proc Natl Acad Sci USA. 2002;99:4514–4519. doi: 10.1073/pnas.072071599. [DOI] [PMC free article] [PubMed] [Google Scholar]
- 33.Jimi E, et al. Activation of NF-kappaB promotes the transition of large, CD43+ pre-B cells to small, CD43- pre-B cells. Int Immunol. 2005;17:815–825. doi: 10.1093/intimm/dxh263. [DOI] [PubMed] [Google Scholar]
- 34.Feng B, Cheng S, Pear WS, Liou H-C. NF-kB inhibitor blocks B cell development at two checkpoints. Med Immunol. 2004;3:1. doi: 10.1186/1476-9433-3-1. [DOI] [PMC free article] [PubMed] [Google Scholar]
- 35.Claudio E, Saret S, Wang H, Siebenlist U. Cell-autonomous role for NF-kappa B in immature bone marrow B cells. J Immunol. 2009;182:3406–3413. doi: 10.4049/jimmunol.0803360. [DOI] [PMC free article] [PubMed] [Google Scholar]
- 36.Scherer DC, et al. Corepression of RelA and c-rel inhibits immunoglobulin kappa gene transcription and rearrangement in precursor B lymphocytes. Immunity. 1996;5:563–574. doi: 10.1016/s1074-7613(00)80271-x. [DOI] [PubMed] [Google Scholar]
- 37.Heise N, et al. Germinal center B cell maintenance and differentiation are controlled by distinct NF-κB transcription factor subunits. J Exp Med. 2014;211:2103–2118. doi: 10.1084/jem.20132613. [DOI] [PMC free article] [PubMed] [Google Scholar]
- 38.Grumont RJ, et al. B lymphocytes differentially use the Rel and nuclear factor kappaB1 (NF-kappaB1) transcription factors to regulate cell cycle progression and apoptosis in quiescent and mitogen-activated cells. J Exp Med. 1998;187:663–674. doi: 10.1084/jem.187.5.663. [DOI] [PMC free article] [PubMed] [Google Scholar]
- 39.Castro I, et al. B cell receptor-mediated sustained c-Rel activation facilitates late transitional B cell survival through control of B cell activating factor receptor and NF-kappaB2. J Immunol. 2009;182:7729–7737. doi: 10.4049/jimmunol.0803281. [DOI] [PMC free article] [PubMed] [Google Scholar]
- 40.Pan C, Baumgarth N, Parnes JR. CD72-deficient mice reveal nonredundant roles of CD72 in B cell development and activation. Immunity. 1999;11:495–506. doi: 10.1016/s1074-7613(00)80124-7. [DOI] [PubMed] [Google Scholar]
- 41.Ortega-Molina A, et al. The histone lysine methyltransferase KMT2D sustains a gene expression program that represses B cell lymphoma development. Nat Med. 2015;21:1199–1208. doi: 10.1038/nm.3943. [DOI] [PMC free article] [PubMed] [Google Scholar]
- 42.Zhang J, et al. Disruption of KMT2D perturbs germinal center B cell development and promotes lymphomagenesis. Nat Med. 2015;21:1190–1198. doi: 10.1038/nm.3940. [DOI] [PMC free article] [PubMed] [Google Scholar]
- 43.Bonilla FA, Geha RS. Common variable immunodeficiency. Pediatr Res. 2009;65:13R–19R. doi: 10.1203/PDR.0b013e31819dbf88. [DOI] [PubMed] [Google Scholar]
- 44.Kim D, Wang M, Cai Q, Brooks H, Dressler GR. Pax transactivation-domain interacting protein is required for urine concentration and osmotolerance in collecting duct epithelia. J Am Soc Nephrol. 2007;18:1458–1465. doi: 10.1681/ASN.2006060625. [DOI] [PMC free article] [PubMed] [Google Scholar]
- 45.Zhang J, Kobert K, Flouri T, Stamatakis A. PEAR: A fast and accurate Illumina Paired-End reAd mergeR. Bioinformatics. 2014;30:614–620. doi: 10.1093/bioinformatics/btt593. [DOI] [PMC free article] [PubMed] [Google Scholar]
- 46.Alamyar E, Duroux P, Lefranc M-P, Giudicelli V. IMGT(®) tools for the nucleotide analysis of immunoglobulin (IG) and T cell receptor (TR) V-(D)-J repertoires, polymorphisms, and IG mutations: IMGT/V-QUEST and IMGT/HighV-QUEST for NGS. Methods Mol Biol. 2012;882:569–604. doi: 10.1007/978-1-61779-842-9_32. [DOI] [PubMed] [Google Scholar]
Associated Data
This section collects any data citations, data availability statements, or supplementary materials included in this article.


