

Abstract
Polyplexes composed of polyethyleneimine (PEI) and DNA or siRNA have attracted great attention for their use in gene therapy. While many physicochemical characteristics of these polyplexes remain unknown, PEI/DNA complexes have been repeatedly shown to be more stable than their PEI/siRNA counterparts. Here, we examine potential causes for this difference using atomistic molecular dynamics simulations of complexation between linear PEI and DNA or siRNA duplexes containing the same number of bases. The two types of polyplexes are stabilized by similar interactions, as PEI amines primarily interact with nucleic acid phosphate groups but also occasionally interact with groove atoms of both nucleic acids. However, the number of interactions in PEI/DNA complexes is greater than in comparable PEI/siRNA complexes, with interactions between protonated PEI amines and DNA being particularly enhanced. These results indicate that structural differences between DNA and siRNA may play a role in the increased stability of PEI/DNA complexes. Additionally, we investigate the binding of PEI chains to polyplexes that have a net positive charge. Binding of PEI to these overcharged complexes involves interactions between PEI and areas on the nucleic acid surface that have maintained a negative electrostatic potential and is facilitated by the release of water from the nucleic acid.
Graphical abstract
Introduction
Gene therapy is a promising technique for the treatment of many diseases through the delivery of therapeutic nucleic acids to a patient's cells.1 The traditional approach to gene therapy involves the delivery of a gene, often in the form of plasmid DNA (pDNA), to the nucleus of a cell, resulting in the expression of a therapeutic protein. More recently, gene therapy based on non-coding nucleic acids, such as siRNAs which bind to target mRNAs in the cytosol and prevent their expression, have been developed.2,3 Much effort has been put into creating systems that can efficiently and safely deliver nucleic acids to their intended target cells.4,5 A variety of delivery systems based on polycationic materials have been reported since polycationic materials can be easily modified or tailored via rich polymer chemistry and synthetic methods.2,6 One of the most highly studied polycationic materials is polyethyleneimine (PEI), and PEI-based gene delivery treatments for HIV and pancreatic, bladder, and ovarian cancers have reached clinical trials.2,7,8 Despite great efforts in the development of PEI-based gene delivery systems, structural characterization of the PEI/nucleic acid polyplexes used in these systems remains poor. The lack of structural characterization of these polyplexes is due, in part, to their formation being kinetically controlled. Thus, the polyplexes may undergo changes over a long period of time and reported structures will depend on the specifics of how the delivery systems were prepared and analyzed.9 Moreover, most experiments only provide large-scale characteristics of the polyplexes, such as their size and zeta-potential,10–13 making it difficult to obtain a detailed, atomic-level view of the polyplex.
In response to these shortcomings, there has been extensive use of computer simulations to investigate the formation and structure of complexes formed between nucleic acids and PEI or other polycations.14,15 Our group was the first to show that atomistic molecular dynamics simulations could be used to observe the spontaneous formation of a PEI/DNA complex.16 Subsequently, atomistic molecular dynamics simulations have been widely used to shed light on PEI-nucleic acid complexes.15,17–22 Among other things, these studies have investigated how polyplexes formed from linear PEI differ from those formed with branched PEI,20,23 how the addition of lipids to PEI impacts interactions with nucleic acids,24 and the stability of polyplexes in response to high salt concentrations, similar to the environments that may be encountered by polyplexes along the gene delivery pathway.18
While PEI-nucleic acids complexes have not been fully characterized, one property that has been repeatedly seen in experimental investigations is that PEI/pDNA complexes are more stable than PEI/siRNA complexes.10,11,25 For example, Kwok and Hart11 showed that the addition of approximately five times as much heparin sulfate was required to restore the fluorescence of fluorescence-labeled pDNA after complexation with PEI compared to what was required to restore fluorescence of labeled siRNA in PEI/siRNA complexes. While the greater stability of PEI/pDNA complexes has been consistently observed, the specific reasons for this difference have not been delineated. It has been suggested that PEI/pDNA complexes are more stable due to the massive difference in the charges of pDNA and siRNA; while pDNA is thousands of basepairs long (and, therefore, carries thousands of negative charges), siRNA is ∼20 basepairs long and has a charge of only ∼-40. Another potential cause of the difference in stability between pDNA and siRNA polyplexes is that the local structures of pDNA and siRNA are different and that this difference may impact the interactions between the nucleic acid and the PEI chain. Specifically, pDNA is a B form nucleic acid, which is longer and thinner with wider and more shallow grooves than the A form siRNA. These structural differences could impact the number and nature of the interactions between the nucleic acid and PEI. Atomistic molecular dynamic simulations are able to provide the atomic level detail that is necessary to investigate this issue and have been previously used to compare the binding of DNA and siRNA to polycationic dendrimers.26,27 However, a comprehensive, direct comparison between the structure and interactions within PEI/DNA and PEI/siRNA complexes using atomistic simulations has not been performed.
Here, we perform a series of atomistic molecular dynamic simulations of the formation of PEI/DNA and PEI/siRNA polyplexes and investigate how the local structures of PEI/DNA and PEI/siRNA polyplexes differ. Specifically, we study the binding of linear PEI chains of length 20 and charge +10 that are sequentially added to nucleic acid duplexes with a charge of -40. This method allows us to monitor changes in polyplex structure and environment as the PEI nitrogen to nucleic acid phosphate ratio (N/P ratio) of the complex increases and investigate how complex formation is driven by factors including electrostatic interactions and the release of counterions and water. We focus on the similarities and differences in the formation and structure of PEI/DNA and PEI/siRNA polyplexes. Our investigations lead to some conclusions that can be tested in experiments.
Methods
Nucleic acid and PEI sequences and structures
The DNA and siRNA used in the simulations are composed of 42 bases, giving each nucleic acid duplex a net charge of -40. Their initial structures were built using the Nucleic Acid Builder (NAB) AMBER program (http://structure.usc.edu/make-na/server.html). The DNA has the sequence d(5′-CGCGAATTCGCGATATCCCGG-3′-CCGGGATATCGCGAATTCGCG-5′) and was built as a B-form DNA duplex. The siRNA sequence, which has been previously used in atomistic molecular dynamic simulations to study polycation binding,28 is d(5′-GCAACAGUUACUGCGACGUUU-3′-ACGUCGCAGUAACUGUUGCUU-5′). The initial siRNA structure was built as an A-form nucleic acid duplex with a two base overhang. Description of atoms in the nucleic acids and PEI chains that are specifically mentioned in the manuscript are described in Supplementary Table S1.
All PEI chains used in the simulations were 20 repeating unit long linear chains. The protonation of PEI has been the subject of several recent studies that have shown that approximately 50% of the PEI amine groups are protonated near neutral pH.29–31 Previous theoretical investigations of the protonation of PEI that have produced titration curves in accord with experiments have indicated that the protonation of nearest neighbor PEI amine groups is energetically unfavorable, as there is a large electrostatic penalty associated with the simultaneous protonation of neighboring amines.29,30 Therefore, only alternating amines of PEI chains in the present study are protonated, giving each PEI chain a charge of +10. Initial configurations of PEI chains used in the complexation simulations were generated by simulating a PEI chain in a cubic box with dimensions of approximately 100 Å × 100 Å × 100 Å with TIP3P water and Na+ and Cl- ions for 20 ns.
Simulation details
All simulations were performed with the CUDA32–34 implementation of AMBER 1235 or 1436 using the AMBER force field ff12SB for nucleic acids, ionsjc_tip3p parameters for small ions (Na+ and Cl-),37 and the gaff forcefield38 with partial charges that we have previously developed16 for PEI molecules. The macromolecules were placed in cubic simulation boxes with dimensions of approximately 100 Å × 100 Å × 100 Å containing TIP3P water and ions that were randomly added to the system using LEaP. Each system was first equilibrated with 2000 steps of energy minimization with harmonic restraints on the nucleic acids and PEI, followed by 1000 steps of unrestrained minimization. The simulation systems were further equilibrated for 20 ps in which the temperature was increased from 0 to 300 K at a constant pressure of 1 atm. This was followed by a minimum of 20 ns of NPT simulation during which the macromolecules were restrained with 10 kcal/mol·Å2 restraints to allow the ions to equilibrate in the simulation box. The restraints were then removed and the production phase simulations began. All simulations used a time step of 2 fs with SHAKE39,40 constraints on covalent bonds with hydrogen atoms. The particle mesh Ewald method41 was used to treat long range electrostatic interactions with a 10 Å cutoff. The temperature was kept at 300K using Langevin dynamics with a collision frequency of 1.0 ps-1. Pressure was controlled using the Berendsen barostat with a reference pressure of 1.0 bar and a relaxation time of 1.0 ps.
Sequential addition and simultaneous addition simulations
The majority of the discussion in this work is based on what we will refer to as simulations of the sequential addition of PEI to a DNA or siRNA duplex. In these simulations, PEI chains were added one at a time to the simulation box, with a new PEI chain introduced only after the previous PEI chain bound to the nucleic acid. The initial system involved the nucleic acid duplex and a single PEI chain that was placed approximately 50 Å, or about half of the box length, away from the nucleic acid chain. During the production run of the simulation, the PEI chain would move toward and bind to the nucleic acid. After the PEI chain interacted with the nucleic acid for at least 10 ns, the conformation of the chains in the polyplex was saved and used as the initial configuration of the subsequent simulation. The ion atmosphere surrounding the polyplex was also maintained in the subsequent simulation by selecting all Na+ and Cl- ions in a cylinder with a radius of 25 Å and a height of 80 Å centered along the nucleic acid axis and including these ions in the new simulation box. An additional PEI chain was then placed approximately 50 Å away from the polyplex and the system was solvated with TIP3P water. Salt ions were randomly added to provide a salt concentration of ∼150 mM in the volume excluding the cylinder surrounding the polyplex. The new system was subjected to the equilibration procedure discussed above. This process continued until the newly added PEI chain did not develop long-lasting interactions with the nucleic acid. Details of the sequential addition simulations including the number of salt ions and the total simulation length are given in Supplementary Table S2. All systems were simulated for at least 50 ns after interactions between the new PEI chain in the system and the nucleic acid developed to provide adequate simulation time for calculating average values. The total simulation lengths for sequential addition of PEI chains were on the order of a microsecond, not including the time to equilibrate ions while the macromolecules were restrained.
In addition to sequential addition simulations, we performed what we refer to as simultaneous addition simulations. In the simultaneous addition simulations, the DNA or siRNA duplex was placed in a cubic simulation box with dimensions of approximately 100 Å × 100 Å × 100 Å and surrounded by 10 PEI chains of length 20 that were randomly placed in the box so that their centers of mass were ∼20 Å from the nucleic acid. The simulations were equilibrated as discussed previously. Details of the simultaneous addition simulations are provided in Supplementary Table S3. Two sets of simultaneous simulations were performed using different initial starting positions. The first set of simultaneous addition simulations were run for 260 ns, while the second set was run for 380 ns.
Simulation analysis
Simulations were visualized with VMD 1.9.242 and analyzed with cpptraj.43 Average values were determined by averaging over 5000 snapshots taken from the final 50 ns of the simulations. Cut-off distances for determining the number of monovalent ions and water bound to polyelectrolyte chains, as well as interactions between polyelectrolytes, were selected after inspecting peak locations in radial distribution plots. Changes in the structure of siRNA during complexation were analyzed using 3DNA.44,45
Electrostatic potentials surrounding polyplexes were determined by solving the nonlinear Poisson-Boltzmann (PB) equation with the Adaptive Poisson-Boltzmann Solver (APBS) software package,46 following our previous investigations of the ion atmosphere surrounding a DNA duplex.47 To examine the electrostatic potential surrounding a polyplex, water and ions were stripped from a representative snapshot of the simulation, leaving only the atoms of the nucleic acid duplex and PEI chains. The partial charges and Lennard-Jones radii used in molecular dynamics simulations of these atoms were also used for PB calculations. The PB equation was first solved using a single Debye-Hückel boundary condition on a large, coarse grid box with 200 Å per side using 225 grid points per axis, and was then solved on a fine grid in a box with 100 Å per side, approximately the size of the periodic box in the MD simulations. The solute was treated with a dielectric constant of 2, while the solvent dielectric was set to 78.4. The ion probe radius was set to 1.16 Å, corresponding to the experimental crystal ionic radius of Na+,48 and the solution ionic strength was set to 150 mM.
Results and Discussion
1. Spontaneous complexation and formation of an overcharged polyplex
Previous molecular dynamics simulations investigating the formation and structure of nucleic acid-polycation complexes have typically used two main approaches. First, the complexation of a single polycation chain and a single nucleic acid duplex that are often separated by a relatively large distance (∼50 Å) has been studied.16,20,22,49 Having a large distance between the polyelectrolytes in the starting configuration minimizes the impact of the initial position on where the polycation binds to the nucleic acid. However, the magnitude of the charge of the polycation in these simulations was less than or equal to the charge of the nucleic acid, and, thus, the resulting polyplex carries a neutral or net negative charge, despite the fact the PEI polyplexes used in gene delivery are typically overcharged (i.e., a sufficient amount of PEI binds to the nucleic acid so that the polyplex has a net positive charge). Second, in an approach that we will refer to as simultaneous addition, systems containing multiple polycation chains and one or more nucleic acid duplexes have been simulated.19,23,24,50 These studies have allowed for the investigation of the structure and interactions in overcharged complexes, but may contain artifacts resulting from the starting configuration of the simulation as the polyelectrolyte chains are initially separated by relatively small distances. For example, simulations in which PEI chains were initially aligned parallel to a DNA duplex have produced complex structures where several of the PEI chains have conformations that are roughly parallel to the DNA.23
Here, we used a third simulation approach, which we call sequential addition. A similar approach has been previously used to study nucleic acid-polycation complexation,18 but the changes in the polyplex structure and environment surrounding the nucleic acid as PEI chains join the polyplex were not comprehensively analyzed. In this approach, single PEI chains are added to the simulation box, one at a time, until they stop binding to the nucleic acid. Specifically, the simulations performed here involved the addition of a 20 monomer long linear PEI chain in which alternating amine groups were protonated (each PEI chain had a +10 charge) to a system containing a DNA or siRNA duplex containing 42 bases (the nucleic acid charge was -40). The time that was required for each PEI chain that was added to the simulation box to develop interactions with the nucleic acid was determined and is shown in Supplementary Table S2. In general, the binding of PEI chains to the DNA complex occurred more quickly than binding to the siRNA complex in this set of simulations. However, binding times depend on the initial positions of the PEI chains, and more extensive simulations would be required to suitably compare binding times.
In the sequential addition simulations of both DNA and siRNA complexes, the first 7 PEI chains added to the system bound to the nucleic acid. A sequential addition simulation containing an eighth PEI chain ran for 800 ns without the development of interactions between the 8th PEI chain and the siRNA polyplex. In the DNA system, an 8th PEI chain bound to the lower face of the DNA duplex after approximately 122 ns of simulation time; however, after an additional 30 ns of simulation, PEI chain 8 began to break from the polyplex. Sequential addition simulations containing a total of 9 PEI chains for the DNA system were run for 500 ns without the development of long-lasting interactions between more than 7 PEI chains and the DNA. Thus, we conclude that for both DNA and siRNA systems stable PEI/nucleic acid complexes contained 7 PEI chains for these sequential addition simulations, giving a polyplex with a PEI nitrogen to nucleic acid phosphate (N/P) ratio of 3.5. We note that this stable complex carries a net charge of +30 since each PEI chain has a charge of +10 and the nucleic acid has a charge of -40. The driving force for formation of these overcharged complexes will be discussed shortly. Figure 1 displays representative snapshots of polyplex structures during the sequential addition of PEI to both DNA and siRNA.
Figure 1.
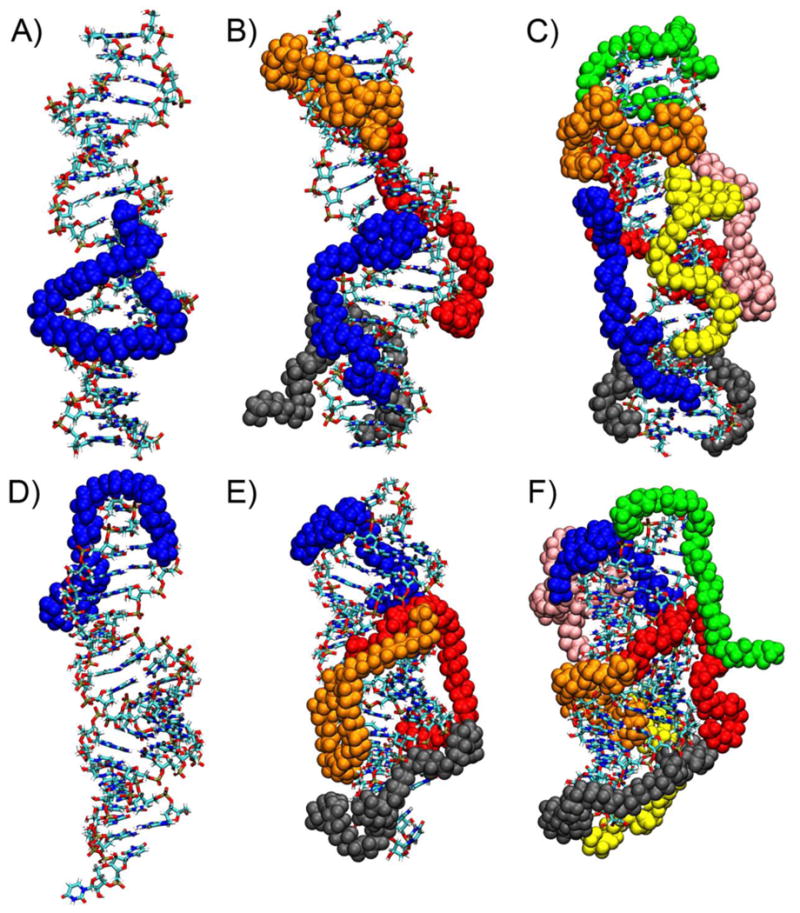
Snapshots showing polyplex structures from simulations of the sequential addition of PEI chains to nucleic acids. DNA interacting with (a) 1, (b) 4, and (c) 7 PEI chains and siRNA interacting with (d) 1, (e) 4, and (f) 7 PEI chains are shown. PEI chains were added to the system in the following order: blue, red, grey, orange, yellow, green, and pink.
To supplement the sequential addition simulations, we also performed simultaneous addition simulations which begin with 10 PEI chains with the same length and protonation as in the sequential addition simulations surrounding a DNA or siRNA duplex. Two simultaneous addition simulations with different starting configurations were performed for both DNA and siRNA; details of the simultaneous addition simulations are provided in Supplementary Table S3. In both of the DNA simultaneous addition simulations, 8 of the PEI chains bound to the nucleic acid, while 2 PEI chains remained free in solution. Thus, the simultaneous addition simulations resulted in DNA polyplexes that contained one more PEI chain than the sequential addition simulations, giving the simultaneous addition DNA polyplexes an N/P ratio of 4. The simultaneous addition simulations of siRNA complexation had different results, with one simulation resulting in the binding of 7 PEI chains to the siRNA (matching the sequential addition simulations) and one simulation resulting in a siRNA polyplex containing 8 PEI chains, giving N/P ratios of 3.5 and 4, respectively.
The N/P ratio is an important parameter that can be varied easily in experiments to achieve high transfection efficiency in gene delivery. Experimentally, the N/P ratio is reported as a simple mixing ratio of the number of PEI nitrogen atoms to the number of nucleic acid phosphate atoms. It, therefore, does not differentiate PEI nitrogens that are in the polyplex and involved in neutralizing the nucleic acid charge from those that are located on PEI chains that may remain free in solution. Several experimental studies have suggested that a large portion of PEI chains remain free in commonly prepared gene delivery systems and that these free PEI chains can enhance the transfection efficiency significantly.5,51,52 It has been estimated that about 3 portions of PEI chains were actually bound to the nucleic acid, while 7 portions of PEI chains were free in a polyplex solution prepared at N/P = 10, a mixing ratio that often gives the highest transfection efficiency.51 This implies that N/P = 3 in the actual complex. The sequential addition simulations led to the formation of polyplexes with 7 PEI chains, giving N/P = 3.5, while the simultaneous addition simulations led to the formation of polyplexes with N/P = 3.5 or 4. We consider these two numbers not too far from experimental estimates.
One property that is revealed by the structures of the polyplexes shown in Figure 1 is that PEI chains have limited mobility after they bind to the nucleic acid. For example, the first PEI chain that binds to both DNA and siRNA (shown in blue in Figure 1) remains in roughly the same location on the nucleic acid as additional PEI chains join the polyplex. To further quantify this behavior, we determined the specific DNA bases that interact with each PEI chain throughout the simulation, where a DNA base was considered to interact with a PEI chain if any non-hydrogen atom of the DNA base was within 3.5 Å of any nitrogen atom of the PEI chain. DNA bases are numbered so that the first strand of the duplex is numbered 1 to 21, the second strand is 22 to 42, and bases numbered 1 and 42, 2 and 41, …, and 21 and 22 are base-paired. The first PEI chain added to the DNA system initially interacts with DNA bases 6 to 10 and 37 to 39 (Figure 2). While the PEI chain retains some local mobility and interactions with other DNA bases develop, the interactions with bases 7 to 9 and 38 to 40 are maintained throughout the simulation, acting as an anchor that limits the movement of the PEI after it binds to the nucleic acid. Similar behavior was observed for other PEI chains in both DNA and siRNA polyplexes (Supplementary Figure S1). This result indicates that care must be taken when constructing the initial configurations when simulating polyelectrolyte complexation. The structure of the complex can be highly dependent on the first interactions that develop between the oppositely charged polyelectrolyte; initial configurations that place polyelectrolyte chains too closely together can bias these first interactions and impact complex structures. The anchoring of PEI chains on the nucleic acid after the first interactions between the polyelectrolytes develop may explain why the simultaneous addition polyplexes sometimes contained an additional PEI chain (and had a higher N/P ratio) than the sequential addition polyplexes. As PEI-nucleic acid interactions are stable on the timescale of atomistic simulations, PEI chains that bind to a nucleic acid are likely to remain bound throughout the simulation. Thus, if the PEI chains in the simultaneous addition simulations initially bound to the nucleic acid in a configuration that allowed 8 PEI chains to access the nucleic acid negative charges, stable complexes containing 8 PEI chains would result. Alternatively, it is possible that sequential addition simulations would eventually result in the formation of complexes containing 8 PEI chains if the simulations were extended.
Figure 2.
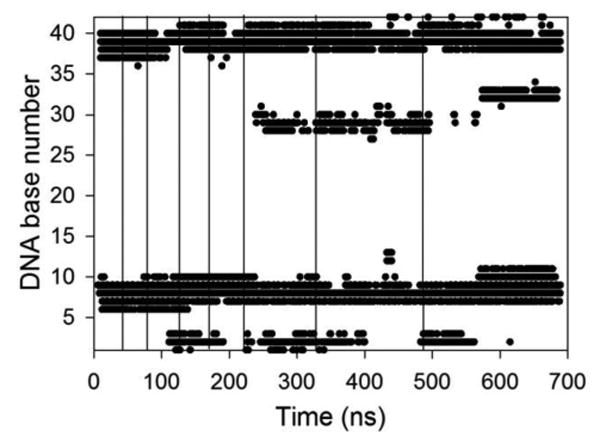
DNA bases that interact with the first PEI chain added to the sequential addition system as a function of time. DNA bases 1 to 21 are one strand of the duplex, while bases 22 to 42 are the other strand. Bases numbered 21 and 22, 20 and 23, etc. are basepairs. The vertical lines indicate the times at which additional PEI chains were added to the system.
1. A. Change inversion during polyplex formation
The formation of significantly overcharged complexes during sequential addition simulations involves complexation between a positively charged PEI chain and a positively charged polyplex. To further quantify the charge distribution around the polyplex, we calculated the net charge of the solution surrounding the nucleic acid chain by counting the cumulative number of Na+, Cl-, and protonated PEI nitrogen atoms as a function of distance from the C1′ atom of the nucleic acid, which is located at the junction of the sugar ring and backbone of the nucleic acid (Figure 3). The net charge of the solution near the DNA (<10 Å from the C1′ atoms) becomes slightly positive after only 4 PEI chains bind to the DNA, well before added PEI chains stop binding to the complex. These results confirm that PEI chains spontaneously bind to overcharged polyplexes. The net charge curves for simulations with siRNA are, in many cases, similar to those for DNA with a corresponding number of PEI chains (Figure 4). A difference in the net charge surrounding the DNA and siRNA develops when the nucleic acids are nearly saturated with PEI chains (i.e., when the number of bound PEI chains exceeds five). The DNA/PEI complex shows a more positive net charge than the siRNA/PEI complex. As we will discuss more fully in Section 2, this difference can be traced to the DNA interacting with more protonated PEI amines than siRNA.
Figure 3.
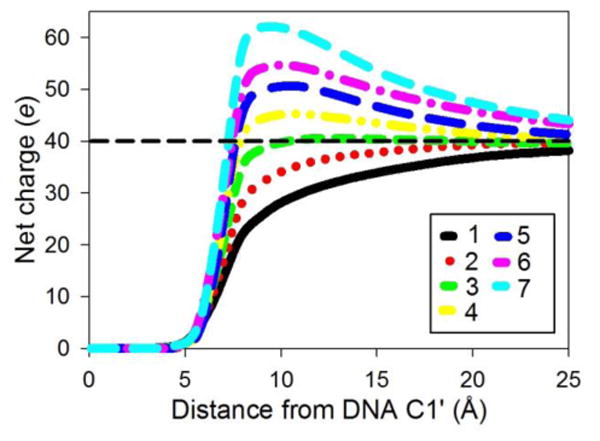
Net charge as a function of the distance from DNA C1′ atoms for complexes with 1 to 7 PEI chains (from bottom to top). Net charge considers the number of Na+, Cl-, and protonated PEI nitrogen atoms surrounding the DNA. The dashed horizontal line indicates the charge that is needed to neutralize the negative charge of the DNA. The figure legend indicates the number of PEI chains that are in the complex.
Figure 4.
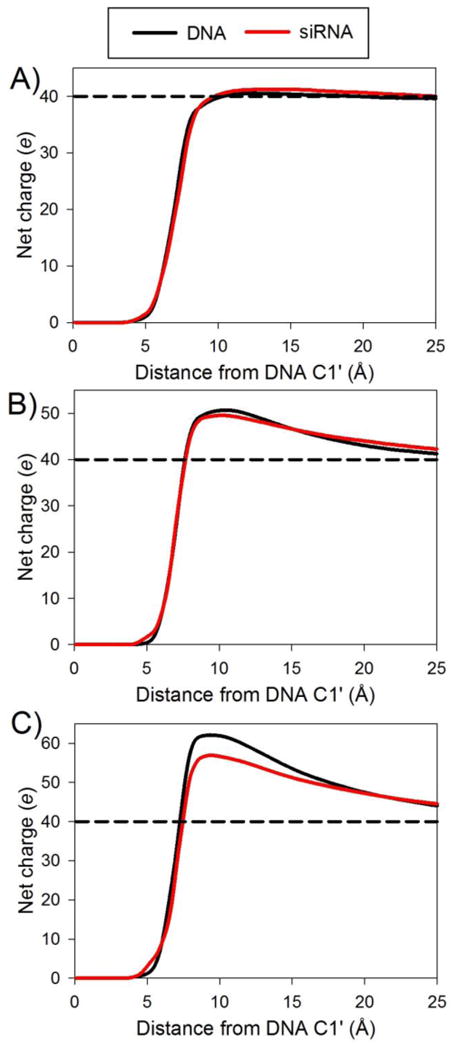
The net charge surrounding the DNA and siRNA for complexes with (a) 3, (b) 5, and (c) 7 PEI chains. The dashed horizontal line indicates the charge that is needed to neutralize the negative charge of the nucleic acid duplex.
In order to understand how a PEI chain binds with an already overcharged polyplex, we calculated electrostatic potential surfaces surrounding the polyplex by solving the non-linear Poisson-Boltzmann equation (PB calculations). The calculations were performed after all water molecules and ions were stripped from a simulation snapshot and only the atoms of the nucleic acids and PEI chains were retained. Electrostatic surfaces with +1 kBT and -1 kBT (Figure 5) were visualized with VMD.42 These calculations show that there are still large patches of negative electrostatic potential surface even after the polyplex has developed a positive net charge, indicating that there are locations where an additional PEI chain could bind and develop attractive electrostatic interactions. For example, much of the upper half of the polyplex composed of DNA and 5 PEI chains (overall polyplex charge = +10) has a negative electrostatic potential (Figures 5a). Not surprisingly, PEI chain 6 was found to bind to this region with a negative electrostatic potential. After 7 PEI chains have bound to the DNA, the majority of the complex surface now has a positive electrostatic potential (Figure 5b). Similarly, the polyplex containing siRNA and 5 PEI chains (overall polyplex charge = +10) has large portions of its surface that have a negative electrostatic potential (Figure 5c), while the surface of the siRNA polyplex containing 7 PEI chains is mostly positive (Figure 5d).
Figure 5.
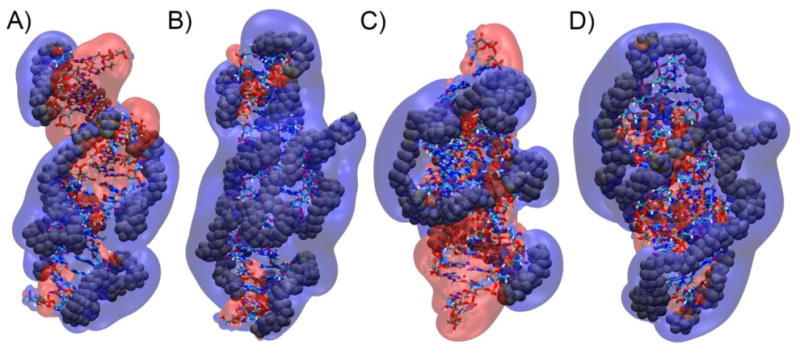
Electrostatic potential surface maps from sequential addition simulations of (a) DNA and 5 PEI chains, (b) DNA and 7 PEI chains, (c) siRNA and 5 PEI chains, and (d) siRNA and 7 PEI chain. Electrostatic potential surfaces with a cutoff of +1 kBT (blue) and -1 kBT (red) surrounding the polyplexes are shown.
1. B. Release of counterions and water during sequential addition of PEI
While the complexation of oppositely charged polyelectrolytes involves the formation of attractive electrostatic interactions between the chains, the complexation process is believed to be driven by the entropy gain associated with the release of counterions53,54 and water22,23 that are bound to the individual polyelectrolyte chains. The sequential addition method allows for closely monitoring the counterions and water molecules surrounding a nucleic acid duplex as it becomes increasingly saturated with PEI chains (Figure 6). As PEI chains are added to the simulation system, they bind to the nucleic acid, and the total number of PEI nitrogen atoms interacting with the DNA (i.e., the number of PEI nitrogens within 4 Å of any nucleic acid atom) steadily increases, as expected (Figure 6a). An exception to this trend occurs when the final PEI chain binds to the siRNA, as the number of PEI nitrogen-siRNA interactions increases only slightly when the seventh PEI chain joins the polyplex, as several interactions between PEI chain 5 and the siRNA break as PEI chain 7 binds to the complex.
Figure 6.
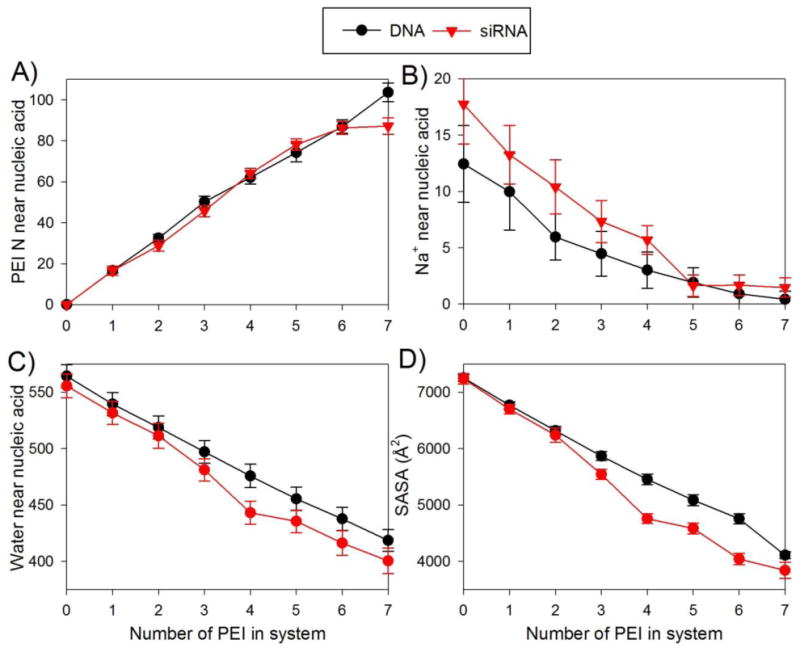
Number of (a) PEI nitrogen atoms and (b) Na+ ions within 4 Å of any nucleic acid atom as a function of the number of PEI chains in the system. (c) Number of water molecules within 3 Å of the nucleic acid and (d) solvent accessible surface area (SASA) of the nucleic acid as a function of the number of PEI chains. All data are averaged over the last 50 ns of their respective simulation; error bars are standard deviations.
As the PEI chains bind to the nucleic acid, both counterions and water are released from the nucleic acid, increasing the entropy of the system, but the specifics of the release of these two species show different behavior (Figure 6, b and c). First, while several Na+ ions are released from the nucleic acid when the first few PEI chains bind, the number of Na+ released decreases significantly as more PEI chains bind to the nucleic acid. After 5 PEI chains have bound to the nucleic acid and the complex has a significant positive charge, there are fewer than 2 Na+ ions near the nucleic acid and little counterion release from the nucleic acid occurs as additional PEI chains bind. Figure 6b shows only data for Na+ ions that are directly bound to (within 4 Å of) the nucleic acid; therefore, it is possible that there is a significant release of ions that more loosely interact with the nucleic acid as the final PEI chains bind, and the release of these loosely bound counterions could drive complex formation. Therefore, we calculated the number of Na+ ions within 15 Å of the C1′ atoms of the nucleic acid to estimate how many loosely bound counterions were released from the DNA as the final PEI chain binds to the complex. The number of Na+ ions within 15 Å of the C1′ atoms of DNA decreases from 5.7 to 4.6 after binding of the seventh PEI, and this number decreases from 6.7 to 5.6 after binding of the seventh PEI chain to the siRNA.
The previous discussion of counterion release and the data in Figure 6b has only considered the release of Na+ from the nucleic acid, neglecting the Cl- ions in the system. Cl- ions are largely excluded from the region surrounding a negatively charged polyplex, as 2 or fewer Cl- are within 10 Å of the C1′ atoms of the DNA or siRNA when 2 or fewer PEI chains are bound to the nucleic acid. As the polyplex becomes positively charged, the number of Cl- near the polyplex increases. Approximately 6 Cl- ions and 3 Na+ are within 10 Å of the C1′ atoms of the DNA or siRNA in a polyplex with 7 PEI chains and a net charge of +30, resulting in the salt ions in the solution surrounding the polyplex having a net negative charge. The release of Cl- from the PEI chains shows similar behavior to the release of Na+ from the nucleic acids; while Cl- release is involved in the binding of the first PEI chains to the nucleic acid, few Cl- ions are released during binding of PEI chains to overcharged complexes. A single free PEI chain directly interacts with (i.e., is within 5 Å of) an average of 1.7 Cl- ions, and the PEI chain in a polyplex containing a single PEI chain and the DNA duplex directly interacts with only 0.3 Cl- ions. Thus, approximately 1.4 Cl- are released by the binding of the first PEI chain to the DNA. As more PEI chains bind, the polyplex develops a positive charge, attracting Cl- ions, and decreasing the amount of Cl- release. In some cases, we observe an increase in the number of bound Cl- ions as additional PEI chains join an overcharged polyplex. The PEI chains in the DNA polyplex with 6 PEI chains are bound to an average of 4.9 Cl- ions, indicating that (1.7*6 – 4.9 =) 5.3 Cl- ions were released from the PEI chains as the polyplex formed. However, the PEI chains in the DNA polyplex with 7 PEI chains were bound to 7.3 Cl- ions, indicating that only (1.7*7 – 7.3 =) 4.6 Cl- ions were released. Therefore, we find that there is little release of both Na+ and Cl- ions during the binding of the final PEI chains to the polyplex. We note that the binding of small ions to nucleic acids observed in atomistic simulations has been shown to depend on the model parameters used for the ions.47,55,56 The simulations here have used only a single ion model, and it is possible that other ion models may result in different behavior.
In contrast to the sharp decrease in the extent of counterion release as PEI chains continue to bind to the nucleic acid, the number of water molecules in the first hydration shell of the nucleic acid (within 3 Å) decreases rather steadily as each PEI chain binds (Figure 6c). Both siRNA and DNA are directly bound to approximately 560 water molecules (564 ± 10 for DNA and 555 ± 10 for siRNA) before the addition of any PEI chains. Similar numbers of water molecules are released from the siRNA and the DNA during the formation of the polyplex, as an average of 22 and 21 water molecules are released from the nucleic acid each time a PEI chain binds to the siRNA or DNA, respectively. Even though the binding of the final PEI chain to the siRNA does not increase the total number of PEI nitrogen-siRNA interactions, its presence still results in a large reduction in the number of water molecules in the first hydration shell of the siRNA, as the number of water molecules near the nucleic acid decreases by 16 when the final PEI chain binds. We analyzed the water release for both the sequential addition simulations and simultaneous addition simulations and found that the number of waters released between the two systems were comparable. The numbers of water molecules released from the DNA and siRNA when averaged over all simulations were very similar (160 ± 12 for DNA and 157 ± 6 for siRNA). To complement these results, we calculated the solvent-accessible surface area (SASA) for both nucleic acid chains as the PEI chains bind (Figure 6d). The SASA's of the DNA and siRNA duplexes are similar before the binding of PEI chains (7255 ± 61 Å2 for DNA and 7240 ± 96 Å2 for siRNA), and the SASA decreases as the PEI chains bind in a manner roughly parallel to the decrease in the number of bound water molecules.
While the number of bound water molecules and SASA of the nucleic acid, in general, decreases steadily as the PEI chains bind, one may notice a small difference between PEI/DNA and PEI/siRNA complexes in Figure 6c and 6d. The binding of the third and fourth PEI chains to the siRNA is associated with a large decrease in both the number of bound waters and the SASA of the nucleic acid. To explain this result, we examined the radius of gyration (Rg) of the nucleic acid chains as PEI chains were added to system (Figure 7). While the Rg of the DNA remains relatively constant, the siRNA Rg decreases considerably and has a smaller variance as the PEI chains bind, behavior that has been observed previously in atomistic simulations of PEI/siRNA complexes.24 The decrease in Rg of the siRNA begins upon binding of the third PEI chain and continues when the fourth PEI chain binds, explaining the behavior seen in the number of bound waters and SASA of the siRNA. The siRNA remains in this more compact conformation throughout the remainder of the simulation. We analyzed structural details of the siRNA before the binding of PEI chains and the siRNA in a polyplex while bound to 7 PEI chains to reveal the conformational changes that accompanied the change in Rg. The analysis showed that the conformational change was not caused by disrupting a basepair or some other large deformation at a single site in the duplex, but was, instead, associated with contraction throughout the entire duplex. The helical rise between basepairs decreased from 2.8 ± 0.2 Å for a free siRNA duplex to 2.4 ± 0.4 Å in the PEI polyplex. While the minor groove width stayed relatively constant, the width of the major groove width decreased by average of approximately 3 Å during the complexation process. Additionally, the siRNA structure remained consistent with an A form nucleic acid; 88% of the siRNA basepairs in the polyplex were classified as being in the A form by 3DNA,44,45 compared to 91% of the basepairs in a free siRNA duplex. These analyses indicate that siRNA may experience some conformational contraction when PEI binds.
Figure 7.
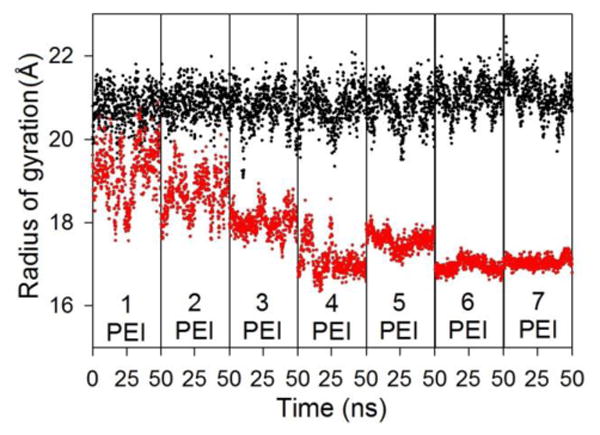
Radius of gyration of the DNA (black) or siRNA (red) duplex as a function of time over the last 50 ns of simulations with 1 to 7 PEI chains.
In summary, the sequential addition simulations have allowed us to monitor the kinetics of polyplex formation. We found that PEI chains can be observed to spontaneously bind to nucleic acid complexes that carry a net positive charge. Electrostatic potential maps of the complexes show that there can be large areas on the nucleic acid surface with a negative potential even when the complex carries a net positive charge overall. Therefore, attractive electrostatic interactions between the PEI and these negative areas on the nucleic acid surface can develop even when the overall charge of the polyplex is positive. Additionally, PEI chains were able to bind to nucleic acids that had already released the majority of their bound counterions. These binding events were associated with a decrease in the number of water molecules bound to the nucleic acid surface, indicating the importance of water release as a driving force in the complexation process.
2. PEI binding sites for siRNA and DNA
In the remainder of this paper, we will discuss complex structures after the nucleic acid duplex is saturated with PEI chains, focusing on polyplexes containing a nucleic acid and 7 PEI chains formed using sequential addition simulations, supplemented by structural analysis of polyplexes formed during simultaneous addition simulations. Atomistic molecular dynamics simulations have been used previously to determine the specific locations on a DNA or siRNA duplex where PEI chains bind.16,20,24,50 In general, these simulations have found that the nitrogen atoms of PEI chains with protonation states similar to the 50% protonation used here most commonly interact with the oxygen atoms of phosphate groups of the nucleic acid backbone and that interactions with electronegative atoms in the nucleic acid groove sites are much less prevalent.16,18 Both the sequential addition and simultaneous addition simulations performed here agree with these results, as 85-90% of the direct interactions between a PEI nitrogen atom and an electronegative nucleic acid atom (i.e., the PEI nitrogen was within 3.5 Å of the nucleic acid atom) involved an O1P or O2P phosphate oxygen atom for both DNA and siRNA (Table 1). In many cases, the PEI chains are aligned with the major or minor grooves, enabling interaction with the phosphate groups on both sides of the groove, but they usually remain near the surface of the grooves and do not sufficiently penetrate the grooves to allow for direct interaction with electronegative groove atoms. An occasional PEI chain, however, did enter the major grooves of both DNA and siRNA. For example, a single PEI chain (shown in green in Figure 1c) entered the major groove of DNA enough to create an average of 6 interactions with electronegative atoms in the major groove. Similarly, the majority of the major groove interactions in the siRNA sequential addition simulation were with one PEI chain (shown in red in Figure 1e and f) that had 4 nitrogens interact with major groove atoms. These major groove interactions were long-lasting, as both of these PEI chains were in the major groove for longer than the final 100 ns of the simulations.
Table 1. Interactions between PEI nitrogen atoms and electronegative nucleic acid atoms.
| Nucleic acid duplex (42 bases) | Number of PEI chains bound | Overall complex N/P ratio | Contacts with major groove atomsa | Contacts with minor groove atomsa | Contacts with O1P and O2P atomsa | Total N contactsa | N/P contact ratio | Total N+ contactsa | N+/P contact ratio |
|---|---|---|---|---|---|---|---|---|---|
| siRNA | 7 | 3.5 | 5 ± 2 | 2 ± 1 | 77 ± 3 | 90 ± 4 | 2.2 ± 0.1 | 45 ± 2 | 1.1 ± 0.1 |
| DNA | 7 | 3.5 | 8 ± 2 | 1 ± 1 | 86 ± 5 | 99 ± 6 | 2.5 ± 0.1 | 55 ± 3 | 1.4 ± 0.1 |
Average number (± standard deviation) of PEI nitrogen atoms within 3.5 Å of nucleic acid atoms
In addition to showing that PEI primarily interacts with the phosphate groups of DNA and siRNA, Table 1 also compares the N/P ratio, the ratio of PEI nitrogen atoms to nucleic acid phosphate groups, for the simulations performed here. Since not all nitrogen atoms of bound PEI chains are in direct contact with the nucleic acid, we also calculated the N/P contact ratio by considering only PEI nitrogens that actually interact with the nucleic acid chains, and the N+/P contact ratio, which considers only protonated PEI nitrogens. Both the N/P and N+/P contact ratios are higher for DNA polyplexes than for corresponding siRNA polyplexes, indicating that, on a per charge basis, DNA was able to bind to a larger number of PEI nitrogens (and protonated PEI nitrogens in particular) than siRNA. The difference between the DNA and siRNA N/P contact ratios can be attributed to the difference in the N+/P contact ratio. The PEI/DNA complex has a total of 99 contacts, of which 55 are made by protonated nitrogen atoms (N+); the PEI/siRNA complex has a total of 89 contacts, of which 45 contacts were made by protonated nitrogens. Therefore, the ratio of bound N+ atoms to bound unprotonated nitrogen atoms (N0) was higher in the DNA polyplex than in the siRNA polyplex (N+/N0 = 1.25 for DNA and N+/N0 = 1.0 for siRNA). We note that the difference in this ratio was not due to the behavior of only 1 or 2 PEI chains, but was widely observed for all bound PEI chains throughout the simulations. For example, 6 of the 7 PEI chains bound to DNA in the final sequential addition simulation had a bound N+/N0 ratio of 1.15 or greater, while only 1 of the 7 PEI chains bound to the siRNA in the final sequential addition simulation had a bound N+/N0 ratio greater than this value. Similar behavior was also observed in complexes that were obtained using simultaneous addition simulations in which 10 PEI chains were all placed near the nucleic acid duplex (Supplementary Table S4). The DNA polyplexes in the simultaneous addition simulation had more total PEI nitrogen-nucleic acid interactions and a higher N+/N0 ratio than the siRNA polyplexes.
Therefore, while the dominant interactions in both PEI-DNA and PEI-siRNA complexes are between PEI nitrogen atoms and nucleic acid phosphate groups, there is a difference between the binding of PEI to DNA and to siRNA that allows for more PEI nitrogens, and in particular protonated PEI nitrogens, to interact with DNA. One reason for this difference is that protonated PEI nitrogen atoms almost exclusively interact with a single DNA phosphate group at a given time, while PEI chains bound to siRNA often have nitrogen atoms that lie between two different phosphate groups and interact with both phosphates simultaneously. Specifically, less than 2% of protonated PEI amines interacted with two different DNA phosphate groups (i.e., were within 5 Å of two different P atoms) at the same time, while 30% of protonated PEI nitrogens that interact with siRNA phosphate groups interact with two phosphate groups simultaneously. Hence, fewer protonated PEI nitrogens will be required to cover the phosphate groups of the A form siRNA, which are closer together than those of the B form DNA.
Conclusions
We performed a series of atomistic molecular dynamics simulations of linear PEI chains binding to DNA and siRNA duplexes to investigate the structures of polyplexes formed with DNA and siRNA. In the current study, we only focus on differences that might arise from the differing atomic structures of B-form DNA and A-form siRNA, as both nucleic acids investigated here contain 42 bases. The difference between the lengths of plasmid DNA and a typical siRNA molecule and how that may impact the polyplex structure formed is not accounted for in this study. The atomistic detailed simulations performed here allow us to find the actual N/P ratio in the polyplex structures formed. In agreement with experimental estimates, in an actual polyplex counting only PEI chains bound to nucleic acids, the N/P ratio is about 3.5 to 4 and the polyplex is positively overcharged. This confirms that, in PEI-based delivery system where the employed N/P ratio typically is around 10 or higher, a large portion of PEI chains exist as free PEI chains and these free PEI chains can enhance gene delivery transfection efficiency greatly as suggested by experimental studies.51 The formation of overcharged polyplex can be traced to the electrostatic potential surrounding the polyplex. Overcharged polyplexes that were not saturated with PEI chains contained regions of negative electrostatic potential. The additional PEI chains were able to bind to these regions, forming favorable electrostatic interactions via the release of surface waters.
We found that the primary mode of binding for both DNA and siRNA involved interactions between PEI amine groups and nucleic acid phosphate groups. There was a limited, but similar, amount of interaction between PEI and electronegative atoms in the grooves of either nucleic acid, despite the large differences in the groove widths and depths for the A form siRNA and B form DNA. However, DNA was able to interact with both a larger number of PEI nitrogens and a higher proportion of protonated PEI nitrogens than siRNA. Therefore, dissolution of a PEI/DNA complex would result in breaking more attractive interactions than in a similar PEI/siRNA complex. Additionally, the structure of the siRNA duplex in the polyplex was different than its structure when free in solution. The radius of gyration of the siRNA both decreased and had less variance when in the polyplex, indicating that there may be a loss of configurational entropy in the siRNA when the polyplex forms, making complexation less energetically favorable.
We also observed the release of water and ions as PEI chains bound to the nucleic acid, driving the complexation process. The numbers of water molecules and ions released during the formation of PEI/DNA and PEI/siRNA complexes can in principle be tested by isothermal titration calorimetry.57,58 Previous experiments have shown that there is a release of ∼1 mole of Na+ ions from DNA for each mole of ionized units of polycation that bind to DNA.58 This result suggests that the majority of Na+ ions would be released from the DNA once the polyplex becomes neutral,59 and, in agreement with our simulations, the binding of PEI chains to create an overcharged complex may not involve significant counterion release. It would be of great interest to more directly compare these simulations with experimental data. Additionally, further simulations, such as coarse-grained simulations that will allow for the investigation of the impact of the large difference in the lengths of DNA and siRNA duplexes and atomistic simulations that more directly probe the stability of the polylexes, could be used to more fully understand the causes of the difference in the stability of PEI/DNA and PEI/siRNA complexes.
Supplementary Material
Acknowledgments
We acknowledge partial financial support for this work from NIH/NIGSM,1R15GM106326-01A and from NSF CHE-1156738. NJW is an REU participant supported by NSF CHE-1156738.
Footnotes
Supporting Information: Descriptions of atom types mentioned in the manuscript, details of the sequential addition and simultaneous addition simulations, numbers of interactions between PEI chains and DNA or siRNA in simultaneous addition simulations, and the nucleic acid bases that interact with selected PEI chains during sequential addition simulations as a function of time.
References
- 1.Ginn SL, Alexander IE, Edelstein ML, Abedi MR, Wixon J. Gene Therapy Clinical Trials Worldwide to 2012 - an Update. J Gene Med. 2013;15:65–77. doi: 10.1002/jgm.2698. [DOI] [PubMed] [Google Scholar]
- 2.Lächelt U, Wagner E. Nucleic Acid Therapeutics Using Polyplexes: A Journey of 50 Years (and Beyond) Chem Rev. 2015;115:11043–11078. doi: 10.1021/cr5006793. [DOI] [PubMed] [Google Scholar]
- 3.Scholz C, Wagner E. Therapeutic Plasmid DNA versus siRNA Delivery: Common and Different Tasks for Synthetic Carriers. J Controlled Release. 2012;161:554–565. doi: 10.1016/j.jconrel.2011.11.014. [DOI] [PubMed] [Google Scholar]
- 4.Navarro G, Pan J, Torchilin VP. Micelle-like Nanoparticles as Carriers for DNA and siRNA. Mol Pharmaceutics. 2015;12:301–313. doi: 10.1021/mp5007213. [DOI] [PMC free article] [PubMed] [Google Scholar]
- 5.Yue Y, Wu C. Progress and Perspectives in Developing Polymeric Vectors for in Vitro Gene Delivery. Biomater Sci. 2013;1:152–170. doi: 10.1039/c2bm00030j. [DOI] [PubMed] [Google Scholar]
- 6.Yin H, Kanasty RL, Eltoukhy AA, Vegas AJ, Dorkin JR, Anderson DG. Non-Viral Vectors for Gene-Based Therapy. Nat Rev Genet. 2014;15:541–555. doi: 10.1038/nrg3763. [DOI] [PubMed] [Google Scholar]
- 7.Buscail L, Bournet B, Vernejoul F, Cambois G, Lulka H, Hanoun N, Dufresne M, Meulle A, Vignolle-Vidoni A, Ligat L, et al. First-in-Man Phase 1 Clinical Trial of Gene Therapy for Advanced Pancreatic Cancer: Safety, Biodistribution, and Preliminary Clinical Findings. Mol Ther. 2015;23:779–789. doi: 10.1038/mt.2015.1. [DOI] [PMC free article] [PubMed] [Google Scholar]
- 8.He D, Wagner E. Defined Polymeric Materials for Gene Delivery. Macromol Biosci. 2015;15:600–612. doi: 10.1002/mabi.201400524. [DOI] [PubMed] [Google Scholar]
- 9.Zheng C, Niu L, Pan W, Zhou J, Lv H, Cheng J, Liang D. Long-Term Kinetics of DNA Interacting with Polycations. Polymer. 2014;55:2464–2471. [Google Scholar]
- 10.Richards Grayson AC, Doody AM, Putnam D. Biophysical and Structural Characterization of Polyethylenimine-Mediated siRNA Delivery in Vitro. Pharm Res. 2006;23:1868–1876. doi: 10.1007/s11095-006-9009-2. [DOI] [PubMed] [Google Scholar]
- 11.Kwok A, Hart SL. Comparative Structural and Functional Studies of Nanoparticle Formulations for DNA and siRNA Delivery. Nanomedicine: Nanotechnology, Biology, and Medicine. 2011;7:210–219. doi: 10.1016/j.nano.2010.07.005. [DOI] [PubMed] [Google Scholar]
- 12.Pereira P, Jorge AF, Martins R, Pais AACC, Sousa F, Figueiras A. Characterization of Polyplexes Involving Small RNA. J Colloid Interface Sci. 2012;387:84–94. doi: 10.1016/j.jcis.2012.07.088. [DOI] [PubMed] [Google Scholar]
- 13.Perevyazko IY, Bauer M, Pavlov GM, Hoeppener S, Schubert S, Fischer D, Schubert US. Polyelectrolyte Complexes of DNA and Linear PEI: Formation, Composition and Properties. Langmuir. 2012;28:16167–16176. doi: 10.1021/la303094b. [DOI] [PubMed] [Google Scholar]
- 14.Tian W, Ma Y. Theoretical and Computational Studies of Dendrimers as Delivery Vectors. Chem Soc Rev. 2013:705–727. doi: 10.1039/c2cs35306g. [DOI] [PubMed] [Google Scholar]
- 15.Meneksedag-Erol D, Tang T, Uludaǧ H. Molecular Modeling of Polynucleotide Complexes. Biomaterials. 2014;35:7068–7076. doi: 10.1016/j.biomaterials.2014.04.103. [DOI] [PubMed] [Google Scholar]
- 16.Ziebarth J, Wang YM. Molecular Dynamics Simulations of DNA-Polycation Complex Formation. Biophys J. 2009;97:1971–1983. doi: 10.1016/j.bpj.2009.03.069. [DOI] [PMC free article] [PubMed] [Google Scholar]
- 17.Zheng M, Pavan GM, Neeb M, Schaper AK, Danani A, Klebe G, Merkel OM, Kissel T. Targeting the Blind Spot of Polycationic Nanocarrier-Based siRNA Delivery. ACS Nano. 2012;6:9447–9454. doi: 10.1021/nn301966r. [DOI] [PMC free article] [PubMed] [Google Scholar]
- 18.Antila H, Härkönen M, Sammalkorpi M. Chemistry Specificity of DNA-Polycation Complex Salt Response: A Simulation Study of DNA, Polylysine and Polyethyleneimine. Phys Chem Chem Phys. 2015;17:5279–5289. doi: 10.1039/c4cp04967e. [DOI] [PubMed] [Google Scholar]
- 19.Sun C, Tang T, Uludaǧ H. Molecular Dynamics Simulations of PEI Mediated DNA Aggregation. Biomacromolecules. 2011;12:3698–3707. doi: 10.1021/bm2009476. [DOI] [PubMed] [Google Scholar]
- 20.Sun C, Tang T, Uludaǧ H, Cuervo JE. Molecular Dynamics Simulations of DNA/PEI Complexes: Effect of PEI Branching and Protonation State. Biophys J. 2011;100:2754–2763. doi: 10.1016/j.bpj.2011.04.045. [DOI] [PMC free article] [PubMed] [Google Scholar]
- 21.Bagai S, Sun C, Tang T. Potential of Mean Force of Polyethylenimine-Mediated DNA Attraction. J Phys Chem B. 2013;117:49–56. doi: 10.1021/jp308132y. [DOI] [PubMed] [Google Scholar]
- 22.Wei Z, Luijten E. Systematic Coarse-Grained Modeling of Complexation between Small Interfering RNA and Polycations. J Chem Phys. 2015;143(24):243146. doi: 10.1063/1.4937384. [DOI] [PMC free article] [PubMed] [Google Scholar]
- 23.Sun C, Tang T, Uludaǧ H. Molecular Dynamics Simulations for Complexation of DNA with 2 kDa PEI Reveal Profound Effect of PEI Architecture on Complexation. J Phys Chem B. 2012;116:2405–2413. doi: 10.1021/jp211716v. [DOI] [PubMed] [Google Scholar]
- 24.Sun C, Tang T, Uludag H. A Molecular Dynamics Simulation Study on the Effect of Lipid Substitution on Polyethylenimine Mediated siRNA Complexation. Biomaterials. 2013;34:2822–2833. doi: 10.1016/j.biomaterials.2013.01.011. [DOI] [PubMed] [Google Scholar]
- 25.Wagner M, Rinkenauer AC, Schallon A, Schubert US, Fire A, Xu SQ, Montgomery MK, Kostas SA, Driver SE, Mello CC, et al. Opposites Attract: Influence of the Molar Mass of Branched Poly(ethylene Imine) on Biophysical Characteristics of siRNA-Based Polyplexese. RSC Adv. 2013;3:12774. [Google Scholar]
- 26.Pavan GM, Kostiainen Ma, Danani A. Computational Approach for Understanding the Interactions of UV-Degradable Dendrons with DNA and siRNA. J Phys Chem B. 2010;114:5686–5693. doi: 10.1021/jp911439q. [DOI] [PubMed] [Google Scholar]
- 27.Pavan GM, Mintzer Ma, Simanek EE, Merkel OM, Kissel T, Danani A. Computational Insights into the Interactions between DNA and siRNA with “Rigid” and “Flexible” Triazine Dendrimers. Biomacromolecules. 2010;11:721–730. doi: 10.1021/bm901298t. [DOI] [PMC free article] [PubMed] [Google Scholar]
- 28.Ouyang D, Zhang H, Parekh HS, Smith SC. Structure and Dynamics of Multiple Cationic Vectors- siRNA Complexation by All-Atomic Molecular Dynamics Simulations. J Phys Chem B. 2010;114:9231–9237. doi: 10.1021/jp911913c. [DOI] [PubMed] [Google Scholar]
- 29.Ziebarth JD, Wang Y. Understanding the Protonation Behavior of Linear Polyethylenimine in Solutions through Monte Carlo Simulations. Biomacromolecules. 2010;11:29–38. doi: 10.1021/bm900842d. [DOI] [PMC free article] [PubMed] [Google Scholar]
- 30.Koper GJM, Borkovec M. Proton Binding by Linear, Branched, and Hyperbranched Polyelectrolytes. Polymer. 2010;51(24):5649–5662. [Google Scholar]
- 31.Garcés JL, Madurga S, Borkovec M. Coupling of Conformational and Ionization Equilibria in Linear Poly(ethylenimine): A Study Based on the Site Binding/rotational Isomeric State (SBRIS) Model. Phys Chem Chem Phys. 2014;16:4626–4638. doi: 10.1039/c3cp54211d. [DOI] [PubMed] [Google Scholar]
- 32.Goetz AW, Williamson MJ, Xu D, Poole D, Grand SLe, Walker RC. Routine Microsecond Molecular Dynamics Simulations with Amber - Part I: Generalized Born. J Chem Theory Comput. 2012;8:1542–1555. doi: 10.1021/ct200909j. [DOI] [PMC free article] [PubMed] [Google Scholar]
- 33.Salomon-Ferrer R, Götz AW, Poole D, Le Grand S, Walker RC. Routine Microsecond Molecular Dynamics Simulations with AMBER on GPUs. 2. Explicit Solvent Particle Mesh Ewald. J Chem Theory Comput. 2013;9:3878–3888. doi: 10.1021/ct400314y. [DOI] [PubMed] [Google Scholar]
- 34.Le Grand S, Götz AW, Walker RC. SPFP: Speed without compromise—A Mixed Precision Model for GPU Accelerated Molecular Dynamics Simulations. Comput Phys Commun. 2013;184:374–380. [Google Scholar]
- 35.Case DA, Darden TA, Cheatham TE, III, Simmerling CL, Wang J, Duke RE, Luo R, Walker RC, Zhang W, Merz KM, et al. AMBER 12. University of California; San Francisco, CA: 2012. [Google Scholar]
- 36.Case DA, Babin V, Berryman JT, Betz RM, Cai Q, Ceruttie DS, Cheatham TE, III, Darden TA, Duke RE, Gohlke H, et al. AMBER 14. University of California; San Francisco, CA: 2014. [Google Scholar]
- 37.Joung IS, Cheatham TE. Determination of Alkali and Halide Monovalent Ion Parameters for Use in Explicitly Solvated Biomolecular Simulations. J Phys Chem B. 2008;112:9020–9041. doi: 10.1021/jp8001614. [DOI] [PMC free article] [PubMed] [Google Scholar]
- 38.Wang J, Wolf RM, Caldwell JW, Kollman PA, Case DA. Development and Testing of a General Amber Force Field. J Comput Chem. 2004;25:1157–1174. doi: 10.1002/jcc.20035. [DOI] [PubMed] [Google Scholar]
- 39.Ryckaert JP, Ciccotti G, Berendsen HJC. Numerical Integration of the Cartesian Equations of Motion of a System with Constraints: Molecular Dynamics of N-Alkanes. J Comput Phys. 1977;23:327–341. [Google Scholar]
- 40.Miyamoto S, Kollman PA. Settle: An Analytical Version of the SHAKE and RATTLE Algorithm for Rigid Water Models. J Comput Chem. 1992;13:952–962. [Google Scholar]
- 41.Darden T, York D, Pedersen L. Particle Mesh Ewald: An N·log(N) Method for Ewald Sums in Large Systems. J Chem Phys. 1993;98:10089. [Google Scholar]
- 42.Humphrey W, Dalke A, Schulten K. VMD: Visual Molecular Dynamics. J Mol Graphics. 1996;14:33–38. doi: 10.1016/0263-7855(96)00018-5. [DOI] [PubMed] [Google Scholar]
- 43.Roe DR, Cheatham TE. PTRAJ and CPPTRAJ: Software for Processing and Analysis of Molecular Dynamics Trajectory Data. J Chem Theory Comput. 2013;9:3084–3095. doi: 10.1021/ct400341p. [DOI] [PubMed] [Google Scholar]
- 44.Lu XJ, Olson WK. 3DNA: A Software Package for the Analysis, Rebuilding and Visualization of Three-Dimensional Nucleic Acid Structures. Nucleic Acids Res. 2003;31:5108–5121. doi: 10.1093/nar/gkg680. [DOI] [PMC free article] [PubMed] [Google Scholar]
- 45.Lu XJ, Olson WK. 3DNA: A Versatile, Integrated Software System for the Analysis, Rebuilding and Visualization of Three-Dimensional Nucleic-Acid Structures. Nat Protoc. 2008;3:1213–1227. doi: 10.1038/nprot.2008.104. [DOI] [PMC free article] [PubMed] [Google Scholar]
- 46.Baker NA, Sept D, Joseph S, Holst MJ, McCammon JA. Electrostatics of Nanosystems: Application to Microtubules and the Ribosome. Proc Natl Acad Sci U S A. 2001;98:10037–10041. doi: 10.1073/pnas.181342398. [DOI] [PMC free article] [PubMed] [Google Scholar]
- 47.Robbins TJ, Ziebarth JD, Wang Y. Comparison of Monovalent and Divalent Ion Distributions around a DNA Duplex with Molecular Dynamics Simulation and a Poisson-Boltzmann Approach. Biopolymers. 2014;101:834–848. doi: 10.1002/bip.22461. [DOI] [PMC free article] [PubMed] [Google Scholar]
- 48.Shannon RD. Revised Effective Ionic Radii and Systematic Studies of Interatomic Distances in Halides and Chalcogenides. Acta Crystallogr Sect A. 1976;32:751–767. [Google Scholar]
- 49.Elder RM, Jayaraman A. Molecular Simulations of Polycation-DNA Binding Exploring the Effect of Peptide Chemistry and Sequence in Nuclear Localization Sequence Based Polycations. J Phys Chem B. 2013;117:11988–11999. doi: 10.1021/jp406875a. [DOI] [PubMed] [Google Scholar]
- 50.Sun C, Tang T, Uludaǧ H. Probing the Effects of Lipid Substitution on Polycation Mediated DNA Aggregation: A Molecular Dynamics Simulations Study. Biomacromolecules. 2012;13:2982–2988. doi: 10.1021/bm301045b. [DOI] [PubMed] [Google Scholar]
- 51.Yue Y, Jin F, Deng R, Cai J, Chen Y, Lin MCM, Kung HF, Wu C. Revisit Complexation between DNA and Polyethylenimine - Effect of Uncomplexed Chains Free in the Solution Mixture on Gene Transfection. J Controlled Release. 2011;155:67–76. doi: 10.1016/j.jconrel.2010.10.028. [DOI] [PubMed] [Google Scholar]
- 52.Dai Z, Wu C. How Does DNA Complex with Polyethylenimine with Different Chain Lengths and Topologies in Their Aqueous Solution Mixtures? Macromolecules. 2012;45:4346–4353. [Google Scholar]
- 53.Ou Z, Muthukumar M. Entropy and Enthalpy of Polyelectrolyte Complexation: Langevin Dynamics Simulations. J Chem Phys. 2006;124:154902. doi: 10.1063/1.2178803. [DOI] [PubMed] [Google Scholar]
- 54.Peng B, Muthukumar M. Modeling Competitive Substitution in a Polyelectrolyte Complex. J Chem Phys. 2015;143:243133. doi: 10.1063/1.4936256. [DOI] [PMC free article] [PubMed] [Google Scholar]
- 55.Yoo J, Aksimentiev A. Competitive Binding of Cations to Duplex DNA Revealed through Molecular Dynamics Simulations. J Phys Chem B. 2012;116:12946–12954. doi: 10.1021/jp306598y. [DOI] [PubMed] [Google Scholar]
- 56.Savelyev A, MacKerell AD. Competition among Li +, Na +, K +, and Rb + Monovalent Ions for DNA in Molecular Dynamics Simulations Using the Additive CHARMM36 and Drude Polarizable Force Fields. J Phys Chem B. 2015;119:4428–4440. doi: 10.1021/acs.jpcb.5b00683. [DOI] [PMC free article] [PubMed] [Google Scholar]
- 57.Ganguly M, Wang RW, Marky LA, Gold B. Thermodynamic Characterization of DNA with 3-Deazaadenine and 3-Methyl-3-Deazaadenine Substitutions: The Effect of Placing a Hydrophobic Group in the Minor Groove of DNA. J Phys Chem B. 2010;114:7656–7661. doi: 10.1021/jp101004k. [DOI] [PMC free article] [PubMed] [Google Scholar]
- 58.Bronich T, Kabanov AV, Marky LA. A Thermodynamic Characterization of the Interaction of a Cationic Copolymer with DNA. J Phys Chem B. 2001;105:6042–6050. [Google Scholar]
- 59.Giambaşu GM, Luchko T, Herschlag D, York DM, Case DA. Ion Counting from Explicit-Solvent Simulations and 3D-RISM. Biophys J. 2014;106:883–894. doi: 10.1016/j.bpj.2014.01.021. [DOI] [PMC free article] [PubMed] [Google Scholar]
Associated Data
This section collects any data citations, data availability statements, or supplementary materials included in this article.