

Very rapid, directed movement of pathogen receptors in the plasma membrane is associated with MT close to the inner leaflet.
Abstract
C-type lectins, including dendritic cell–specific intercellular adhesion molecule-3–grabbing nonintegrin (DC-SIGN), are all-purpose pathogen receptors that exist in nanoclusters in plasma membranes of dendritic cells. A small fraction of these clusters, obvious from the videos, can undergo rapid, directed transport in the plane of the plasma membrane at average speeds of more than 1 μm/s in both dendritic cells and MX DC-SIGN murine fibroblasts ectopically expressing DC-SIGN. Surprisingly, instantaneous speeds can be considerably greater. In MX DC-SIGN cells, many cluster trajectories are colinear with microtubules that reside close to the ventral membrane, and the microtubule-depolymerizing drug, nocodazole, markedly reduced the areal density of directed movement trajectories, suggesting a microtubule motor–driven transport mechanism; by contrast, latrunculin A, which affects the actin network, did not depress this movement. Rapid, retrograde movement of DC-SIGN may be an efficient mechanism for bringing bound pathogen on the leading edge and projections of dendritic cells to the perinuclear region for internalization and processing. Dengue virus bound to DC-SIGN on dendritic projections was rapidly transported toward the cell center. The existence of this movement within the plasma membrane points to an unexpected lateral transport mechanism in mammalian cells and challenges our current concepts of cortex-membrane interactions.
INTRODUCTION
Directed plasma membrane transport, as opposed to random lateral diffusion, occurs in the plasma membrane in a number of contexts. For example, directed cell-surface movement of membrane proteins or their ligands is found for the capping of surface receptors (1), surfing of viruses [(2–6); reviewed in the study of Burckhardt and Greber (7)], and neuronal growth cones (8). In most of these examples, speeds on the order of 1 μm/min (~0.02 nm/s) are measured, and the directed transport is actin-based. One exception occurs in the membranes of growth cones, where occasional very rapid, anterograde transport is thought to be driven by an unspecified myosin motor (9, 10) in conjunction with actin. The most prominent example of much more rapid, directed motion on the cell surface is intraflagellar transport (11–13), where transport of TRPV (transient receptor potential vanilloid) channels in the membranes of cilia occurs with velocities exceeding 1 μm/s (14). This movement is associated with ciliary microtubules (MTs). This movement was presaged by the finding that in gliding motility of Chlamydomonas, polystyrene microspheres are driven along flagellar membranes by putative non-dynein mechanochemical MT motors (15). In a more recent work, MT-dependent GABAA (γ-aminobutyric acid type A) receptor transport in nerve growth cone membranes exhibited instantaneous velocities ranging from 0.2 to 1.5 μm/s with an average of 0.3 μm/s, considering stall times (16). This fast, directed surface motion is to be contrasted to rapid intracellular vesicular movement, which usually involves MTs (17). Again, exceptions do exist where actin and not MTs are involved (18).
C-type lectins serve as all-purpose receptors on the surface of immune cells for many pathogens ranging from HIV, Ebola virus, dengue virus (DENV), and Zika virus to yeasts (19). One important C-type lectin, dendritic cell–specific intercellular adhesion molecule–grabbing nonintegrin (DC-SIGN), exists in nanodomains (20) in the plasma membrane of dendritic cells and when ectopically expressed in murine fibroblasts (21, 22). Previously, we showed that, very occasionally, surface DC-SIGN clusters in dendritic cells would be transported in a directed retrograde fashion at high speeds of ~1000 nm/s (21). Using advanced tracking technology and total internal reflectance fluorescence (TIRF) microscopy in which hundreds of clusters can be tracked on a single cell, we were able to investigate this phenomenon in more detail, demonstrating that a small but significant fraction of DC-SIGN clusters undergoes rapid, directed transport in the plane of the plasma membrane at speeds in both dendritic cells and murine fibroblasts transfected with human DC-SIGN. MTs are strongly implicated in the mechanism, but the dynein inhibitor, ciliobrevin, has no demonstrable effect, suggesting that either this motor is not involved or it operates in a protected cortical environment largely impervious to inhibitors. How this rapid transport occurs challenges our current concepts of how lateral movement in the membrane is regulated by actin cortex-membrane interactions because the plasma membrane is underlain by a closely apposed subjacent membrane skeleton meshwork that would seem to prevent this rapid, directed movement (23).
Dendritic cells must transport pathogens they encounter on their leading margins and dendritic projections toward the perinuclear zone for subsequent internalization and processing. We show that DC-SIGN clusters on projections are rapidly and preferentially transported toward the cell center in the plasma membranes of both NIH 3T3 cells expressing DC-SIGN and dendritic cells and that DENV bound to DC-SIGN in dendritic cell projections undergoes similar rapid, predominantly retrograde transport. This unusual mode of plasma membrane transport could provide a mechanism for moving pathogens from attachment to perinuclear processing sites that is much more efficient than diffusion.
RESULTS
Observation of monocyte-derived dendritic cells (MDDCs) or DC-SIGN–expressing NIH 3T3 cells (MX DC-SIGN cells) by TIRF microscopy revealed multiple modes of diffusion exhibited by DC-SIGN clusters, labeled with fluorescent anti–DC-SIGN antibody Fab fragments, on the cell surface, including a small “superdiffusive” fraction undergoing apparently directed, nearly linear motion. This is seen in video S1, where a number of DC-SIGN (red) trajectories are shown, some of which are quite long, sometimes reaching 6 μm; when fluorescently labeled DENVs are added, they are seen to be colocalized and transported along with DC-SIGN (overlay trajectories shown as yellow). Figure 1 and video S2 show more of these DC-SIGN tracks, a number of which colocalized with proximal MTs just inside the cell.
Fig. 1. Trajectories of DC-SIGN clusters and labeled MTs.
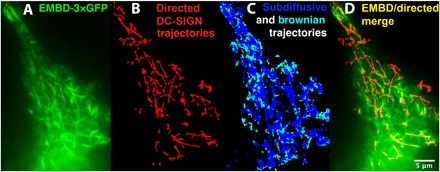
(A) Fluorescence micrograph of ensconsin microtubule-binding domain (EMBD)–3XGFP–labeled MTs (green) in an MX DC-SIGN cell. Note that, to adequately visualize the internal MTs proximate to the ventral surface, we used “dirty TIRF”. GFP, green fluorescent protein. (B) Highly linear trajectories of DC-SIGN clusters exhibiting directed motion collected over the course of 400 s (red). (C) Some of the Brownian (light blue) and subdiffusive (dark blue) trajectories extracted with u-track from this video record. (D) Most directed trajectories are colinear with observable MTs. Trajectories shown were produced from the u-track analysis of a fluorescence video with DCN46-Fab labeling of DC-SIGN, as described in Materials and Methods.
To explore this phenomenon, video recordings of ventral cell surfaces were collected using TIRF microscopy and analyzed using u-track software (24, 25). These motions met the criteria for superdiffusion and the embedded moment scaling spectrum (MSS) analysis (26, 27) used in u-track. Representative distributions of MSS slopes for superdiffusive, Brownian, and subdiffusive motions for DC-SIGN clusters in MX DC-SIGN cells and for DC-SIGN clusters in MDDCs are given in fig. S1.
However, anomalous superdiffusion can encompass a variety of processes, including Levy flights and random diffusion superimposed on a flow as well as highly linear and rapid, directed movements that we are most interested in. Therefore, as described in Materials and Methods, we subjected the data to further classification into those that were quite linear and therefore most likely undergoing highly directed transport using the TrackMate module in ImageJ (28). In addition, we further filtered tracks to those longer than 2 μm. Figure 2 shows representative point-to-point (“instantaneous”) velocities calculated by TrackMate as a function of time (position along the track) for MX DC-SIGN (Fig. 2A, bottom) and MDDC (Fig. 2B, bottom); top panels show the actual trajectories. Note both the points of very small velocity and pauses as well as the intermittent very high instantaneous velocities, especially in dendritic cells; because of this, TrackMate velocities were spot-checked manually. Table 1 gives the mean track length, mean velocity along the trajectory contour, end-to-end velocity, and number of trajectories analyzed for both MX DC-SIGN and MDDC. Under native conditions, the mean contour velocity of the defined directed transport clusters was 3.9 ± 0.050 μm/s (SEM) on MDDCs (367 tracks) and 2.2 ± 0.050 μm/s (SEM) on MX DC-SIGN cells (348 tracks). As expected, the corresponding end-to-end velocities are lower (~2.5 μm/s for dendritic cells versus ~1 μm/s for MX DC-SIGN cells). These speeds are consistent with the vectorial movement of sensory receptors on the surface of cilia, associated with the intraflagellar transport mechanism (14). Whereas some tracks are considerably longer (Fig. 1 and videos S1 and S2), the mean trajectory length for both dendritic and MX DC-SIGN cells is ~3 μm (Table 1).
Fig. 2. Instantaneous velocities of representative DC-SIGN trajectories.
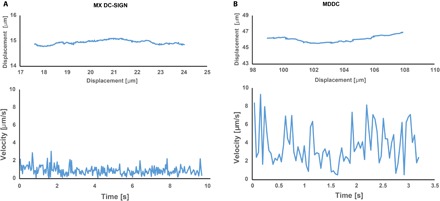
MX DC-SIGN cells (A) and dendritic cells (B). Top panels show the actual trajectories from which the instantaneous velocities were extracted using TrackMate analysis. Bottom panels show the instantaneous velocities measured along each trajectory. Because of the high instantaneous velocities in MDDC, portions of the track velocities plots were double-checked manually.
Table 1. Mean values of parameters characterizing longer (>2 μm), directed transport trajectories of DC-SIGN clusters in native MX DC-SIGN cells and dendritic cells and drug-treated MX DC-SIGN cells.
| Cell |
Length of tracks (μm ± SEM) |
Contour velocity (μm/s ± SEM) | End-to-end velocity (μm/s ± SEM) | Number of tracks |
| Dendritic cells | 3.1 ± 0.060 | 3.9 ± 0.050 | 2.4 ± 0.070 | 367 |
| MX DC-SIGN | 2.8 ± 0.10 | 2.2 ± 0.050 | 0.97 ± 0.040 | 348 |
| Nocodazole | 2.2 ± 0.070 | 2.9 ± 0.090 | 0.91 ± 0.070 | 45 |
| Latrunculin A | 2.7 ± 0.10 | 2.0 ± 0.050 | 1.0 ± 0.050 | 119 |
| Ciliobrevin | 2.3 ± 0.040 | 3.5 ± 0.14 | 1.5 ± 0.11 | 80 |
Because TIRF microscopy has a penetration depth of ~100 nm, we validated that the motions we observed were occurring within the plasma membrane, as opposed to being just inside the cell. First, in three-dimensional imaging of fixed cells, there is no significant amount of DC-SIGN evident just inside the cell (21). Second, all experiments with MX DC-SIGN were conducted in the presence of the inhibitor of clathrin-mediated endocytosis, chlorpromazine (cells were pretreated with 15 μM for 30 min before staining DC-SIGN and observation) (29–35). We found that the dynamin GTPase (guanosine triphosphatase) inhibitor, dynasore, was not effective in inhibiting cluster internalization. Under these conditions, exposure of fluorescently labeled cells to the cell-impermeant collisional quencher, potassium iodide (KI), quenches all DC-SIGN fluorescence due to antibody labeling at its extracellular neck region in fixed MX DC-SIGN and dendritic cells (Fig. 3, A and B, respectively). Using Stern-Volmer plots (36), we verified that Alexa Fluor 488 and Calcium Orange AM could be collisionally quenched in solution by KI. In live MX DC-SIGN cells visualized by TIRF microscopy, KI also quenches surface fluorescence (Fig. 3C, top, and video S3). Furthermore, immediately after KI quenching, an extremely small amount of DC-SIGN fluorescence is seen either in TIRF or epifluorescent images, and as would be expected, u-track failed to detect any entities that could be tracked, a further indication that clusters were on the cell surface. Figure 3C (bottom) shows a positive control in which we deliberately permitted entry of anti–DC-SIGN Fab fragments into the cell by incubating at 37°C for over 30 min and by not adding chlorpromazine. In this case, internal fluorescence is not quenched either in TIRF or epifluorescence microscopy, indicating that iodide membrane permeability is so low as to not permit sufficient internal concentrations of iodide that it could quench the fluorophores. We performed another control experiment, in which MX DC-SIGN cells were loaded with Calcium Orange AM. KI was then added at a final concentration of 300 mM, and it did not quench the cytosolic Calcium Orange (fig. S2). For these reasons, we believe that the measured DC-SIGN lateral transport occurs in the plasma membrane and not inside the cell. However, because dendritic cells are very sensitive to chlorpromazine with the result that few cells remained after treatment, observations on them were limited to 15 min with no chlorpromazine present. The same experiments with KI were then conducted to verify that DC-SIGN remained on the cell surface.
Fig. 3. Evidence that labeled DC-SIGN is on the surface.
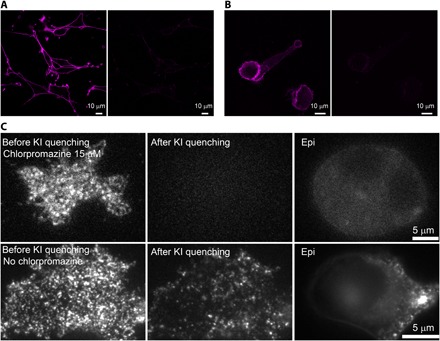
(A) KI quenches DC-SIGN fluorescence on MX DC-SIGN cells (left, before KI; right, after KI). MX DC-SIGN cells were fixed with 4% paraformaldehyde and labeled with DCN46–Alexa Fluor 647 monoclonal antibody (mAb). The after-KI image was taken 2 min after adding KI at a final concentration of 300 mM. (B) KI quenches DC-SIGN fluorescence on primary dendritic cells (left, before KI; right, after KI). Dendritic cells were fixed and labeled with DCN46–Alexa Fluor 647 mAb. The after-KI image was taken 1 min after adding KI at a final concentration of 300 mM. Images for (A) and (B) were taken on a confocal microscope. (C) KI quenches DC-SIGN fluorescence on live MX DC-SIGN cells, as visualized by TIRF microscopy [top row: left, before KI; middle, after KI; right, epifluorescence (epi) image]; by contrast, when we deliberately permitted entry of anti–DC-SIGN Fab fragments into the cell by incubating at 37°C for more than 30 min and by not adding chlorpromazine (bottom row), internal fluorescence was not quenched either in TIRF (middle) or epifluorescence (right) microscopy. Video S3 shows another example of the total quenching process.
What drives this motion? MTs are implicated for the following reasons: First, directed DC-SIGN trajectories are colinear with MTs (Fig. 1 and video S2), and the reach of many of these trajectories is quite long (Fig. 1 and videos S1 and S2), again suggesting MT involvement. We then treated MX DC-SIGN cells with 50 μM nocodazole for 30 min. Under these conditions, MTs qualitatively appeared to be depolymerized when viewed by confocal microscopy, but some remnant MTs appeared in live cell “dirty TIRF” microscopy (fig. S3). Immunofluorescence indicates that some of these MTs are acetylated, suggesting that they are stable (37, 38) in MX DC-SIGN (fig. S3C) and in DC and resistant to nocodazole. Although this treatment did not greatly alter the speed or trajectory length for directed DC-SIGN clusters (Table 1), the number of directed trajectories, normalized for ventral cell-surface area [that is, density of directed (>2 μm) trajectories], was significantly reduced (Fig. 4), consistent with an MT-associated effect. Because the combination of chlorpromazine and the cytoskeletal inhibitor often caused cells to round and detach, the inhibitor experiments were done with cells attached to fibronectin (FN)–coated substrates (Materials and Methods).
Fig. 4. Box and whisker plots of the areal density of longer (>2 μm), directed DC-SIGN tracks in MX DC-SIGN cells with and without cytoskeletal inhibitors and in dendritic cells.
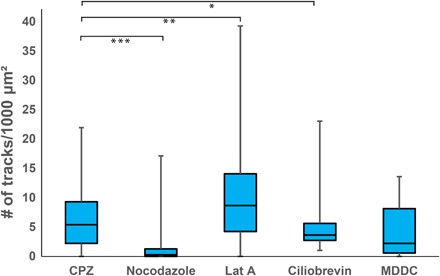
Chlorpromazine (CPZ)–treated cells, representing the DC-SIGN tracks on control MX DC-SIGN cells without additional drug treatments. Nocodazole, latrunculin A (Lat A), and ciliobrevin data sets were collected on MX DC-SIGN cells treated with CPZ and additional drugs, correspondingly, as indicated. The MDDC data set was collected on primary dendritic cells without drug treatment and is shown for reference. P values were obtained from the standard Student’s t test. *P = 0.11 (between CPZ and ciliobrevin), **P = 0.016 (between CPZ and Lat A), ***P = 0.0016 (between CPZ and nocodazole).
We also explored the effect of cortical actin as a determinant of the directed transport observation using latrunculin A to disrupt the actin cytoskeleton. Because higher concentrations of latrunculin A and longer incubation times that disrupted cell morphology could make the interpretation of the analysis problematic (39), we performed the experiments at a latrunculin A concentration where cell morphology was mainly preserved; this concentration was determined by titration of the latrunculin A effect (fig. S4). We found that treatment with latrunculin A at 400 nM for 15 min did not significantly affect directed transport in terms of cluster speed and trajectory length (Table 1), but the density of these tracks (Fig. 4) was modestly increased; these results are consistent with an MT-dependent effect.
To further investigate the nature of this behavior, we explored the hypothesis that DC-SIGN linkage to a putative MT motor occurs via its cytoplasmic N-terminal domain. A plausible candidate MT motor is dynein because movements, at least, in MDDC are predominantly retrograde. Therefore, the dynein inhibitor ciliobrevin at both 7 and 50 μM was applied. Under these conditions, we confirmed that ciliobrevin was most active at 50 μM by examining the inhibition of motions of organelles labeled by LysoTracker Red (videos S4 and S5). However, this inhibitor is less active in serum (40), and we found that in serum, the combination of ciliobrevin and chlorpromazine was toxic to the cell. Because of this information, we performed the experiments without chlorpromazine in serum-free medium for periods of <15 min. During this period, we confirmed that DC-SIGN clusters remained on the surface. However, for the possible reasons discussed below, the effect of ciliobrevin was not significant.
DC-SIGN functions in capture and endocytosis of a number of varied microbial pathogens, including DENV. One hypothesis is that rapid, retrograde transport of DC-SIGN clusters is used to quickly move pathogens from the leading edge and dendritic projections of dendritic cells to the perinuclear zone for subsequent internalization. Dendritic projections (as well as lamellar regions) from MDDC (Fig. 5A, left) exhibit a strong signal from SiR-tubulin–labeled MT (41), indicating an abundance of MTs. This is also shown in an immunofluorescence confocal image and accompanying DIC image of an MDDC in the three right panels. Similar distributions for MTs in dendritic cells were reported earlier (42). Instantaneous velocities of DC-SIGN clusters on projections measured from kymographs (Fig. 5B) yield a mean of 3.9 ± 0.50 μm/s, and long-range velocities, including stall times, are roughly 1.6 μm/s. Presumably, in these regions, putative MT motors have a greater likelihood to attach to both MTs and DC-SIGN. The motion of DC-SIGN clusters is bidirectional, but flux in the retrograde direction is 3.6-fold greater, as estimated from the kymographic data (Fig. 5B and video S6). This suggests that although most of the MTs are oriented with their plus ends pointed toward the cell edge, a few noncentrosomal MTs may have their plus ends oriented toward the cell center (43, 44).
Fig. 5. DC-SIGN motion along projections of MX DC-SIGN cells and movement of DENV along projection in MDDC.
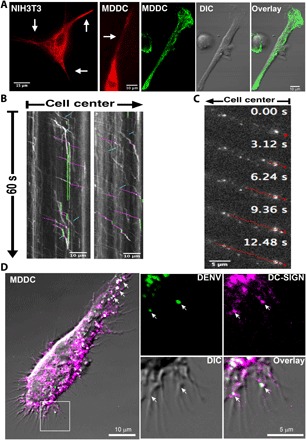
(A) Fluorescence micrograph of silicon rhodamine (SiR)–tubulin–labeled MTs (two left panels, red), which extend into dendritic projections (white arrows) of MDDCs (leftmost), as imaged in dirty TIRF (that is, the incident angle was reduced until MT labels were excited); the three right panels show an anti-tubulin confocal image of an MDDC [left, immunofluorescence; middle, differential interference contrast (DIC) image; right, merged image]. (B and C) Both DC-SIGN and DENV bound to projections undergo rapid, predominantly retrograde transport. (B) Kymographs showing significantly greater flux of DC-SIGN clusters in the retrograde direction in projections in MX DC-SIGN cells. Selected retrograde and anterograde motions and stalls are highlighted in magenta, cyan, and green, respectively. (C) DENV bound to projections in an MDDC also undergoes rapid, primarily retrograde directed transport. One selected DENV trajectory along a projection of more than ~12.5 s is highlighted in red. (D) Confocal microscopy (see the Supplementary Materials) demonstrates that DENV colocalized with DC-SIGN on the dendritic projections of an MDDC (white arrows); right panels show inset in the left panel magnified to show colocalization of DC-SIGN and DENV on filopodial-like dendritic tips. Magenta indicates DC-SIGN staining, and DC-SIGN was labeled with DCN46–Alexa Fluor 647 mAb. Green represents labeled DENV, and DENV was directly conjugated with Alexa Fluor 488.
To measure the effect of DENV attachment on directed DC-SIGN cluster velocity, we exposed dendritic cells and MX DC-SIGN fibroblasts expressing DC-SIGN to fluorescently labeled DENV. When DENV binds to projections on MDDCs, it also undergoes rapid, directed transport (Fig. 5C and video S7). This transport is also presumably mediated by DC-SIGN; Fig. 5D shows a dendritic projection on an MDDC and the colocalization of DENV and DC-SIGN clusters (arrows) (video S1 shows that DENV associated with DC-SIGN may undergo rapid and lengthy directed transport in MX DC-SIGN cells). The velocities in the dendritic projections are also bidirectional and average around 1.4 μm/s (table S1). Instantaneous velocities can reach the 2- to 3-μm/s range again (table S1).
DISCUSSION
C-type lectins serve as all-purpose pathogen receptors in dendritic and other cells (19), and one particular C-type lectin, DC-SIGN, exists in nanoclusters in the plasma membrane of dendritic cells and when ectopically expressed in murine fibroblasts (21, 22). A small but significant fraction of these clusters undergoes rapid, directed transport in the plane of the plasma membrane at speeds up to and exceeding 1 μm/s in both dendritic cells and MX DC-SIGN cells ectopically expressing DC-SIGN. There are few precedents for this rapid movement, the most prominent being intraflagellar transport (11–13), as discussed in Introduction. We believe that clusters of DC-SIGN are in the cell membrane, as opposed to just inside the cell, because imaging was carried out using TIRF microscopy in the presence of endocytosis inhibitors and because an impermeable quencher removed all of the DC-SIGN fluorescence.
Imaging of DC-SIGN clusters in cells expressing a fluorescent construct containing the MT-binding domain of ensconsin demonstrated that many cluster trajectories are coincident with MTs. Recent electron microscopy studies demonstrate that some MTs are present in close proximity to the plasma membrane (45). Moreover, the MT-depolymerizing drug nocodazole, but not latrunculin A, which disrupts F-actin, suppresses a fraction of clusters undergoing rapid, directed movement, further implicating MTs in this phenomenon. Because cluster speeds are very rapid, a probable candidate for driving this motion is the motor dynein, but the dynein inhibitor, ciliobrevin, does not reduce the directed movement. However, at this juncture, contributions by a member(s) of the extensive kinesin family cannot be ruled out.
Although actin-based virus transport, as exemplified by nonenveloped human papilloma virus, occurs along actin-rich protrusions (4), this phenomenon is distinct from our observations: It appears to rely on cortical actin retrograde flow, which is on the order of 1 to 4 μm/min and can be perturbed by cytochalasin D and jasplakinolide and by the myosin II inhibitor blebbistatin but not by nocodazole. By contrast, the directed transport of DC-SIGN clusters is well over an order of magnitude faster and is perturbed by nocodazole and, if anything, is enhanced by latrunculin A treatment in terms of the fraction long, directed trajectories.
The rapid, directed movement of DC-SIGN clusters in the plane of the plasma membrane challenges our current concepts of how lateral movement in the membrane is regulated by cortical membrane interactions. In particular, the plasma membrane is thought to be underlain by a subjacent membrane skeleton meshwork (23, 46) that compartmentalizes lateral diffusion into fast intracompartmental diffusion and slower long-range intercompartmental diffusion; this model begs the question of how a motor connected to the DC-SIGN platform can “slice” through this meshwork to power the velocities we observe. There are two extreme possibilities. First, the meshwork could be dissociated from the plasma membrane in thin channels in which MTs coupled to the motor, its adaptors, and the DC-SIGN clusters would reside (fig. S5). Alternatively, the cortex could be separated such that an MT proximate to the plasma membrane could be inserted. These possibilities have been recognized by Jaqaman et al. (25) in their studies of the linear diffusion of the CD36 receptor. Rapid, MT motor–powered movement of surface clusters would occur in these channels. Our hypothesis is that MTs in this location are in fact in a protected status partly owing to the fact that they are embedded in the cortical actin. In addition, a significant fraction of the MTs is acetylated and resistant to depolymerization. This could explain why MT-depolymerizing agents do not have a complete inhibitory effect. Moreover, application of latrunculin A actually increased mean cluster densities somewhat, perhaps because the embedding cortex is loosened.
Second, meshwork connections are dynamic, opening and closing in accordance with thermal energy. Hopping from one compartment to another regulates plasma membrane protein lateral diffusion, likely using these thermally activated breaks. The long-range mesoscale diffusion coefficient D is given by KBT/f, where f is the effective frictional coefficient. This frictional coefficient specifies the drag force on the diffusing protein approximated by the Saffman-Delbrück expression and later modifications (47, 48). However, this drag force on the micrometer scale is on the order of hundreths of a piconewton, much less than the force generated by MT motors (5 to 7 pN) (49–51). Moreover, Sako and Kusumi (52) have shown that the transferrin receptor can be dragged through membranes using a laser trap with a force as weak as 0.25 pN. Thus, an MT motor could easily drive the cluster through the labile membrane skeleton fence.
What function might this rapid, retrograde movement serve? Dendritic projections and the leading margin of patrolling dendritic cells recruited to wounds are first to encounter pathogens, and transepithelial dendrites penetrate tight junctions in gut (53) and airway (54) epithelia to sample luminal pathogens (55). Thus, the rapid, predominantly retrograde movement of DC-SIGN clusters that we have measured could be an efficient mechanism to bring bound pathogens to the perinuclear region for internalization and processing, as previously hypothesized (21). Making this hypothesis attractive, bound DENV undergoes rapid, retrograde transport toward the cell center on MT-containing projections of MX DC-SIGN cells and on dendritic processes in MDDCs. It has been shown that MT-containing dendritic projections enhance particle capture by dendritic cells (42). We previously suggested that directed transport of DC-SIGN clusters could be constitutive or cargo-actuated (21); our present work suggests that a constitutive mechanism does exist, assuming that Fab fragments do not activate transport. We conclude that this novel aspect of the transport of plasma membrane components suggests new functions for directed lateral mobility and indicates that revision of our concepts of cell-surface dynamic structure may be required.
MATERIALS AND METHODS
Cells, reagents, and labeling
Human MDDCs were prepared, as previously described (21, 34, 56). Briefly, isolated monocytes were seeded on 35-mm glass-bottom FluoroDish (World Precision Instruments) and cultured in RPMI 1640 medium containing 10% fetal bovine serum, human interleukin-4 (500 U/ml; PeproTech), and human granulocyte-macrophage colony-stimulating factor (800 U/ml; PeproTech) for a week until the cells differentiated into immature dendritic cells. MX DC-SIGN cells were obtained from the National Institutes of Health (NIH) AIDS Research and Reference Reagent Program, Division of AIDS, National Institute of Allergy and Infectious Diseases [NIH 3T3/MX DC-SIGN (catalog no. 9947) from L. Wu and V. N. KewalRamani (57)]. For live cell imaging of MX DC-SIGN cells on the TIRF microscope, cells were pretreated with 15 μM chlorpromazine for 30 min before staining and observation. For the inhibitor studies on MX DC-SIGN cells, the combination of chlorpromazine and the inhibitor often made the cells round to various extents. To ensure a more spread state, cells were plated on FN-coated substrates; human plasma FN (10 μg/ml; Sigma-Aldrich) was deposited in a 400-μl drop on 20-mm circular coverslips and incubated overnight at 4°C on a rocker plate, after which the coverslips were washed extensively with phosphate-buffered saline before plating cells. The quality of the FN coverage was checked using TIRF microscopy by doping the deposited human FN with 1 to 5% Hi-Lite Green bovine FN (Cytoskeleton). Cells were measured within 25 min after excess Fab label was removed by washing.
Cell-surface DC-SIGN was labeled with Fab fragments made from DCN46 mAb (BD Biosciences) and directly conjugated with Alexa Fluor dyes (Molecular Probes). DCN46 binds to the neck domain of DC-SIGN, so it does not interfere with pathogens binding to the carbohydrate recognition domain of DC-SIGN and rapidly internalize after binding to DC-SIGN (58). DENV was purified as described elsewhere (59) and was conjugated with Alexa Fluor dyes (Molecular Probes). MTs in live cells were labeled by either transfecting the cells with the EMBD-3×GFP (a gift from W. Bement, Addgene plasmid #26741) (60) or with SiR-tubulin (Spirochrome SA) (41). MTs in fixed cells were labeled with primary anti-tubulin antibody (Santa Cruz Biotechnology) followed by goat-anti mouse Alexa Fluor 488 conjugate immunoglobulin G (Molecular Probes); anti-acetyl tubulin (6-11B-1) was a gift from S. Rogers at the University of North Carolina at Chapel Hill. For the KI quenching experiments, cell-surface DC-SIGN was labeled with DCN46 directly conjugated with Alexa Fluor 647 (Molecular Probes). Calcium Orange AM was obtained from Molecular Probes. For the imaging of colocalization of DC-SIGN with DENV on MDDC protrusions, MDDCs were labeled with DCN46 mAb directly conjugated with Alexa Fluor 647 for 10 min at 37°C, and purified DENV directly conjugated with Alexa Fluor 488 was added to the cells for subsequent colocalization imaging. All other reagents were purchased from Sigma-Aldrich.
Microscopes and imaging
All TIRF imaging was done on an Olympus IX83 inverted scope equipped with a UAPON 100× [numerical aperture (NA) 1.49] or a 150× (NA 1.49) oil immersion objective and imaged using a Hamamatsu ImagEM charge-coupled device camera. During video recording, cells were immersed in phenol red–free RPMI 1640 medium at 37°C and 5% CO2 in a Tokai Hit environmental chamber, and videos were recorded at a frequency of 25 Hz for single-color imaging or 12.5 Hz for two-color recording. In some cases, with the MX DC-SIGN cells, CO2 was not used for the short term of the experiment (<30 min), but then, it was confirmed that pH was maintained using a high-resolution pH paper. Typically, HiLo (dirty TIRF) illumination was used to find cells. For each cell, to optimize visualization and detection of clusters, several factors were adjusted: evanescent wave penetration (because the distance of the ventral surface from the substrate varied), TIRF laser intensity, and image contrast. After each optimization step, the focus was readjusted.
All confocal imaging was carried out on an Olympus FluoView FV1200 laser scanning microscope equipped with a 60× (NA 1.35) oil immersion objective, and live cell imaging was done in an environmental heating chamber. For the MT imaging, the cells were fixed with 4% paraformaldehyde for 20 min at room temperature, then permeabilized with permeabilization buffer (Alfa Aesar), and stained as described above. A multicoated dichroic mirror (DM450/488/559/635) was used to separate excitation laser lines, and images were taken sequentially for each channel to minimize cross-talk.
KI, a collisional quencher of fluorescence that is impermeable, was added to cells labeled for DC-SIGN to distinguish surface from internal DC-SIGN fluorescence. The ability of KI to dynamically quench both Alexa Fluor 488 and Calcium Orange AM was tested by titrating micromolar concentrations of the fluorophores with increasing concentrations of KI and measuring the decreasing fluorescence intensity in a NanoDrop 3300 Fluorospectrometer. Collision quenching was indicated by a linear plot of the ratios of initial fluorescence to quenched fluorescence versus the concentration of quencher (36). The quencher was added at a final concentration of 300 mM to cells on the microscope stage, and movies were taken continuously before and after adding KI to record the loss of emission. The solutions of KI were tested on fixed cells to verify that the quencher was working properly. We found that KI stock solution (about 3 to 5 M), which was stored for a relatively longer time (turned yellowish due to oxidation after a couple weeks), quenched fluorescence more efficiently than did freshly prepared KI solutions. Quenched cells were checked for hypertonic lysis, but the morphology was not changed appreciably and nor did the cells take up trypan blue. The experiment in which we attempted to quench cytosolic Calcium Orange AM is described in fig. S2.
Data analysis
Particle tracking and motion analysis were carried out using u-track 2.1.3 (Harvard Medical School) with MATLAB R2013a (MathWorks). Briefly, a series of TIFF files with one file per time point were opened in u-track using the “movieSelectorGUI.m” function. The “single-particles” tracking application was selected, and all three processing steps of the analysis workflow were enabled. The “Gaussian Mixture Model Fitting” method was selected for the Detection-processing step; “Brownian + Directed motion models” Cost functions and Kalman Filter Functions were selected for the Tracking step, and the “motion analysis” method was selected for the Track Analysis step. All other settings were left at their defaults. Resultant tracks were always overlaid on the analyzed images and visually inspected for accuracy.
Motion classification and analysis
Briefly, u-track used a trajectory classification scheme employed by Ewers et al. (26) based on an earlier work of Ferrari et al. (27). Moments (μm), where m is the order of the moment and ranges from 0 to 6, were calculated for a generalized displacement equation as a function of lag time (tau). A plot of log [μm (tau)] versus log tau yields αm as the slope and log(4 Dm) as the y intercept, where Dm is the generalized diffusion coefficient. The plot of αm versus m is the MSS. For strongly self-similar processes, the curves are linear, where SMSS is the slope. In this analysis, SMSS = 0.5 is the random, Brownian diffusion; SMSS < 0.5 is anomalous subdiffusion; and SMSS > 0.5 is anomalous superdiffusion. Because of the linearity of the MSS for strongly self-similar processes, this procedure affords less error in fitting, and a clearer distinction between motion types is possible (26). For example, classification as superdiffusive by u-track is based on comparison of a trajectory’s MSS slope with a preexisting set of slopes resulting from simulations of the same trajectory duration.
Trajectories and motion analysis results consisting of motion classification (for example, superdiffusive) and generalized diffusion coefficient for each track were exported from “*result.mat” files using MATLAB “diary” commands. Microsoft Excel was used to merge data sets from ≥3 cells and extract superdiffusive trajectory data for statistical analysis. The MSS slope thresholds for trajectory durations of 20 to 500 time points can be found within the source code of u-track’s “trackMSSAnalysis.m” function. Plots were generated, and Kruskal-Wallis nonparametric one-way analysis of variance (ANOVA) with Dunn’s multiple-comparison posttest was performed using GraphPad Prism version 6.01 for Windows (GraphPad Software; www.graphpad.com).
Of the many motion types exhibited, we were most interested in analyzing those clusters, which, in the movies, appeared to rapidly move or dart across portions of the cell surface and were most likely motor-driven, as opposed to, for example, those that were diffusing with an underlying flow. To accomplish this, we used the TrackMate module of ImageJ. Images were opened in ImageJ and converted to 8 bit. A cell of interest was chosen using the selection tool, and TrackMate was applied under the following conditions: The DoG (Difference of Gaussian) detector was selected; “Blob” diameter was set to be 0.5 μm, and the threshold setting depended on the image. The simple LAP (Linear Assignment Problem) tracker was used with a linking max distance of 0.4 μm and a gap closing max distance of 0.4 μm, with a maximum gap closing frame of 1. Only tracks longer than 2 μm were counted. The trajectories were then characterized by the intrinsic parameters: mean speed in micrometers per second, calculated as the average of the point-to-point velocities, and trajectory length in micrometers. The mean velocity calculated as the contour length per duration of the trajectory was similar to the average of point-to-point velocities. For comparison, the velocity calculated as the end-to-end distance of the trajectory per duration of the trajectory was also calculated. The number of trajectories meeting the >2 μm criterion was then counted for each cell.
Because cells in control and experiment status may have different areas in contact with substrate, we then normalized the number of trajectories to an area of 1000 μm2 to obtain a trajectory areal density. The effect of the inhibitor on trajectory density could then be ascertained.
Statistical analysis
We performed the standard Student’s t test to compare the difference in areal density of tracks on different sets of samples, assuming equal variances in a one-tailed test.
Supplementary Material
Acknowledgments
We thank V. Gelfand in the Feinberg School of Medicine at Northwestern and J. Moore at the University of Colorado-Denver as well as M. Kapustina, R. Cheney, K. Burridge, S. Rodgers, and J. Bear at UNC for many helpful discussions. Funding: This research was supported by NIH grants R01-GM041402 (to K.J. and N.L.T.), T32-CA009156 (to M.R.), and RO1-AI107731 (to A.M.d.S.). Author contributions: P.L., V.W., L.B., M.R., and P.P. carried out the experiments and data analysis. K.J., P.L., M.R., A.M.d.S., and N.L.T. designed the experiments and wrote the paper. Competing interests: The authors declare that they have no competing interests. Data and materials availability: All data needed to evaluate the conclusions in the paper are present in the paper and/or the Supplementary Materials. Additional data related to this paper may be requested from the authors.
SUPPLEMENTARY MATERIALS
Supplementary material for this article is available at http://advances.sciencemag.org/cgi/content/full/3/11/eaao1616/DC1
video S1. Fluorescence video of DC-SIGN clusters exhibiting long, highly directed excursions.
video S2. Fluorescence video of EMBD-labeled MTs (green, left) in an MX DC-SIGN cell (red, middle) with superimposed trajectories of DC-SIGN clusters exhibiting highly directed, superdiffusive motion (right).
video S3. Quenching of DC-SIGN fluorescence by KI in a TIRF video of MX DC-SIGN cells (to accompany Fig. 3C).
video S4. Effect of ciliobrevin on lysosmal transport.
video S5. Effect of ciliobrevin on lysosmal transport.
video S6. DC-SIGN–directed transport in MX DC-SIGN dendritic projections favors the retrograde direction (to accompany Fig. 5).
video S7. When DENV binds to projections on MDDCs, it also undergoes rapid, directed transport.
fig. S1. MSS analysis results for DC-SIGN clusters.
fig. S2. KI (300 mM) does not quench Calcium Orange AM inside the cells.
fig. S3. Effect of nocodazole on MT status in MX DC-SIGN cells.
fig. S4. Effect of latrunculin A on actin filament status.
fig. S5. Conceptualization of a ventral MT occupying a channel within the actin cortex with a putative MT motor driving the directed motion of DC-SIGN.
table S1. Maximum instantaneous and average (including stall time) speeds of selected DENV trajectories in the MDDC projection shown in Fig. 5D and video S5.
REFERENCES AND NOTES
- 1.Taylor R. B., Duffus W. P. H., Raff M. C., de Petris S., Redistribution and pinocytosis of lymphocyte surface immunoglobulin molecules induced by anti-immunoglobulin antibody. Nature 233, 225–229 (1971). [DOI] [PubMed] [Google Scholar]
- 2.Lehmann M. J., Sherer N. M., Marks C. B., Pypaert M., Mothes W., Actin- and myosin-driven movement of viruses along filopodia precedes their entry into cells. J. Cell Biol. 170, 317–325 (2005). [DOI] [PMC free article] [PubMed] [Google Scholar]
- 3.Mercer J., Helenius A., Vaccinia virus uses macropinocytosis and apoptotic mimicry to enter host cells. Science 320, 531–535 (2008). [DOI] [PubMed] [Google Scholar]
- 4.Schelhaas M., Ewers H., Rajamäki M.-L., Day P. M., Schiller J. T., Helenius A., Human papillomavirus type 16 entry: Retrograde cell surface transport along actin-rich protrusions. PLOS Pathog. 4, e1000148 (2008). [DOI] [PMC free article] [PubMed] [Google Scholar]
- 5.Coller K. E., Berger K. L., Heaton N. S., Cooper J. D., Yoon R., Randall G., RNA interference and single particle tracking analysis of hepatitis C virus endocytosis. PLOS Pathog. 5, e1000702 (2009). [DOI] [PMC free article] [PubMed] [Google Scholar]
- 6.Burckhardt C. J., Suomalainen M., Schoenenberger P., Boucke K., Hemmi S., Greber U. F., Drifting motions of the adenovirus receptor CAR and immobile integrins initiate virus uncoating and membrane lytic protein exposure. Cell Host Microbe 10, 105–117 (2011). [DOI] [PubMed] [Google Scholar]
- 7.Burckhardt C. J., Greber U. F., Virus movements on the plasma membrane support infection and transmission between cells. PLOS Pathog. 5, e1000621 (2009). [DOI] [PMC free article] [PubMed] [Google Scholar]
- 8.Forscher P., Smith S. J., Actions of cytochalasins on the organization of actin filaments and microtubules in a neuronal growth cone. J. Cell Biol. 107, 1505–1516 (1988). [DOI] [PMC free article] [PubMed] [Google Scholar]
- 9.Smith S. J., Neuronal cytomechanics: The actin-based motility of growth cones. Science 242, 708–715 (1988). [DOI] [PubMed] [Google Scholar]
- 10.Sheetz M. P., Baumrind N. L., Wayne D. B., Pearlman A. L., Concentration of membrane antigens by forward transport and trapping in neuronal growth cones. Cell 61, 231–241 (1990). [DOI] [PubMed] [Google Scholar]
- 11.Kozminski K. G., Johnson K. A., Forscher P., Rosenbaum J. L., A motility in the eukaryotic flagellum unrelated to flagellar beating. Proc. Natl. Acad. Sci. U.S.A. 90, 5519–5523 (1993). [DOI] [PMC free article] [PubMed] [Google Scholar]
- 12.Kozminski K. G., Beech P. L., Rosenbaum J. L., The Chlamydomonas kinesin-like protein FLA10 is involved in motility associated with the flagellar membrane. J. Cell Biol. 131, 1517–1527 (1995). [DOI] [PMC free article] [PubMed] [Google Scholar]
- 13.Hao L., Scholey J. M., Intraflagellar transport at a glance. J. Cell Sci. 122, 889–892 (2009). [DOI] [PMC free article] [PubMed] [Google Scholar]
- 14.Qin H., Burnette D. T., Bae Y.-K., Forscher P., Barr M. M., Rosenbaum J. L., Intraflagellar transport is required for the vectorial movement of TRPV channels in the ciliary membrane. Curr. Biol. 15, 1695–1699 (2005). [DOI] [PubMed] [Google Scholar]
- 15.Bloodgood R. A., Gliding motility: Can regulated protein movements in the plasma membrane drive whole cell locomotion?. Cell Motil. Cytoskeleton 14, 340–344 (1989). [Google Scholar]
- 16.Bouzigues C., Dahan M., Transient directed motions of GABAA receptors in growth cones detected by a speed correlation index. Biophys. J. 92, 654–660 (2007). [DOI] [PMC free article] [PubMed] [Google Scholar]
- 17.Franker M. A. M., Hoogenraad C. C., Microtubule-based transport—Basic mechanisms, traffic rules and role in neurological pathogenesis. J. Cell Sci. 126, 2319–2329 (2013). [DOI] [PubMed] [Google Scholar]
- 18.Vaughan J. C., Brandenburg B., Hogle J. M., Zhuang X., Rapid actin-dependent viral motility in live cells. Biophys. J. 97, 1647–1656 (2009). [DOI] [PMC free article] [PubMed] [Google Scholar]
- 19.Dambuza I. M., Brown G. D., C-type lectins in immunity: Recent developments. Curr. Opin. Immunol. 32, 21–27 (2015). [DOI] [PMC free article] [PubMed] [Google Scholar]
- 20.de Bakker B. I., de Lange F., Cambi A., Korterik J. P., van Dijk E. M. H. P., van Hulst N. F., Figdor C. G., Garcia-Parajo M. F., Nanoscale organization of the pathogen receptor DC-SIGN mapped by single-molecule high-resolution fluorescence microscopy. Chemphyschem 8, 1473–1480 (2007). [DOI] [PubMed] [Google Scholar]
- 21.Neumann A. K., Thompson N. L., Jacobson K., Distribution and lateral mobility of DC-SIGN on immature dendritic cells—Implications for pathogen uptake. J. Cell Sci. 121, 634–643 (2008). [DOI] [PubMed] [Google Scholar]
- 22.Itano M. S., Steinhauer C., Schmied J. J., Forthmann C., Liu P., Neumann A. K., Thompson N. L., Tinnefeld P., Jacobson K., Super-resolution imaging of C-type lectin and influenza hemagglutinin nanodomains on plasma membranes using blink microscopy. Biophys. J. 102, 1534–1542 (2012). [DOI] [PMC free article] [PubMed] [Google Scholar]
- 23.Kusumi A., Suzuki K. G. N., Kasai R. S., Ritchie K., Fujiwara T. K., Hierarchical mesoscale domain organization of the plasma membrane. Trends Biochem. Sci. 36, 604–615 (2011). [DOI] [PubMed] [Google Scholar]
- 24.Jaqaman K., Loerke D., Mettlen M., Kuwata H., Grinstein S., Schmid S. L., Danuser G., Robust single-particle tracking in live-cell time-lapse sequences. Nat. Methods 5, 695–702 (2008). [DOI] [PMC free article] [PubMed] [Google Scholar]
- 25.Jaqaman K., Kuwata H., Touret N., Collins R., Trimble W. S., Danuser G., Grinstein S., Cytoskeletal control of CD36 diffusion promotes its receptor and signaling function. Cell 146, 593–606 (2011). [DOI] [PMC free article] [PubMed] [Google Scholar]
- 26.Ewers H., Smith A. E., Sbalzarini I. F., Lilie H., Koumoutsakos P., Helenius A., Single-particle tracking of murine polyoma virus-like particles on live cells and artificial membranes. Proc. Natl. Acad. Sci. U.S.A. 102, 15110–15115 (2005). [DOI] [PMC free article] [PubMed] [Google Scholar]
- 27.Ferrari R., Manfroi A. J., Young W. R., Strongly and weakly self-similar diffusion. Physica D 154, 111–137 (2001). [Google Scholar]
- 28.Tinevez J.-Y., Perry N., Schindelin J., Hoopes G. M., Reynolds G. D., Laplantine E., Bednarek S. Y., Shorte S. L., Eliceiri K. W., TrackMate: An open and extensible platform for single-particle tracking. Methods 115, 80–90 (2017). [DOI] [PubMed] [Google Scholar]
- 29.Wang L. H., Rothberg K. G., Anderson R. G., Mis-assembly of clathrin lattices on endosomes reveals a regulatory switch for coated pit formation. J. Cell Biol. 123, 1107–1117 (1993). [DOI] [PMC free article] [PubMed] [Google Scholar]
- 30.Dutta D., Donaldson J. G., Search for inhibitors of endocytosis. Cell Logist. 2, 203–208 (2012). [DOI] [PMC free article] [PubMed] [Google Scholar]
- 31.Tacken P. J., Ginter W., Berod L., Cruz L. J., Joosten B., Sparwasser T., Figdor C. G., Cambi A., Targeting DC-SIGN via its neck region leads to prolonged antigen residence in early endosomes, delayed lysosomal degradation, and cross-presentation. Blood 118, 4111–4119 (2011). [DOI] [PubMed] [Google Scholar]
- 32.Cambi A., Beeren I., Joosten B., Fransen J. A., Figdor C. G., The C-type lectin DC-SIGN internalizes soluble antigens and HIV-1 virions via a clathrin-dependent mechanism. Eur. J. Immunol. 39, 1923–1928 (2009). [DOI] [PubMed] [Google Scholar]
- 33.Cambi A., Lidke D. S., Arndt-Jovin D. J., Figdor C. G., Jovin T. M., Ligand-conjugated quantum dots monitor antigen uptake and processing by dendritic cells. Nano Lett. 7, 970–977 (2007). [DOI] [PubMed] [Google Scholar]
- 34.Itano M. S., Neumann A. K., Liu P., Zhang F., Gratton E., Parak W. J., Thompson N. L., Jacobson K., DC-SIGN and influenza hemagglutinin dynamics in plasma membrane microdomains are markedly different. Biophys. J. 100, 2662–2670 (2011). [DOI] [PMC free article] [PubMed] [Google Scholar]
- 35.Torreno-Pina J. A., Castro B. M., Manzo C., Buschow S. I., Cambi A., Garcia-Parajo M. F., Enhanced receptor-clathrin interactions induced by N-glycan-mediated membrane micropatterning. Proc. Natl. Acad. Sci. U.S.A. 111, 11037–11042 (2014). [DOI] [PMC free article] [PubMed] [Google Scholar]
- 36.D. M. Jameson, Introduction to Fluorescence (CRC Press, 2014). [Google Scholar]
- 37.Xu Z., Schaedel L., Portran D., Aguilar A., Gaillard J., Marinkovich M. P., Théry M., Nachury M. V., Microtubules acquire resistance from mechanical breakage through intralumenal acetylation. Science 356, 328–332 (2017). [DOI] [PMC free article] [PubMed] [Google Scholar]
- 38.Li R., Gundersen G. G., Beyond polymer polarity: How the cytoskeleton builds a polarized cell. Nat. Rev. Mol. Cell Biol. 9, 860–873 (2008). [DOI] [PubMed] [Google Scholar]
- 39.Jaumouillé V., Farkash Y., Jaqaman K., Das R., Lowell C. A., Grinstein S., Actin cytoskeleton reorganization by the tyrosine kinase Syk regulates Fcγ receptor responsiveness by increasing its lateral mobility and clustering. Dev. Cell 29, 534–546 (2014). [DOI] [PMC free article] [PubMed] [Google Scholar]
- 40.Steinman J. B., Santarossa C. C., Miller R. M., Yu L. S., Serpinskaya A. S., Furukawa H., Morimoto S., Tanaka Y., Nishitani M., Asano M., Zalyte R., Ondrus A. E., Johnson A. G., Ye F., Nachury M. V., Fukase Y., Aso K., Foley M. A., Gelfand V. I., Chen J. K., Carter A. P., Kapoor T. M., Chemical structure-guided design of dynapyrazoles, cell-permeable dynein inhibitors with a unique mode of action. eLife 6, e25174 (2017). [DOI] [PMC free article] [PubMed] [Google Scholar]
- 41.Lukinavičius G., Reymond L., D’Este E., Masharina A., Göttfert F., Ta H., Güther A., Fournier M., Rizzo S., Waldmann H., Blaukopf C., Sommer C., Gerlich D. W., Arndt H.-D., Hell S. W., Johnsson K., Fluorogenic probes for live-cell imaging of the cytoskeleton. Nat. Methods 11, 731–733 (2014). [DOI] [PubMed] [Google Scholar]
- 42.Swetman Andersen C. A., Handley M., Pollara G., Ridley A. J., Katz D. R., Chain B. M., β1-Integrins determine the dendritic morphology which enhances DC-SIGN-mediated particle capture by dendritic cells. Int. Immunol. 18, 1295–1303 (2006). [DOI] [PubMed] [Google Scholar]
- 43.Bartolini F., Gundersen G. G., Generation of noncentrosomal microtubule arrays. J. Cell Sci. 119, 4155–4163 (2006). [DOI] [PubMed] [Google Scholar]
- 44.Muroyama A., Lechler T., Microtubule organization, dynamics and functions in differentiated cells. Development 144, 3012–3021 (2017). [DOI] [PMC free article] [PubMed] [Google Scholar]
- 45.Makihara M., Watanabe T., Usukura E., Kaibuchi K., Narita A., Tanaka N., Usukura J., A new approach for the direct visualization of the membrane cytoskeleton in cryo-electron microscopy: A comparative study with freeze-etching electron microscopy. Microscopy 65, 488–498 (2016). [DOI] [PubMed] [Google Scholar]
- 46.Kusumi A., Nakada C., Ritchie K., Murase K., Suzuki K., Murakoshi H., Kasai R. S., Kondo J., Fujiwara T., Paradigm shift of the plasma membrane concept from the two-dimensional continuum fluid to the partitioned fluid: High-speed single-molecules tracking of membrane molecules. Annu. Rev. Biophys. Biomol. Struct. 34, 351–378 (2005). [DOI] [PubMed] [Google Scholar]
- 47.Saffman P. G., Delbrück M., Brownian motion in biological membranes. Proc. Natl. Acad. Sci. U.S.A. 72, 3111–3113 (1975). [DOI] [PMC free article] [PubMed] [Google Scholar]
- 48.Petrov E. P., Schwille P., Translational diffusion in lipid membranes beyond the Saffman-Delbrück approximation. Biophys. J. 94, L41–L43 (2008). [DOI] [PMC free article] [PubMed] [Google Scholar]
- 49.Valentine M. T., Fordyce P. M., Krzysiak T. C., Gilbert S. P., Block S. M., Individual dimers of the mitotic kinesin motor Eg5 step processively and support substantial loads in vitro. Nat. Cell Biol. 8, 470–476 (2006). [DOI] [PMC free article] [PubMed] [Google Scholar]
- 50.Korneev M. J., Lakämper S., Schmidt C. F., Load-dependent release limits the processive stepping of the tetrameric Eg5 motor. Eur. Biophys. J. 36, 675–681 (2007). [DOI] [PMC free article] [PubMed] [Google Scholar]
- 51.Nicholas M. P., Rao L., Gennerich A., An improved optical tweezers assay for measuring the force generation of single kinesin molecules. Methods Mol. Biol. 1136, 171–246 (2014). [DOI] [PMC free article] [PubMed] [Google Scholar]
- 52.Sako Y., Kusumi A., Barriers for lateral diffusion of transferrin receptor in the plasma membrane as characterized by receptor dragging by laser tweezers: Fence versus tether. J. Cell Biol. 129, 1559–1574 (1995). [DOI] [PMC free article] [PubMed] [Google Scholar]
- 53.Rescigno M., Urbano M., Valzasina B., Francolini M., Rotta G., Bonasio R., Granucci F., Kraehenbuhl J.-P., Ricciardi-Castagnoli P., Dendritic cells express tight junction proteins and penetrate gut epithelial monolayers to sample bacteria. Nat. Immunol. 2, 361–367 (2001). [DOI] [PubMed] [Google Scholar]
- 54.Qin T., Yin Y., Yu Q., Huang L., Wang X., Lin J., Yang Q., CpG oligodeoxynucleotides facilitate delivery of whole inactivated H9N2 influenza virus via transepithelial dendrites of dendritic cells in nasal mucosa. J. Virol. 89, 5904–5918 (2015). [DOI] [PMC free article] [PubMed] [Google Scholar]
- 55.Gewirtz A. T., Madara J. L., Periscope, up! Monitoring microbes in the intestine. Nat. Immunol. 2, 288–290 (2001). [DOI] [PubMed] [Google Scholar]
- 56.Liu P., Wang X., Itano M. S., Neumann A. K., de Silva A. M., Jacobson K., Thompson N. L., Low copy numbers of DC-SIGN in cell membrane microdomains: Implications for structure and function. Traffic 15, 179–196 (2014). [DOI] [PMC free article] [PubMed] [Google Scholar]
- 57.Wu L., Martin T. D., Vazeux R., Unutmaz D., KewalRamani V. N., Functional evaluation of DC-SIGN monoclonal antibodies reveals DC-SIGN interactions with ICAM-3 do not promote human immunodeficiency virus type 1 transmission. J. Virol. 76, 5905–5914 (2002). [DOI] [PMC free article] [PubMed] [Google Scholar]
- 58.Gruber A., Chalmers A. S., Popov S., Ruprecht R. M., Functional aspects of binding of monoclonal antibody DCN46 to DC-SIGN on dendritic cells. Immunol. Lett. 84, 103–108 (2002). [DOI] [PubMed] [Google Scholar]
- 59.Wahala W. M. P. B., Donaldson E. F., de Alwis R., Accavitti-Loper M. A., Baric R. S., de Silva A. M., Natural strain variation and antibody neutralization of dengue serotype 3 viruses. PLOS Pathog. 6, e1000821 (2010). [DOI] [PMC free article] [PubMed] [Google Scholar]
- 60.Miller A. L., Bement W. M., Regulation of cytokinesis by Rho GTPase flux. Nat. Cell Biol. 11, 71–77 (2008). [DOI] [PMC free article] [PubMed] [Google Scholar]
Associated Data
This section collects any data citations, data availability statements, or supplementary materials included in this article.
Supplementary Materials
Supplementary material for this article is available at http://advances.sciencemag.org/cgi/content/full/3/11/eaao1616/DC1
video S1. Fluorescence video of DC-SIGN clusters exhibiting long, highly directed excursions.
video S2. Fluorescence video of EMBD-labeled MTs (green, left) in an MX DC-SIGN cell (red, middle) with superimposed trajectories of DC-SIGN clusters exhibiting highly directed, superdiffusive motion (right).
video S3. Quenching of DC-SIGN fluorescence by KI in a TIRF video of MX DC-SIGN cells (to accompany Fig. 3C).
video S4. Effect of ciliobrevin on lysosmal transport.
video S5. Effect of ciliobrevin on lysosmal transport.
video S6. DC-SIGN–directed transport in MX DC-SIGN dendritic projections favors the retrograde direction (to accompany Fig. 5).
video S7. When DENV binds to projections on MDDCs, it also undergoes rapid, directed transport.
fig. S1. MSS analysis results for DC-SIGN clusters.
fig. S2. KI (300 mM) does not quench Calcium Orange AM inside the cells.
fig. S3. Effect of nocodazole on MT status in MX DC-SIGN cells.
fig. S4. Effect of latrunculin A on actin filament status.
fig. S5. Conceptualization of a ventral MT occupying a channel within the actin cortex with a putative MT motor driving the directed motion of DC-SIGN.
table S1. Maximum instantaneous and average (including stall time) speeds of selected DENV trajectories in the MDDC projection shown in Fig. 5D and video S5.