Abstract
Histone tail modifications can greatly influence chromatin-associated processes. Asymmetrically modified nucleosomes exist in multiple cell types, but whether modifications on both sister histones contribute equally to chromatin dynamics remains elusive. Here, we devised a bivalent nucleosome system that allowed for the constitutive assembly of asymmetrically modified sister histone H3s in nucleosomes in Saccharomyces cerevisiae. The sister H3K36 methylations independently affected cryptic transcription in gene coding regions, whereas sister H3K79 methylation had cooperative effects on gene silencing near telomeres. H3K4 methylation on sister histones played an independent role in suppressing the recruitment of Gal4 activator to the GAL1 promoter and in inhibiting GAL1 transcription. Under starvation stress, sister H3K4 methylations acted cooperatively, independently or redundantly to regulate transcription. Thus, we provide a unique tool for comparing symmetrical and asymmetrical modifications of sister histone H3s in vivo.
Research organism: S. cerevisiae
eLife digest
Inside each human cell, about two meters of DNA is wrapped around millions of proteins called histones, forming structures known as nucleosomes. Each nucleosome contains 147 letters of DNA code and two copies of four different histones – H2A, H2B, H3 and H4 – meaning eight proteins in total.
The two copies of each histone protein found in a nucleosome are referred to as “sister” histones and are identical. Histone proteins have long tails that the cell can edit by adding chemical groups at specific positions. This changes the way the cell copies, uses and repairs its DNA. Previous studies show that identical sister histones can end up with different modifications. But, it was not clear what effect this had.
To adress this issue, there are two questions to answer. What do asymmetric sister histones do in living cells? And, does a modification to one histone affect its sister? Gene editing could help scientists to understand the effect of asymmetrical tail modification by forcing cells to make non-identical sister histones. However, this is challenging because most animals studied in the laboratory have many copies of the genes for histones. Fruit flies, for example, have 23 copies of their histone genes. The single-celled yeast Saccharomyces cerevisiae has only two copies of its histone genes. Yet, even if one of these genes was replaced with a mutant gene and the other left unedited or “wild-type”, there would be nothing to stop the cell from forming nucleosomes in which both sister histones were still identical – that is to say, mutant with mutant or wild-type with wild-type.
Now, Zhou, Liu et al. report a new method that allowed them to edit the tail sequence of one H3 histone but not its sister. First, they searched for, and found, a pair of mutant H3 genes, which encode two extremely similar but different H3 proteins that could bind to each other but not to themselves. As a result, yeast cells with the genes for these proteins could only form nucleosomes in which the sister H3 histones were non-identical. Next, Zhou et al. made a small change to the tail of one of the H3 sisters which meant it could not be modified. The resulting nucleosomes contain one H3 histone with a wild-type tail and one with a mutant tail. The cell could only modify one of them, mimicking natural asymmetrical modifications.
The new technique revealed that modification of one sister does not affect the the other. It also revealed that modifications to sister histones can work both alone and together. In some cases, the cell needs only edit one tail to affect the use of a gene. Other times, it must edit both tails for greatest effect.
This new tool is the first step in understanding the contribution of the tails of sister histones in living cells. In future, it should help to uncover the effect of different combinations of modifications. This could shed light on how cells control the use of different genes.
Introduction
In eukaryotes, chromatin carries both genetic and epigenetic information that controls multiple cellular processes, such as DNA replication, transcription and genome organization (Berger, 2007; Lawrence et al., 2016; Papamichos-Chronakis and Peterson, 2013). The basic unit of chromatin is the nucleosome, which comprises ~147 bp of DNA and a histone octamer formed by two copies of histone H2A-H2B and H3-H4 heterodimers (Bentley et al., 1984; Kornberg and Thomas, 1974; Luger et al., 1997; Oudet et al., 1975). The packaging of DNA into nucleosomes affects sequence accessibility, and nucleosomes therefore regulate the activity of DNA-binding proteins (Lee et al., 1993; Wasylyk and Chambon, 1979). Histones also appear to protect DNA from breaking and maintain the fidelity of both replication and transcription (Carrozza et al., 2005; Govind et al., 2007; Joshi and Struhl, 2005; Keogh et al., 2005; Pinskaya et al., 2009). The regulation of nucleic acid metabolism by nucleosomes is mediated through multiple post-translational modifications (PTMs), such as methylation, acetylation, phosphorylation, and sumoylation (Lawrence et al., 2016).
Histone lysine methylation, especially on histone H3, regulates chromatin structure and transcription (Ng et al., 2002; Vermeulen and Timmers, 2010; Wagner and Carpenter, 2012). In budding yeast, the best-studied methylations on histone H3 are methylation of lysine at amino acid positions 4, 36, and 79 (H3K4, H3K36 and H3K79, respectively). H3K4 di- and tri-methylation (H3K4me2/3) is catalyzed by the Set1 complex (also called the COMPASS complex) and is associated with steady-state gene transcription; thus, H3K4me2/3 is considered to be an ‘activating’ mark in mammals. Conversely, in budding yeast, most of the evidence indicates that H3K4 methylation is a repressive mark (Shilatifard, 2006; Weiner et al., 2012). H3K36 tri-methylation (H3K36me3) by Set2 directs the deacetylation of histones, predominantly at the 3’ portion of gene open reading frames (ORFs), to suppress spurious intragenic transcription initiation (Carrozza et al., 2005). Methylation of H3K79 (H3K79me) affects telomeric heterochromatin structure because mutations at H3K79 as well as inactivation of its methyltransferase, Dot1, lead to loss of telomere silencing (Jones et al., 2008; Ng et al., 2002). The functions of each modification are largely dissected by using histone mutations in combination with the inactivation of corresponding methyltransferases, under which circumstances the modifications on both sister histones are simultaneously removed, making it difficult to study the crosstalk between modifications on sister histones.
Although two copies of each histone in a nucleosome possess identical protein sequences, histone-modification enzymes do not always modify sister histones simultaneously (van Rossum et al., 2012; Voigt et al., 2013). For example, symmetrical modification of histone lysines within a nucleosome is not globally required in HeLa cells (Chen et al., 2011). In addition, in different cell types, a significant number of nucleosomes contain asymmetrically modified sister histones (Fisher and Fisher, 2011; Mikkelsen et al., 2007; Voigt et al., 2012). Furthermore, asymmetrically modified nucleosomes are present in embryonic stem cells but are symmetrically modified upon differentiation (Voigt et al., 2012). Each of these studies suggests that sister histones within a single nucleosome may function independently in gene regulation. A synthetic system for the generation of asymmetrically modified nucleosomes has been used to study histone PTM crosstalk in vitro (Lechner et al., 2016), but the lack of a genetic model system for studying asymmetric histone modifications in vivo has prevented exploration of the biological significance of this previously documented phenomenon.
To investigate the individual contributions of sister histones and their modifications to chromatin structure and function, we employed a protein engineering strategy to mutate both copies of histone H3 in their interaction interface. After screening for mutants that were able to form histone H3 heterodimers but not H3 homodimers, we successfully set up a bivalent nucleosome system in the budding yeast Saccharomyces cerevisiae. By using this unique system, we validated the establishment of asymmetrically methylated H3K4, H3K36 or K3K79 in chromatin in yeast in vivo. Furthermore, we examined the functions of asymmetrically modified sister histones in the regulation of chromatin structure and gene transcription. Our results revealed that modifications such as H3K4me, H3K36me or K3K79me on sister histone H3s could be independent of each other. In addition, the same modifications on both sister H3 histones can affect transcription in a cooperative, independent or redundant manner. Our study provides the first picture of the individual contributions of sister histones to chromatin dynamics in vivo.
Results
A bivalent nucleosome system to study sister histone H3s in yeast
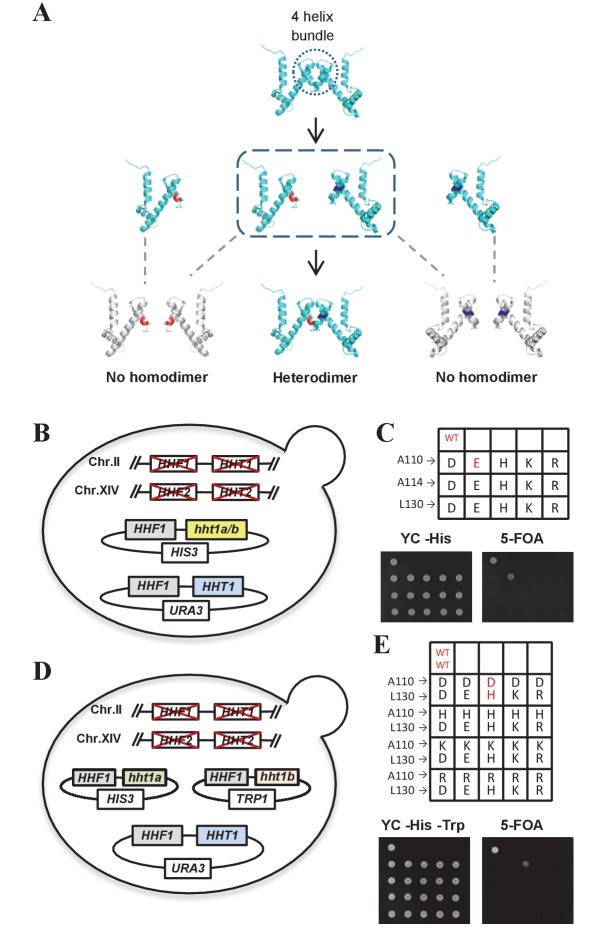
In S. cerevisiae, each canonical histone is encoded by two genes. H3 is encoded by HHT1 and HHT2, and H4 is encoded by HHF1 and HHF2. The histone genes are organized into a pair of divergently transcribed loci with HHT1-HHF1 and HHT2-HHF2 linked together. Owing to redundancy, deletion of either locus does not cause lethality (Dollard et al., 1994). As asymmetrical modifications have previously been reported on histone H3 in vivo (Voigt et al., 2012), we began by examining H3. Previous structural work revealed that two molecules of histone H3 interact through their carboxy-terminal four-helix bundle to form a homodimer (Luger et al., 1997; Ramachandran et al., 2011; White et al., 2001) (Figure 1A). We performed site-directed mutagenesis on the Ala110, Ala114 and Leu130 residues of the HHT1 gene. These residues were chosen because they were spatially close and within the bundle region that interacts to form the H3 homodimer (Luger et al., 1997; Ramachandran et al., 2011; White et al., 2001). These neutral amino acids were mutated to acidic or basic residues to make them electronegative or electropositive under physiological conditions. We reasoned that if we created an H3 allele with an electronegative (or electropositive) interface, it would not form homodimers, but it would interact with a different H3 allele with an electropositive (or electronegative) interface, thereby creating a heterodimer (Figure 1A).
Figure 1. The complementary mutants of histone H3A110D and H3L130H are assembled into nucleosomes in vivo.
(A) Schematic illustration of the production of histone H3 mutants that are able to complement and form heterodimers. (B and D) Schematic strategy for screening histone H3 mutants. Genomic HHF1, HHF2 (encoding histone H4), HHT1 and HHT2 (encoding histone H3) genes were knocked out, and yeast cells (LHT001 background) were transformed with plasmids expressing wild-type (WT) or mutated histone H3 along with WT H4. (C) Histone H3 mutants cannot survive without WT histone H3. Dotting assay was performed to examine the cell viability of WT cells (LHT001) and 15 histone H3 mutants carrying pRS313-hht1a/b (HIS3 marker). (E) H3A110D and H3L130H mutants can form a heterodimer. Mutants carrying both pRS313-hht1a (HIS3 marker) and pRS314-hht1b (TRP1 marker) were dotted on a 5-fluoroorotic acid (5-FOA) plate. WT and mutants that survived on 5-FOA plate are highlighted in red.
Figure 1—figure supplement 1. The pairwise histone H3 mutants other than H3A110D and H3L130H cannot grow when the WT histone H3 gene is counter-selected using 5-FOA.
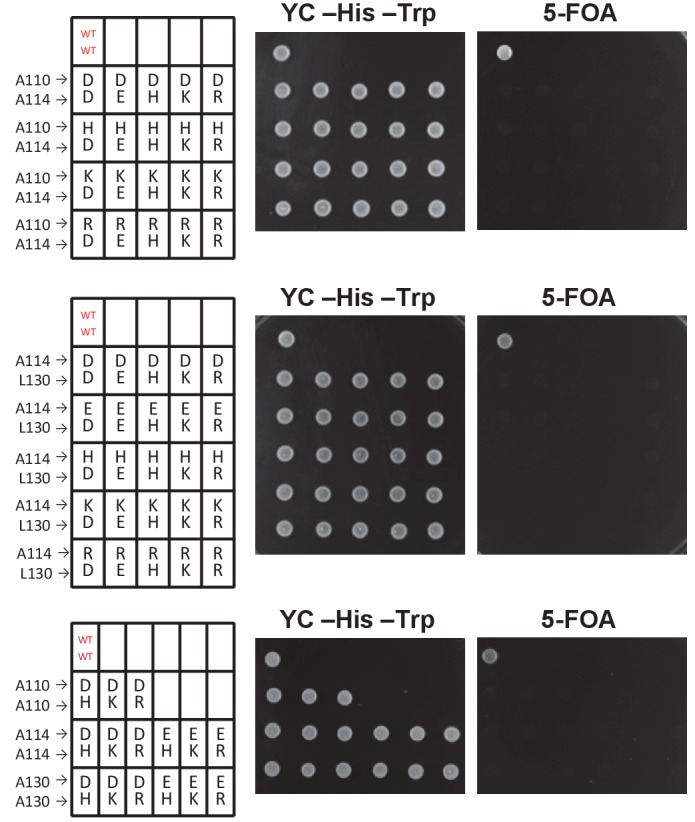
Yeast cells lacking chromosomal HHT1 and HHT2 genes but containing the HHT1 gene on a counter-selectable URA3 plasmid were transformed with plasmids carrying the mutated histone H3 genes. We then screened for histone H3 mutants that did not support cell viability when loss of the wild-type (WT) HHT1 gene was counter-selected using 5-fluoroorotic acid (5-FOA) (Figure 1B). Only the H3 mutant bearing the A110E mutation survived (Figure 1C), suggesting that the other 14 histone H3 mutants could not form a homodimer. Next, yeast cells were co-transformed with the pairwise plasmids carrying these 14 mutated histone H3 genes (Figure 1D). Notably, only the H3A110D and H3L130H pairing was able to support cell viability on a 5-FOA plate (Figure 1E; Figure 1—figure supplement 1), allowing us to infer that the H3A110D and H3L130H mutants form a heterodimer that could be assembled into functional nucleosomes in vivo. Considering that histidine's positive charge is weakened under physiological pH conditions and may increase the risk for H3L130H self-interaction, we used the relatively weaker ADE3 promoter to reduce the expression of H3L130H (Agez et al., 2007; Antczak et al., 2006). This strain will be hereafter referred to as the H3D/H3H strain.
Characterization of the H3D/H3H strain
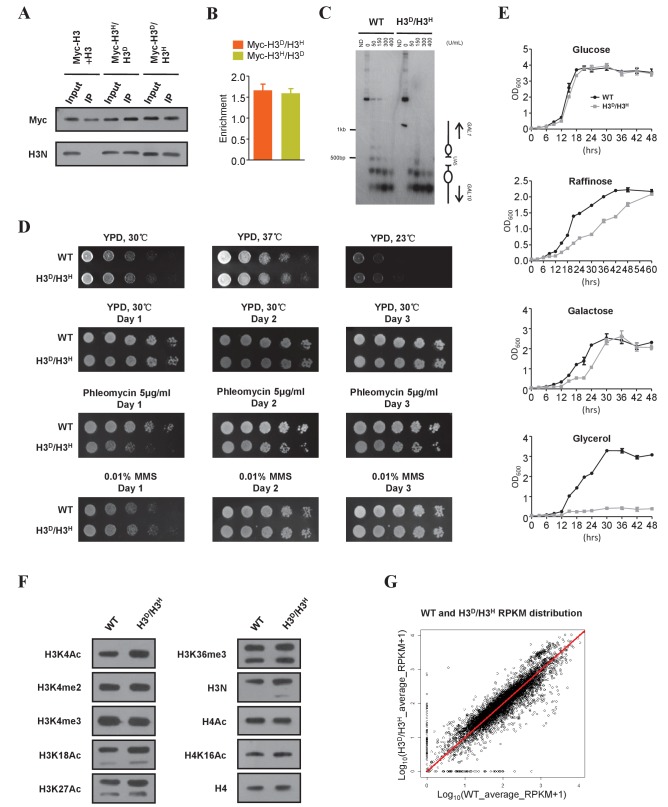
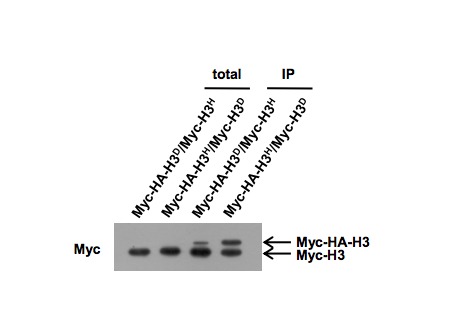
To confirm that mutant histones H3A110D and H3L130H equally assembled into nucleosomes, we epitope-tagged one copy of H3 in H3D/H3H cells with Myc. After preparing mono-nucleosomes (Figure 2—figure supplement 1), we performed immunoprecipitations with an anti-Myc antibody and examined both Myc-tagged and untagged histone H3. In the control, the chromatin from both the myc-H3 strain and the untagged H3 strain was mixed, and the immunoprecipitation of mononucleosomes using the anti-Myc antibody did not pull down untagged H3 (Figure 2A, second lane). As the anti-H3 N-terminal antibody could not recognize Myc-tagged histone H3 (Figure 2A), we normalized immunoprecipitated myc-H3L130H and myc-H3A110D to the same level. The amounts of the co-immunoprecipitated complementary H3A110D and H3L130H histones were identical (Figure 2A), reflecting an equal incorporation of H3A110D and H3L130H into mononucleosomes in H3D/H3H cells. Next, we examined the ratio of H3A110D to H3L130H and the nucleosome positioning at the GAL1-10 gene locus in the H3D/H3H cells. GAL1-10 intergenic chromatin consists of a non-nucleosomal, UAS-containing hypersensitive region (Lohr, 1984; Lohr and Hopper, 1985) surrounded by positioned nucleosomes (Lohr and Lopez, 1995; Lohr et al., 1987). A chromatin immunoprecipitation (ChIP) assay showed almost the same enrichment of H3A110D and H3L130H at the GAL1 gene promoter (Figure 2B), supporting our conclusion that mutant histones H3A110D and H3L130H were assembled into nucleosomes at a ratio of 1:1 in vivo. MNase digestion of the GAL1-10 promoter revealed that the nucleosome array on the GAL10 side of the UAS region displayed a similar digestion pattern in H3D/H3H and WT cells, but the nucleosome array on the GAL1 side showed a more evenly digested pattern in WT cells than in H3D/H3H cells (Figure 2C), suggesting altered nucleosome stability in the GAL1 region in H3D/H3H cells.
Figure 2. Characterization of the H3D/H3H strain.
(A) Mononucleosomes prepared from both the cells expressing Myc-tagged H3 (ZL38) and the cells expressing untagged H3 (LHT001) were mixed (Myc-H3 +H3) and immunoprecipitated with the anti-Myc antibody. The same immunoprecipitation (IP) assay was performed with mononucleosomes from strains bearing Myc-H3L130H/H3A110D (Myc-H3H/H3D) and Myc-H3A110D/H3L130H (Myc-H3D/H3H). The precipitated mononucleosomes were denatured and examined by western blotting with both anti-Myc (Myc) and anti-histone H3 N-terminal antibodies (H3N). (B) Chromatin IP (ChIP) analysis was performed in Myc-H3A110D/H3L130H (Myc-H3D/H3H) and Myc-H3L130H/H3A110D (Myc-H3H/H3D) cells using anti-Myc antibody. The precipitated DNA was analyzed by qRT-PCR with primers specific for the GAL1-10 gene promoter and normalized to the ACT1 gene. Error bars indicate s.e.m. for three independent experiments. (C) MNase digestion of nuclei from WT (LHT001) and H3D/H3H strains. Nuclei were digested with increasing concentrations of MNase for 4 min. MNase cleavage sites were mapped from the EcoRI site within GAL10 by indirect end labeling analysis on a 1.6% agarose gel. Marker fragments are from PCR products of 1 kb and 500 bp in length. The UAS region and nucleosome positions are schematically shown on the right. ND, naked DNA. (D) Dotting assays were performed in H3D/H3H mutant and WT (LHT001) cells. Plates were photographed after incubation at 37°C, 30°C and 23°C on yeast extract peptone dextrose (YPD) medium or after incubation at 30°C on YPD, YPD containing phleomycin and YPD containing MMS on Days 1, 2 and 3. (E) Growth curve assays were performed in H3D/H3H mutant and WT cells for the indicated time in medium containing different carbon sources. (F) Yeast chromatins extracted from WT (LHT001) and H3D/H3H strains were monitored by western blot analysis with antibodies against H3K4ac, H3K4me2, H3K4me3, H3K18ac, H3K27ac, H3K36me3, H3N (H3 N-terminal), H4ac, H4K16ac and H4. Signals are normalized by anti-H4 antibody. (G) Scatter plot showing the average Reads Per Kilobase per Million mapped reads (RPKM) of two replicates distribution of the WT (LHT001) and H3D/H3H strains. The Pearson's product-moment correlation of Log10(WT_average_RPKM +1) and Log10(H3D/H3H _average_RPKM +1) is 0.9236. The red line is the fitted curve, which has a slope of 0.9966 and which passes through the (0,0) point. R-square is 0.98 and p value≤2.2e-16 (see Materials and methods for details).
Figure 2—figure supplement 1. Mononucleosome preparation from H3D/H3H cells.
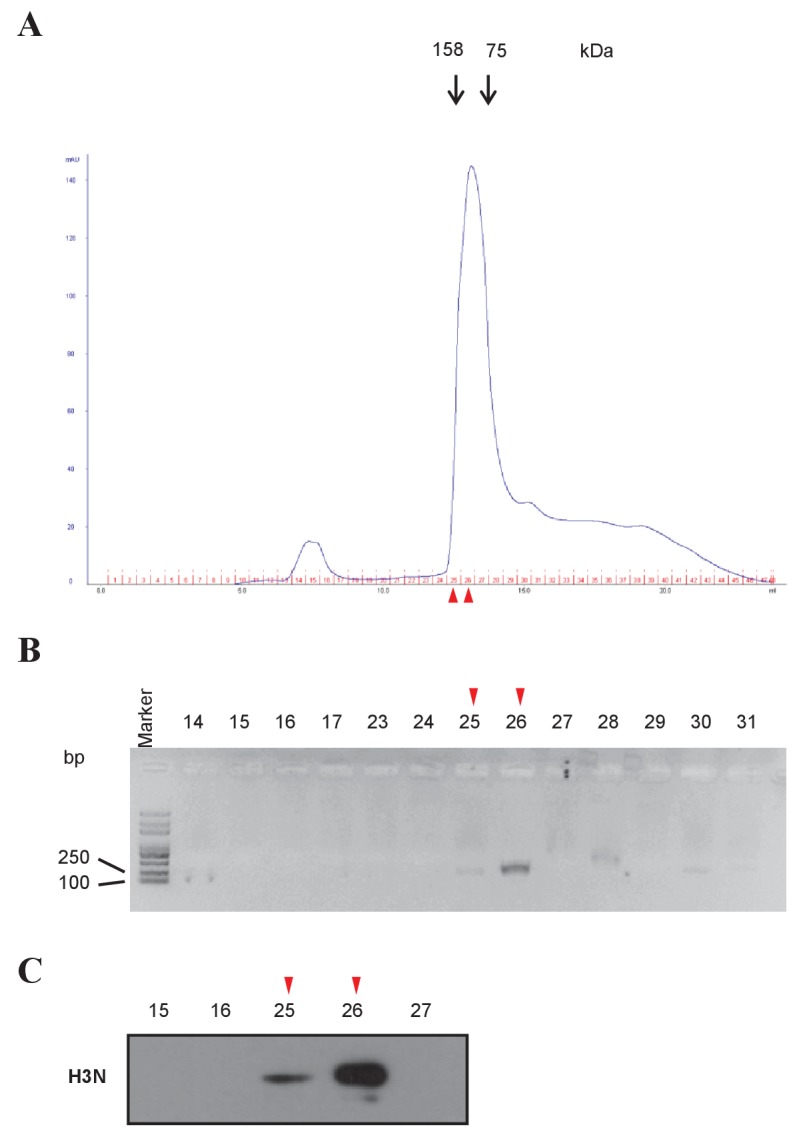
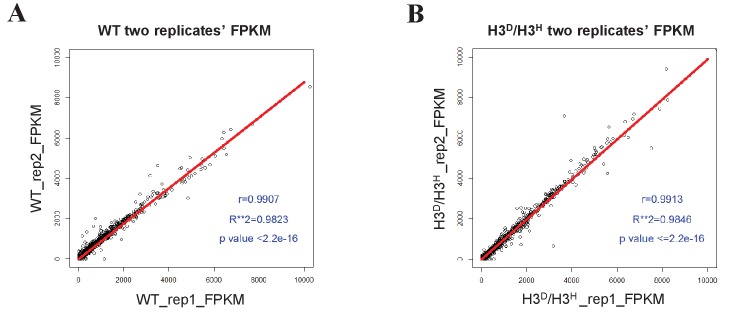
Figure 2—figure supplement 2. Sample-to-sample reproducibility for the RNA-Seq assay of WT (LHT001) and H3D/H3H strains.
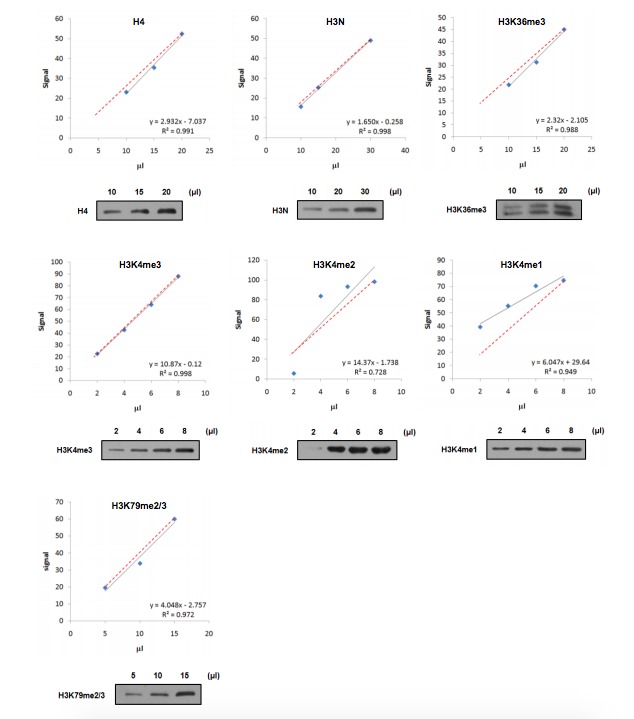
We next determined the functional viability of the H3D/H3H mutant using the histone shuffle strain (LHT001) as a WT control. H3D/H3H mutant and WT cells exhibited identical growth rates in yeast extract peptone dextrose (YPD) medium at 23°C, 30°C and 37°C. In addition, when H3D/H3H cells were challenged by rapamycin (data not shown) or DNA-damage reagents, such as phleomycin or methyl methanesulfonate (MMS), they showed nearly the same sensitivity as WT cells (Figure 2D). Interestingly, compared with WT cells, H3D/H3H cells showed a reduced growth rate when cultured in raffinose or glycerol medium (Figure 2E). We then checked the levels of multiple histone PTMs in WT and H3D/H3H strains by western blot and found no significant differences (Figure 2F). Further, we performed a genome-wide RNA-Seq assay to examine the gene expression profiles in WT and H3D/H3H strains. Statistical analysis confirmed the reproducibility of the RNA-Seq results in each strain (Figure 2—figure supplement 2). The global gene expression profile of the H3D/H3H strain was found to be very similar to that of the WT strain (Figure 2G), but we did see some genes with expression levels that varied between the H3D/H3Hand WT strains. Through Gene Ontology analysis (see the Materials and methods for details), we found that most of the outliers were downregulated by histone H3 mutations. Interestingly, the genes encoding cytochrome-c reductase activity and ATPase activity were among the outliers (Tzagoloff et al., 1975) (Figure 2—source data 2). This finding might provide an explanation for the reduced growth of the H3D/H3H strain when glycerol was used as the carbon source (Figure 2E).
Taken together, the observations presented in Figure 2 indicated that the H3D/H3H strain behaved similar to the WT strain under most, but not all of the tested circumstances; thus, this strain provides a unique and valid system for analyzing asymmetrically modified sister histones.
N-terminal deletion of one sister histone H3 tail does not affect the other tail
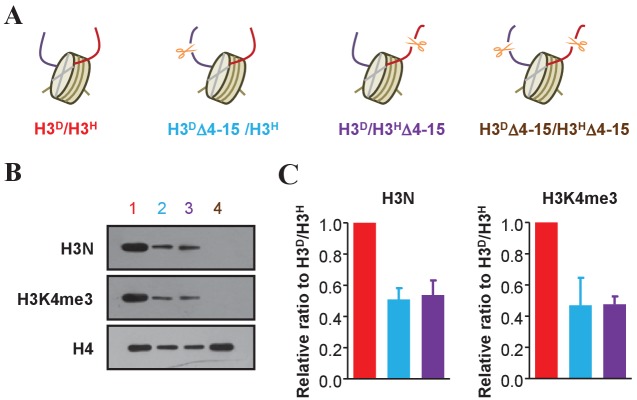
To address whether there is crosstalk between the amino-terminal tails of sister histone H3s in one nucleosome, we constructed strains that lacked the N-terminal 4–15 amino acids on one or both sister H3 histones (Mann and Grunstein, 1992). The H3DΔ4–15/H3H and H3D/H3HΔ4–15 strains contained one copy of N-terminal-deleted H3, resulting in asymmetrically deleted histone H3 (Figure 3A). The H3DΔ4–15/H3HΔ4–15 strain containing two copies of N-terminal-deleted H3 was also constructed and used as a negative control. The nucleosomes of the H3D/H3H (treated as WT hereafter) and mutant strains were precipitated, and western blots were performed to examine the levels of histone H3 N-terminal and K4 tri-methylation. Both histone H3 N-terminal and H3K4me3 signals in H3DΔ4–15/H3H and H3D/H3HΔ4–15 cells were reduced to approximately half of those observed in H3D/H3H cells (Figure 3B and C). These results indicated that H3 N-terminal deletion on one sister H3 did not influence H3K4 methylation on the other.
Figure 3. Examination of an asymmetric deletion in the N-terminus of histone H3.
(A) Schematic illustration of asymmetrical N-terminal-deleted histone H3 mutants of H3DΔ4–15/H3H, H3D/H3HΔ4–15 and H3DΔ4–15/H3HΔ4–15 derived from the H3D/H3H strain. The genotype of each mutant is labeled in a different color, and these colors are applied to identify each mutant in all the panels in this figure. (B) Asymmetric H3 N-terminal-deletion is successfully established on chromatin. Nucleosomes were immunoprecipitated by the anti-H2B antibody from cells of the yeast strains in (A) and analyzed by western blotting using the anti-H3 N-terminal antibody, the anti-H3K4me3 antibody and, as a normalization, the anti-H4 antibody. (C) Quantification of the H3N and H3K4me3 signals in (B) as mean ratio relative to H3D/H3H and normalized to H4 signals. (See the Materials and methods for quantification details.)
K4 me2/3 on sister H3s independently regulates the transcription efficiency of GAL1 upon induction
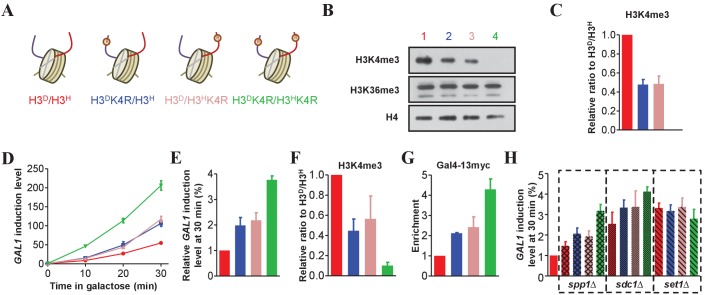
As the genes for H3A110D and H3L130H encoded compatible and functional histone H3 proteins, we anticipated that the substitution of K with R on one sister H3 would largely mimic unmethylated K. Thus, asymmetrically modified nucleosomes could be assembled in chromatin in vivo. To test this idea, we first introduced the K4R mutation into H3A110D (H3DK4R) or H3L130H (H3HK4R) in the H3D/H3H strain (Figure 4A). Western blotting showed that H3K4me3 in H3DK4R/H3H or H3D/H3HK4R cells was approximately 50% lower than that in H3D/H3H cells, whereas little difference in H3K36me3 was detected among the tested strains (Figure 4B and C). Therefore, these results suggest that the hybrid strains contain only mimics of asymmetrically deposited K4me3. For sister H3 histones in a nucleosome, a lack of K4me3 in one tail did not influence K4me3 in the other tail, consistent with the observation in Figure 3B. In addition, H3K4me3 and H3K36me3 were independent of each other because the decrease in H3K4me3 did not alter the level of H3K36me3.
Figure 4. Asymmetrically methylated K4 on sister H3s independently upregulates GAL1 transcription efficiency.
(A) Schematic illustration of asymmetrical mutation of histone H3K4R on either H3A110D (H3D) or H3L130H (H3H). The K to R mutation is marked by ® on the histone H3 tails. The color labeling of each strain is applied for all the corresponding panels. (B) Asymmetrical K4me3 marks on sister H3s are successfully established on chromatin. Nucleosomes were immunoprecipitated by the anti-H2B antibody from isogenic strains and analyzed by western blotting using anti-H3K4me3, anti-H3K36me3 and, as a normalization, anti-H4 antibodies. (C) Quantification of western blotting signals for H3K4me3 as mean ratio relative to H3D/H3H and normalized to signals for H4. (D) The cells with asymmetrical sister K4me3 show an intermediate level of GAL1 gene expression. Yeast strains illustrated in (A) were subject to galactose induction. Total RNA was prepared at the indicated time points and analyzed by real-time quantitative PCR (qRT-PCR) with primers specific for GAL1 and normalized by ACT1. (E) An alternative representation of the data in (D) at 30 min is expressed as mean ratio to H3D/H3H, whose level was set to 1. (F) Asymmetric K4me3 on sister H3s is established in GAL1. ChIP experiments were performed on the promoter of GAL1 in the indicated yeast strains using the anti-H3K4me3 antibody, and values are normalized to histone H4. (G) The levels of Gal4 recruitment are inversely proportional to the levels of K4me3. Gal4 was tagged with 13 × myc, and ChIP experiments were performed on the UAS region of GAL1 in the indicated yeast strains with anti-Myc antibody. (H) Detection of GAL1 levels when SPP1, SDC1 or SET1 is deleted. SPP1, SDC1 or SET1, respectively, was knocked out in the indicated strains, which were subject to galactose induction. RNA was extracted, analyzed and expressed as in (E). H3D/H3H cells are regarded as WT controls. All of the ChIP values are expressed as mean ratio to H3D/H3H, whose level was set to 1. All error bars indicate s.e.m. for at least duplicated experiments.
Cells that lack histone H3K4 methylation have an increased GAL1 induction level (Pinskaya et al., 2009). To assess the effect of asymmetrical H3K4me3 on transcription, we assessed GAL1 mRNA levels in K4R mutant cells. Compared with H3D/H3H cells, H3DK4R/H3H and H3D/H3HK4R single-tail mutant cells showed a two-fold increase in GAL1 mRNA levels. Compared with single-tail mutant cells, H3DK4R/H3HK4R double-tail mutant cells showed a further two-fold increase in GAL1 mRNA levels (Figure 4D and E). GAL1 mRNA levels were inversely proportional to H3K4me3 levels at the GAL1 promoter (Figure 4F), suggesting a tight correlation between induction levels and H3K4me3 abundance. We also examined the enrichment of Gal4 binding to the GAL1 promoter using a ChIP assay. Gal4 is the primary activator of GAL1 transcription (Johnston, 1987). A moderate level of Gal4 recruitment to the GAL1 promoter was observed in the asymmetrical H3DK4R/H3H and H3D/H3HK4R mutant strains compared with that in their symmetrical H3D/H3H and H3DK4R/H3HK4R counterparts (Figure 4G). Therefore, each K4me3-modified sister histone H3 contributed independently to GAL1 gene transcription, which is probably recognized and read by the GAL1 activator Gal4.
Set1C in yeast contains eight subunits, including Set1, Spp1 and Sdc1, and is responsible for methylating histone H3K4 (Dehé and Géli, 2006; Roguev et al., 2001). Deletion of SET1 eliminates H3K4 mono-, di- and tri-methylation; deletion of SPP1 affects only H3K4 tri-methylation; and deletion of SDC1 affects di- and tri-methylation of H3K4 (Pinskaya et al., 2009). To address which type of asymmetrical H3K4 methylation affects GAL1 transcription, and to confirm that the changes in gene expression were due to asymmetrical H3K4 methylation instead of the K4R mutation, we knocked out SET1, SPP1 and SDC1 in the H3D/H3H, H3DK4R/H3H, H3D/H3HK4R and H3DK4R/H3HK4R strains and examined GAL1 levels in galactose medium. As the data show, loss of SPP1, SDC1 and SET1 led to the upregulation of GAL1 transcription, which is consistent with previous findings (Pinskaya et al., 2009). Meanwhile, an intermediate level of GAL1 expression was seen in spp1∆ H3DK4R/H3H and spp1∆ H3D/H3HK4R cells, whereas no significant difference was found in either sdc1∆ or set1∆ mutants (Figure 4H). As distinguishing between the effects of H3K4me2 and H3K4me3 is difficult, we concluded that H3K4me2/3 but not mono-methylation of H3K4 on sister H3s contributed the most to GAL1 regulation.
K36 methylation on sister H3s independently regulates transcription initiation fidelity
As both asymmetrical H3 N-terminal deletion and asymmetrical H3K4me3 were successfully assembled in chromatin, we constructed mutants that mimicked asymmetrical H3K36me. A K36R mutation was introduced into H3A110D (H3DK36R) or H3L130H (H3HK36R) in the H3D/H3H strain (Figure 5A). The level of H3K36me3 and H3K4me3 on chromatin was examined by western blotting. When compared with H3D/H3H cells, H3DK36R/H3H or H3D/H3HK36R cells showed an approximately 50% decrease in H3K36me3, whereas little difference in H3K4me3 was detected among the tested strains (Figure 5B and C). These data indicated that the H3DK36R/H3H or H3D/H3HK36R mutants contained only mimics of asymmetrically deposited K36me3, and loss of K36me3 on one tail did not affect K36me3 on the other tail. In addition, in agreement with the data shown in Figure 4B, H3K36me3 and H3K4me were independently regulated chromatin modifications.
Figure 5. The H3K36me3 marks on sister histones regulate transcription independently.
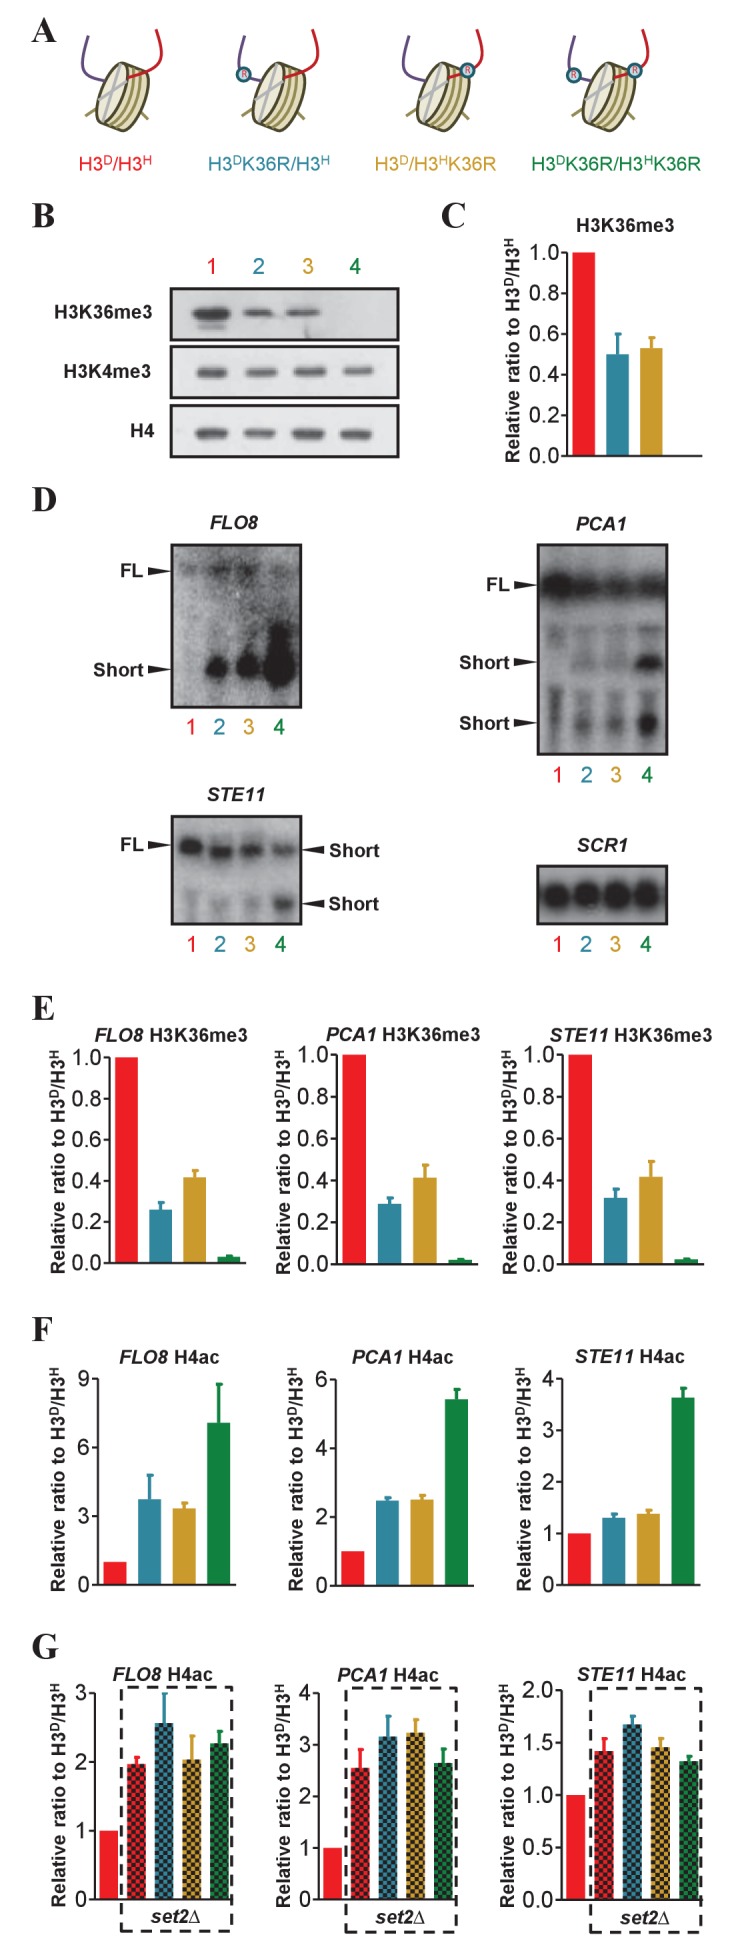
(A) Schematic illustration of asymmetrical mutation of histone H3K36R on either H3A110D (H3D) or H3L130H (H3H). The K to R mutation is marked by ® on the histone H3. The color labeling of each strain is applied for all the corresponding panels. (B) Asymmetrical K36me3 on sister H3s is successfully established on chromatin. Nucleosomes were immunoprecipitated by anti-H2B antibody from isogenic strains, as identified by colored numbers, and analyzed by western blot using anti-H3K4me3, anti-H3K36me3 and, as a normalization, anti-H4 antibody. (C) Quantification of western blot signals for H3K36me3 as mean ratio relative to H3D/H3H and normalized to signals for H4. (D) Northern blot analysis of the FLO8, STE11 and PCA1 transcripts in H3K36R mutants. RNA from H3D/H3H, H3DK36R/H3H, H3D/H3HK36R and H3DK36R/H3HK36R strains was probed with sequences complementary to the 3' region of FLO8, STE11, PCA1 and, as a loading control, SCR1. The full-length (FL) and short transcript signals are indicated. (E and F) Asymmetric K36me3 on sister H3s results in an intermediate level of H4ac in FLO8, STE11 and PCA1. ChIP experiments were performed in 3' ORF region of FLO8, STE11 and PCA1 in the indicated cells with anti-H3K36me3 antibody (E) and anti-H4ac antibody (F). Values are normalized to histone H4 and expressed as mean ratio to H3D/H3H. (G) H4ac level of the FLO8, STE11 and PCA1 loci in set2∆ cells bearing different K36me3 states on sister H3s. SET2 was knocked out in the indicated cells and ChIP experiments were performed as in (E). Values are normalized to histone H4 and expressed as mean ratio to H3D/H3H. The H3D/H3H cells are regarded as a WT control. In all cases, the values of H3D/H3Hare set to 1. All error bars indicate s.e.m. for at least duplicated experiments.
H3K36me3 directs deacetylation of histone H4 in gene-coding regions to suppress spurious intragenic transcription (Carrozza et al., 2005). To address whether H3K36me3 on both sister histone H3s contributed to the regulation of cryptic transcription, we tested the level of intragenic initiation in the H3K36R mutants within the FLO8, PCA1 and STE11 genes. Each of these genes is regulated by K36 methylation. Northern blot analysis showed that the loss of K36 methylation on H3 tails resulted in short transcripts of the tested genes, consistent with previous findings (Carrozza et al., 2005; Li et al., 2007). Compared with H3D/H3H cells and symmetrically mutated H3K36 cells, asymmetrical H3DK36R/H3H and H3D/H3HK36R cells exhibited an intermediate level of short transcripts (Figure 5D). We next used anti-acetylated histone H4 antibodies to perform a ChIP assay on the 3’ ORF of the FLO8, PCA1 and STE11 genes. H4 acetylation (H4ac) levels in H3DK36R/H3H and H3D/H3HK36R cells were intermediate relative to those in H3D/H3H cells and symmetrically mutated H3K36 cells. Moreover, H4ac levels were inversely correlated with H3K36me3 levels in the same region (Figure 5E and F). In the absence of Set2, the level of H4ac in the tested genes showed no significant differences in H3D/H3H, H3DK36R/H3H, H3D/H3HK36R and H3DK36R/H3HK36R cells (Figure 5G). These observations indicated that the regulation of accurate transcription initiation was sensitive to the magnitude of H3K36me3. Accordingly, H4ac levels were regulated by H3K36me3 on both sister histones. In light of these data, we concluded that H3K36me3 on either sister histone played an independent regulatory role in suppressing spurious intragenic transcription.
K79 methylation on sister H3s cooperatively regulates gene silencing in telomeric regions
H3K79 methylation regulates gene silencing in some telomere-proximal regions (Takahashi et al., 2011). To address whether the H3K79 methylation of both sister histones is required to maintain silent chromatin near telomeres, we used strains in which H3K79 could be methylated at either one (H3DK79R/H3H and H3D/H3HK79R) or none (H3DK79R/H3HK79R) of the H3 sister histones (Figure 6A). Western blot analysis revealed that H3K79me2/3 levels in H3DK79R/H3H and H3D/H3HK79R cells were approximately 50% lower than those in H3D/H3H cells (Figure 6B and C), suggesting the incorporation of asymmetrical H3K79me into chromatin and that the methylation of K79 occurs independently on each sister H3.
Figure 6. The H3K79me marks on both sister histones contribute to the regulation of sub-telomeric chromatin structure.
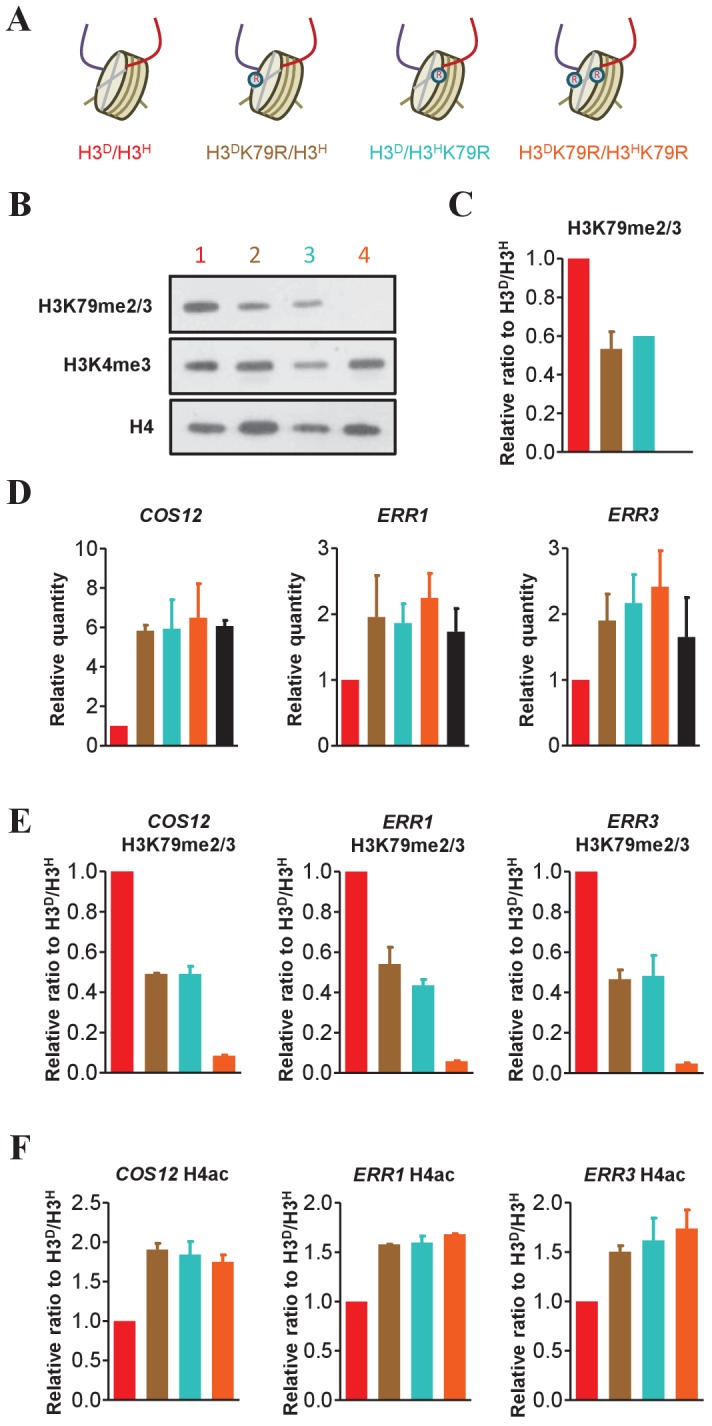
(A) Schematic illustration of the asymmetrical mutation of histone H3K79R on either H3A110D (H3D) or H3L130H (H3H). The K to R mutation is marked by on the histone H3. The color labeling of each strain is applied in the other panels in this figure. (B) Asymmetrical K79me2/3 on sister H3s is established on chromatin. Nucleosomes were immunoprecipitated by anti-H2B antibody from isogenic strains (identified by colored numbers) and analyzed by western blot using anti-H3K79me2/3, anti-H3K4me3 and, as a normalization, anti-H4 antibody. (C) Quantification of western blot signals for H3K79me2/3 as mean ratio relative to H3D/H3H. (D) Both H3K79me marks on sister H3s are required for the maintenance of telomere silencing. Total RNA was prepared and analyzed by real-time quantitative PCR (qRT-PCR) with primers specific for COS12, ERR1 and ERR3 and normalized by ACT1. The black bar represents data for samples of sir2∆ H3D/H3H mutants, acting as a positive control. Values are calculated and expressed as in Figure 4E. (E and F) Detection of K79me2/3 (E) and H4ac (F) at the promoters of the COS12, ERR1 and ERR3. ChIP experiments were performed on the promoters of COS12, ERR1 and ERR3 in the indicated cells with anti-H3K79me2/3 antibody (E) and anti-H4ac antibody (F). Values are normalized to histone H4 and expressed as mean ratio to H3D/H3H. All error bars indicate s.e.m. for at least duplicated experiments.
We examined the transcription levels of COS12, ERR1 and ERR3, which are located proximal to the telomeric ends of chromosomes VIIL, XVR and XIIIR, respectively (Takahashi et al., 2011). As expected, the K79R mutations on both sister H3s resulted in decreased silencing of those genes. Surprisingly, H3DK79R/H3H and H3D/H3HK79R cells containing asymmetrical H3K79me exhibited the same level of silencing loss as that of H3DK79R/H3HK79R or sir2∆ cells (Figure 6D). A ChIP experiment confirmed that K79me levels at the promoters of the genes tested in H3DK79R/H3H and H3D/H3HK79R cells decreased to approximately half of those in H3D/H3H cells (Figure 6E). Accordingly, the H4ac level in the ORF region was upregulated in K79R mutated cells (Figure 6F). Collectively, these data reveal that K79me marks on both sister H3s act cooperatively to maintain gene silencing near telomeres.
Cell sensitivity to genotoxic agents is affected by sister histone H3K4, H3K36 and H3K79 modifications
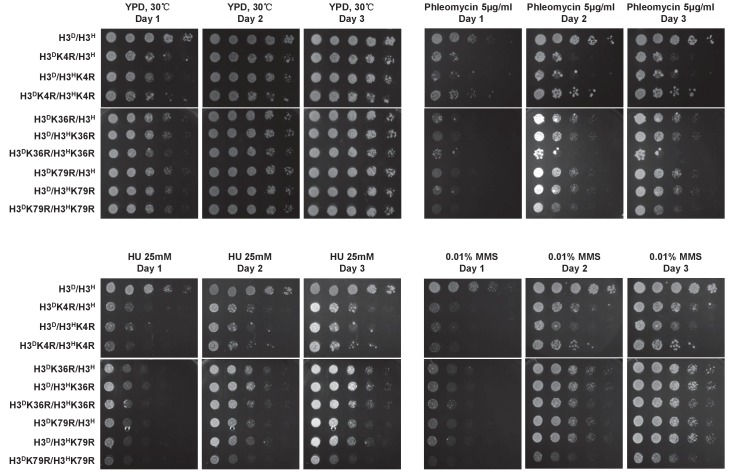
H3K4, H3K36 and H3K79 methylation affects DNA double-strand break (DSB) repair (Faucher and Wellinger, 2010; Jha and Strahl, 2014; Pai et al., 2014). Therefore, we examined the regulatory role of asymmetric H3K4, H3K36 or H3K79 methylation in DSB repair. Mutant cells bearing asymmetrical methylated or non-methylated H3K4, H3K36 or H3K79 were serially diluted and spotted onto plates containing various genotoxic chemicals, including phleomycin, hydroxyurea (HU) or MMS. H3K4R or H3K79R mutations on either one or two sister histones reduced cell growth in the presence of the tested genotoxins. Notably, the H3DK36R/H3HK36R mutant was hypersensitive to phleomycin and mildly sensitive to MMS. Compared with the wild type (H3D/H3H) and corresponding double-tail mutant, single-tail H3K36R or H3K79R mutants displayed an intermediate level of sensitivity to the genotoxic agents. The H3K4 mutants showed a similar level of sensitivity to HU and MMS, but single-tail H3K4R mutants displayed less growth in response to phleomycin treatment than did double-tail H3K4R mutants (Figure 7).
Figure 7. The performance of histone mutants challenged by multiple DNA damage reagents.
Dotting assay was performed in the indicated mutants as in Figure 2D. Plates were photographed after incubation at 30°C on YPD medium or YPD medium containing DNA damage reagents, that is, 5 mg/ml phleomycin, 25 mM HU and 0.01% MMS, for 1, 2 and 3 day(s).
Together, these observations suggest that, in response to DNA damage, H3K36me and H3K79me marks on sister histones functioned independently, whereas H3K4me marks on sister histones functioned cooperatively. Because the type of DNA damage triggered by the different genotoxic agents and the mechanisms of repair differ, we propose that the combination of sister histone modifications may influence DNA repair in different ways.
Genome-wide analysis of gene expression in mutants with asymmetrically methylated sister H3K4 under glucose starvation
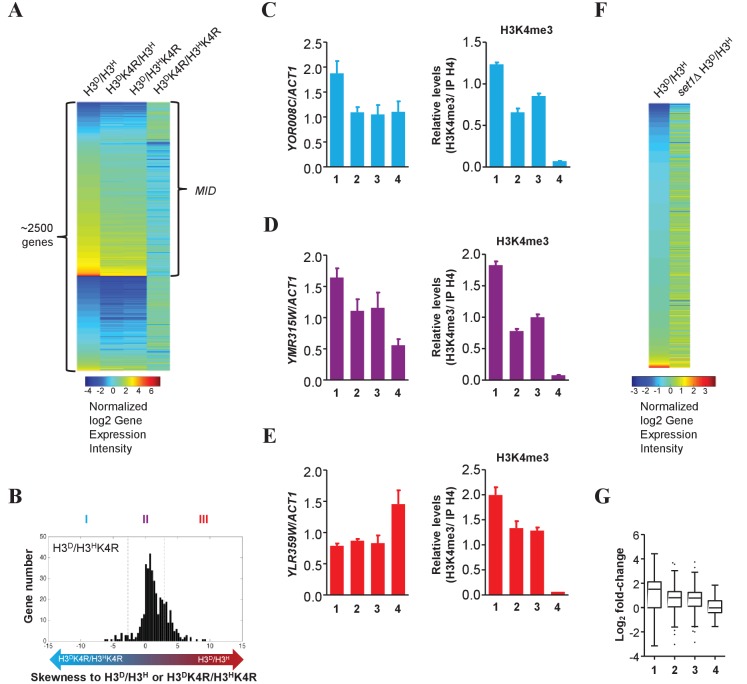
Chromatin regulators do not appear to affect steady-state transcription, but instead are required for transcriptional reprogramming induced by environmental cues (Weiner et al., 2012). For example, the genome-wide gene transcription profile of H3K4A cells was nearly the same as that of WT cells when the cells were grown under normal conditions, whereas differences were observed when the cells were challenged by multiple stress conditions (Weiner et al., 2012). To further unravel the genome-wide function of sister H3K4me on transcription, we shifted the cultures of H3K4R mutants and H3D/H3H strains from 2% to 0.05% glucose in the medium, which mimics calorie restriction. After the cells were grown in 0.05% glucose medium for an hour, we performed RNA-Seq to examine the genome-wide gene-induction profiles, which are presented as fold-change (level of induction). The fold-change value refers to the level of transcription in the induced strains divided by that in the uninduced strains. Of the 6000 genes in the yeast genome, approximately 2500 were altered by the H3K4 to R mutation in response to glucose starvation. Over 1500 genes’ fold-change (MID, as defined in Materials and methods) in both asymmetrical K4R mutants (H3DK4R/H3H and H3D/H3HK4R) fell between those of H3D/H3H cells and double K4R mutants (Figure 8—figure supplement 1A).
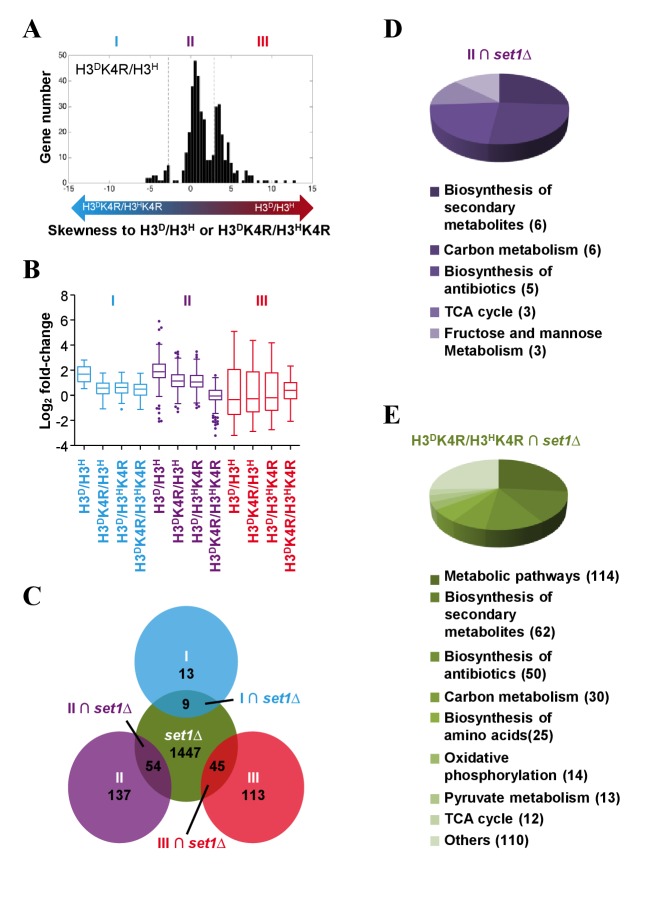
Statistical analysis by t-test and a gene skewness score (GSS) model described in the Materials and methods revealed that 22 genes’ fold-changes in asymmetrical K4R mutant (H3DK4R/H3H and H3D/H3HK4R) cells were nearly the same as those in symmetrical K4R mutant (H3DK4R/H3HK4R) cells (Figure 8A,B; Figure 8—figure supplement 1B, Cluster I), indicating cooperativity of sister K4me at these loci. The fold-changes of 191 genes in asymmetrical K4R mutant (H3DK4R/H3H and H3D/H3HK4R) cells exhibited an intermediate state between those in symmetrical K4R mutant (H3DK4R/H3HK4R) and WT(H3D/H3H) cells (p<0.05) (Figure 8A,B; Figure 8—figure supplement 1B, Cluster II), suggesting that K4me on sister H3s independently regulates the expression of these genes. The fold-changes of 158 genes in asymmetrical K4R mutant (H3DK4R/H3H and H3D/H3HK4R) cells were nearly the same as those in WT H3D/H3H cells (Figure 8A,B; Figure 8—figure supplement 1B, Cluster III), indicating redundancy of sister K4me at these loci. An approximately 50% decrease in H3K4me3 in asymmetrical K4R mutants was confirmed in the 5' ORFs of the YOR008C, YMR315W and YLR359W genes, which belong to the three clusters (Figure 8—figure supplement 1C–E). These assessments suggest that, in response to glucose starvation stress, H3K4me on two sister histones in different gene loci impose their effects on transcription in a cooperative (e.g., Cluster I), independent (e.g., Cluster II) or redundant (e.g., Cluster III) manner. Interestingly, the genes in Cluster I and II were mostly upregulated (log2fold change >0), while the genes in Cluster III were mostly downregulated (log2fold change <0) (Figure 8B), suggesting that under glucose starvation stress, the transcription of upregulated genes may require more subtle regulation mechanisms, such as asymmetrical modification of sister histones.
Figure 8. Genes in glycometabolism pathways are regulated by asymmetrically methylated K4 on sister H3s in response to glucose starvation.
(A) Histogram showing the gene skewness score (GSS) of asymmetrical K4R mutants in set MID calculated by a GSS model (see the Materials and methods for details). Bidirectional arrows with gradient colors indicate the increasing skewness of log2 fold change in asymmetrical K4R mutants to those in either H3D/H3H (red end) or H3DK4R/H3HK4R (blue end) cells. Genes are classified to three clusters (I, II and III) by t-test according to the protocols described in the Materials and methods. (B) Boxplots showing the gene's fold-changes of H3D/H3H and K4R mutants in three gene clusters (blue, cluster I; purple, cluster II; red, cluster III). The log2 fold-change values are calculated as described in the Materials and methods. (C) Venn diagram showing the overlaps between genes whose fold-change values are significantly altered by SET1 knockout in the H3D/H3H strain in response to glucose starvation (green circle), and the genes in clusters I (blue circle), II (purple circle), and III (red circle), respectively. (D and E) Pathways regulated by asymmetrically methylated K4 on sister H3s in response to glucose starvation. Pie charts show the pathways with which the genes are specifically associated, under the regulation of asymmetrical K4me on sister H3s (D), or under the regulation of K4me (E).
Figure 8—figure supplement 1. Genes in glycometabolism pathways are regulated by asymmetrically methylated K4 on sister H3s in response to glucose starvation.
Although the H3K4R mutation in chromatin largely mimics K4me0, it is not the same as K4me0, and the phenotypes seen in H3DK4R/H3H and H3D/H3HK4R cells might not result from loss of K4me. To address this issue, we examined the genome-wide gene expression profile of set1∆ cells under glucose starvation, and compared its fold-change with that of K4R mutants (Figure 8—figure supplement 1F). Many of the genes in Clusters I, II and III overlapped with genes that are regulated by SET1 deletion (Figure 8C, I∩set1∆, II∩set1∆ and III∩set1∆, respectively), indicating that these overlapping genes are most probably regulated by K4me rather than the K4R mutation on sister H3s.
Genes modified by sister H3K4me under glucose starvation are clustered in pathways associated with glycometabolism
To determine which pathways were regulated by asymmetrical K4me on sister H3s in response to glucose starvation, we carried out KEGG pathway analysis (Huang et al., 2009a, 2009b). Nine of the genes in the I∩set1∆ group and 45 of the genes in the III∩set1∆ group could not be mapped to any specific pathways in the KEGG database. Remarkably, 54 of the genes in the II∩set1∆ group, which is regulated by sister H3K4me, were enriched in the pathways involved in glycometabolism, such as carbon metabolism, TCA cycle, and fructose and mannose metabolism (Figure 8D). KEGG pathway analysis was performed on genes that were regulated by both the H3DK4R/H3HK4R mutation and SET1 deletion under glucose starvation. Interestingly, the three pathways involved in glycometabolism in the II∩set1∆ were also found in the list (Figure 8E). Therefore, under glucose starvation stress, a significant proportion of H3K4me-responsive genes are regulated by the fluctuation of H3K4me levels on sister H3s. Further analysis of the fold-changes of the genes in the glycometabolism-associated pathways revealed a pattern similar to that of Cluster II (Figure 8—figure supplement 1G), suggesting that the independent regulatory mode of sister H3K4me is an important player in response to glucose starvation stress. Collectively, these results support the notions that the on-off regulatory mode for H3K4me is more likely to be applicable to the transcription of genes that do not specifically respond to external stimuli (e.g., genes in the I∩set1∆ and III∩set1∆ groups), whereas the fine-tuning mode evolved to regulate the transcription of genes involved in stress-responsive pathways (e.g., genes in the II∩set1∆ group).
Discussion
In a nucleosome, two canonical sister histones display identical sequences, suggesting that they have evolved to play similar roles in the regulation of chromatin structure and function. However, similar to post-translational chemical modifications on any protein, the modifications of histones provide an additional layer of chromatin regulation. Paradoxically, sister histones with either asymmetrical modification or coexistence of activation and repression marks have been found in different cell types (Fisher and Fisher, 2011; Mikkelsen et al., 2007; Voigt et al., 2012), raising the possibility that sister histones in a single nucleosome may function independently. In this study, we took advantage of a yeast system that allows for facile genetic manipulation of histones. We identified H3 mutations that prevented homodimer formation and allowed heterodimer formation. After a series of intentional and systematic screenings, we established a bivalent nucleosome system that enabled us to express and monitor sister histone H3s independently in vivo. Owing to the nature of the nucleosome, which is the basic unit structure of chromatin, any possible indirect effect(s) caused by knocking-in a histone mutation cannot be fully excluded from our analysis. Indeed compared with the parental strain, the H3D/H3H strain did display some minor differences in carbon source preference and nucleosome positioning (e.g., the GAL1 locus) (Figure 2C,E). In addition, when a mutation was introduced into one of the sister histone H3s, only half of the H3 could be modified. Therefore, the global level of modified H3 had a maximum value of 50% of the maximum in a normal cell. Discriminating between the biological consequences caused by forced asymmetrical modification and a forced decrease in total modification is difficult. Nevertheless, we have provided biochemical and functional evidence indicating that this unique genetic system is useful for studying asymmetrical modifications on sister histones.
Using this system, we found that histone H3K4 methylation on one tail is independent of the other tail on the sister H3 histone (Figure 3B), suggesting that Set1C binds and modifies one tail in a cis fashion. Consistently, mutation of K4R in one of the sister H3s did not affect the methylation of K4 on the other tail (Figure 4B). Interestingly, the methylation of K36 or K79 on two sister H3s was also independent (Figures 5B and 6B). The results of our genetic models are consistent with a previous observation that sister histones are not always modified in the same manner simultaneously (Chen et al., 2011).
Asymmetrically modified nucleosomes exist on chromatin (Fisher and Fisher, 2011; Mikkelsen et al., 2007; Voigt et al., 2012), but whether these asymmetrical modifications on sister histones function in manner similar to or different from that of symmetrical modifications remains largely unknown. In our study, we observed that K79me on both sister H3 histones was required for silencing telomere-proximal genes through regulation of the acetylation level of histone H4 (Figure 6D), establishing a cooperative role for both sister histones in vivo. This mode of regulation was also seen for the genes in the I∩set1∆ group when the cells were challenged with glucose starvation (Figure 8C). Different from K79me, H3K36me3 on two sister histone H3s did not appear to have a synergistic effect but rather had an additive effect on suppressing spurious transcription (Figure 5D), indicating that two K36me3 marks on sister histone H3s altered chromatin structure independently. The same additive effect was observed in the genes grouped in II∩set1∆ (Figure 8C), as well as in GAL1 transcription levels (Figure 4E). In addition, K4me marks on sister histone H3s redundantly affected the transcription of the genes grouped in III∩set1∆ (Figure 8C). Consistent with our observations in transcription, sister H3K4me exhibited different regulatory modes in response to various DNA-damage reagents (Figure 7). Thus, our data indicate that modifications on sister histones could employ a cooperative, independent, or redundant mode of regulation of chromatin-associated processes. However, why the genes in different loci are subjected to different regulatory mechanisms remains unclear. One possibility is that different gene loci are targeted by different readers, such as activators and repressors that sense the magnitude of H3K4me differently during transcription. This hypothesis is supported by the data in Figure 4F and G showing that differential marks of K4me3 on two sister histone H3s affected the enrichment of Gal4-activator binding to the GAL1 gene promoter, thereby fine-tuning the transcription of GAL1. The chromatin readers for different genomic loci have not yet been well characterized, so providing a mechanistic explanation for the different performances of sister histone modifications in every case is difficult.
Histones and their modifications are unique to eukaryotes, and they are important in the packaging of DNA into chromatin. From an evolutionary point of view, it may be that the possesion of two identical copies of each histone in the chromatin in eukaryotes rather than one copy is a sporadic outcome of natural selection. Previous high-throughput analysis showed that epigenetic regulation in the form of histone modification plays a far more pronounced role during gene induction/repression than during steady-state expression (Weiner et al., 2012), suggesting the involvement of histone modifications in regulation of gene expression in response to changing environmental cues. In this study, we imposed glucose starvation on yeast cells to mimic an environmental cue. In response, the additive effect of H3K4me on gene transcription was recapitulated in the groups of genes that are enriched in pathways related to glycometabolism, such as carbon metabolism, TCA cycle, and fructose and mannose metabolism (Figure 8D). These observations support the notion that in order to adapt to environmental stress, sister histones execute their fine-tuning regulation by differential modifications.
In conclusion, this study provides new insights into how sister histones regulate the plasticity of chromatin structure, as well as gene transcription, and how epigenetic regulation evolves to address variable environmental cues. Given that combinatorial manipulations of sister histone H3 tails have encountered technical challenges in other model systems, the bivalent nucleosome system that we created in this study will be instrumental in further uncovering the role that combinatorial histone H3 modification crosstalk plays in regulating gene expression. In addition, our system for the genetic manipulation of sister histone H3s could be extended to an asymmetry study of sister histone H4s, which have N-terminal tail acetylations representing important epigenetic marks in various biological processes. Moreover, the genetic system that we created will be useful in examining the role that sister histones play in other biological processes, such as DNA repair and recombination, chromatin replication and heterochromatin assembly. Finally, since the protein sequences of histone H3s are highly conserved during evolution, it will be appealing to apply the same scheme to construct a bivalent nucleosome system in other model systems. However, the challenge might be much greater in higher eukaryotes because the copy numbers of histone genes in these organisms are much higher than those in yeast.
Materials and methods
Strains, antibodies and growth conditions
All yeast strains used in this study were derived from yeast strain YPH500 (Sikorski and Hieter, 1989). The genotypes of the yeast strains are listed in Supplementary file 1. The native promoter of HHT1 (L130H) in the strains derived from H3D/H3H was replaced with the ADE3 promoter. The histone shuffle strain (LHT001) was constructed previously in our lab. Antibodies used in this study are listed in Supplementary file 2.
For galactose induction assays, cells were grown in YPD (10 g/L yeast extract, 20 g/L peptone, 2% dextrose) to mid-log phase (OD600 = 0.4–0.6) before being shifted to medium containing raffinose (10 g/L yeast extract, 20 g/L peptone, 2% raffinose) overnight. Each sample was induced by 2% galactose for 10–30 min. Remaining samples in raffinose medium were taken as having an induction time of 0 min.
For glucose starvation assays, samples were grown in YPD (2% glucose) to mid-log phase and then shifted to medium containing 0.05% glucose for one hour.
Mononucleosome preparation and immunoprecipitation
Yeast cells were cross-linked with 1% formaldehyde for 15 min at room temperature and then resuspended in lysis buffer (50 mM HEPES [pH 7.5], 35 mM NaCl, 0.5% Na-Deoxycholate [wt/vol], 5 mM EDTA, 1% Triton X-100, 1 mM phenylmethylsulfonyl fluoride [PMSF], protease inhibitor cocktail). Cells were lysed using glass beads and sonicated to shear the chromatin to fragment sizes of 200–400 bp. After centrifugation at 10,000 g for 10 min, the supernatant fraction was subjected to further fractionation with a 24 ml Superdex-200 column (GE) in IP buffer (10 mM Tris-HCl [pH 8.0], 100 mM NaCl, 0.5 mM EDTA, 1 mM DTT). Fractions containing mononucleosomes were pooled for subsequent incubation with anti-Myc antibody and protein G sepharose beads (GE) overnight at 4°C. The beads were washed with wash buffer (50 mM HEPES [pH 7.5], 150 mM NaCl, 0.5% Na-Deoxycholate [wt/vol], 5 mM EDTA, 1% Triton X-100) and TE (10 mM Tris-HCl [pH 8.0], 1 mM EDTA). Finally, the immunoprecipitated mononucleosomes were eluted from beads with elution buffer (10 mM Tris-HCl [pH 8.0], 1 mM EDTA, 1% SDS [wt/vol]).
Quantitative reverse transcription-PCR (qRT-PCR)
Total RNA was isolated from yeast cells with an RNeasy mini kit (Qiagen). cDNA was synthesized using the Fastquant RT kit (Tiangen). 1 µl of the RT reaction was used in the subsequent real-time fluorescence quantitative PCR (ABI). Primer pairs used in qRT-PCR were listed in Supplementary file 3.
The expression of GAL1 was normalized to the RNA levels of ACT1, and the fold-changes were calculated by defining the relative mRNA level at 0 min as 1.
MNase digestion assay and Southern blotting
Preparation and digestion of yeast nuclei were performed as described previously (Kent and Mellor, 1995; Wang et al., 2011a). Yeast genomic DNAs were prepared with phenol-chloroform extraction followed by ethanol precipitation. The DNA was then digested by EcoRI and separated on a 1.6% agarose gel. Digestion patterns were analyzed by indirect-end-labeling. The [32P]dCTP incoroporated probe whose sequence was listed in Supplementary file 3 was used for hybridization.
Preparation of yeast chromatin and chromatin immunoprecipitation (ChIP) assay
Yeast chromatin was prepared as described previously (Peng and Zhou, 2012). Specifically, mononucleosomes were purified as described previously for detecting the level of H3N, H3K4me3, H3K36me3 and H3K79me2/3. Chromatin was boiled for 10 min in SDS-PAGE loading buffer and separated in 15% SDS-PAGE, and then subjected to western blotting. The chromatin immunoprecipitation (ChIP) assay was performed as described previously (Wang et al., 2011b).
Quantification of western blotting
We detected the linear range of all the antibodies. Then we loaded our samples in the linear range and performed a western blot. Quantification of the western blot signals was carried out using ImageJ software (RRID:SCR_003070).
Northern blot analysis
Total RNA was extracted using the Yeast RNA extraction kit (Qiagen), resolved on agarose-formaldehyde gels and transferred to Hybond-N+ membrane (GE). RNA was crosslinked to the membrane by UV irradiation. Hybridization was carried out in 7% SDS, 1 mM sodium pyrophosphate, 1 M Na2HPO4, 150 mM NaH2PO4, and 1 mM EDTA. Probes were generated by PCR.
RNA-Seq analysis
The method for constructing RNA-Seq libraries was modified from the TruSeq DNA sample preparation kit protocol (Illumina). Briefly, total RNA was isolated using the RNeasy midi kit (Qiagen). The mRNA was purified from total RNA by Dynaloligo(dT) beads (Invitrogen, CA, USA). The first and second strand cDNAs were synthesized using the SuperScript III CellsDirect cDNA Synthesis Kit (Invitrogen) and the SuperScript Double-Stranded cDNA Synthesis Kit (Invitrogen), respectively. The resulting double-stranded DNA was subjected to DNA repair and end-polishing (blunt-end) using the End-It DNA End-Repair Kit (Epicentre). The DNA was then purified with the QIAquick PCR Purification Kit (Qiagen) and a dA-tail was added using the 3'−5' exo-Klenow Fragment (NEB). The resulting purified fragments were ligated to adaptor oligo mix (Illumina) using Quick T4 DNA ligase (NEB). The 200–500 bp ligation products were recovered from a 2% (w/v) agarose gel using the Qiagen gel extraction kit and were PCR amplified with Illumina primers using the KAPA HiFi HotStart kit. The 250–400 bp amplified products were purified again from a 2% agarose gel and used directly for high-throughput sequencing. The raw paired-end reads contained the adapter sequences: the P7 adapter (read1) is 'AGATCGGAAGAGCACACGTCTGAACTCCAGTCAC', the P5 adapter (read2) is 'AGATCGGAAGAGCGTCGTGTAGGGAAAGAGTGT'. We used the FASTX Toolkit (RRID:SCR_005534) to remove the adapter sequences. We trimmed the reads using TopHat (RRID:SCR_013035), only mapping the reads to the transcriptome of sacCer3 (Apr. 2011) with the default parameter. For the mapped reads, we then extracted the reads that have the ‘NH:i:1’ field. In order to reduce the PCR duplicates' bias, we kept the maximal three records at the same position.
To compare the gene expression profiles between WT (LHT001) and H3D/H3H strains, the aligned reads were analyzed using Cuffdiff2 (RRID:SCR_001647) (Trapnell et al., 2012) to determine the RPKM (Reads Per Kilobase per Million mapped reads) value for each sample. Genes with a change greater than or equal to two folds and p-value ≤ 0.001 were regarded as differentially expressed genes and listed in Figure 2—source data 2. We identified 406 genes that were downregulated in the H3D/H3H sample and 243 genes that were upregulated in the H3D/H3H sample compared with the WT sample. We used FunSpec (RRID:SCR_006952, http://funspec.med.utoronto.ca/) to annotate the differentially expressed genes to get the GO enrichment results (Robinson et al., 2002), which were presented in Figure 2—source data 2.
For RNA-Seq analysis in glucose starvation experiments, we quantified the number of genes for which at least one read was mapped (RPKM≠0). Fold changes in the transcription of genes under glucose starvation, for genes listed in Figure 2—source data 2, were quantified as FCi,j = log2((RPKM_1i,j/RPKM_1act1,j) /(RPKM_0i,j/RPKM_0act1,j)), where RPKM_1i,j and RPKM_0i,j refer to RPKM for gene i in sample j after glucose starvation for 1 and 0 hr, respectively. We excluded the gene i when p<0.05 (t-test) by comparing FCi,j in two independent experiments. For the remaining genes, we calculated the average FCi,j (defined as FCai,j) of gene i in sample j using two replicates. To evaluate whether the gene was potentially regulated by H3K4 methylation, we screened gene i of which is significantly different (p<0.05) from and grouped it to set DH_4 R4R. Genes in set DH_4 R4R were listed in Figure 8—source data 2.
Gene skewness score (GSS) model
The skewness of gene transcript fold-change was defined by using the following model. If asymmetrically modified nucleosomes were involved in gene regulation, or should prerequisitely fall between and . We therefore pooled gene i of set DH_4 R4R into subset MID when Midi,j = 1. The value of Midi,j was calculated using the following equation:
The skewness score (GSS) of gene i in sample j was calculated by the equation:
Greater skewness of sample j to H3D/H3H leads to larger GSSi,j. Conversely, greater skewness of sample j to H3DK4R/H3HK4R leads to smaller GSSi,j. The results of Midi,j and GSSi,j were listed in Figure 8—source data 3.
Gene type classification
The gene i in set MID was classified into three subsets: (1) II, and showing significant difference from both and . The maximum and minimum values of GSS in this subset were defined as GSSmax and GSSmin, respectively; (2) III, and exhibiting no difference from but significant difference from in the condition of each and larger than GSSmax; and (3) I, and significantly differing from rather than in the condition of each and smaller than GSSmin. They were listed in Figure 8—source data 4.
Statistics
Data were analyzed by Pearson's product-moment test and Student t-test as indicated.
Acknowledgements
We thank Drs Brian A Lenzmeier (Buena Vista University) and Hai Jiang for their critical reading of the manuscript. This work was supported by grants from National Natural Science Foundation of China (NSFC 31521061 and 31230040) and Ministry of Science and Technology (MOST 2016YFA0500701 to JQZ). The RNA-Seq data are available from GEO (Gene Expression Omnibus) under accession number GSE104312 (http://www.ncbi.nlm.nih.gov/geo/query/acc.cgi?acc=GSE104312) and GSE88878 (http://www.ncbi.nlm.nih.gov/geo/query/acc.cgi?acc=GSE88878).
Funding Statement
The funders had no role in study design, data collection and interpretation, or the decision to submit the work for publication.
Contributor Information
Jin-Qiu Zhou, Email: jqzhou@sibcb.ac.cn.
Tim Formosa, University of Utah School of Medicine, United States.
Funding Information
This paper was supported by the following grants:
National Natural Science Foundation of China 31521061 to Jin-Qiu Zhou.
National Natural Science Foundation of China 31230040 to Jin-Qiu Zhou.
Ministry of Science and Technology of the People's Republic of China 2016YFA0500701 to Jin-Qiu Zhou.
Additional information
Competing interests
No competing interests declared.
Author contributions
Conceptualization, Resources, Data curation, Software, Formal analysis, Investigation, Methodology, Writing—review and editing.
Conceptualization, Resources, Data curation, Software, Formal analysis, Investigation, Methodology, Writing—original draft.
Resources, Formal analysis, Methodology.
Writing—review and editing, Participated in discussion.
Resources, Methodology.
Resources, Writing—review and editing.
Resources, Writing—review and editing.
Writing—review and editing, Participated in discussion.
Resources, Supervision, Methodology.
Supervision, Funding acquisition, Writing—review and editing.
Additional files
Major datasets
The following datasets were generated:
Zhen Zhou, author; Li Ma, author; Ya-Nan Hu, author. RNA transcription profile of different yeast mutants under glucose starvation (0.05% glucose) and comparison of transcriptome of WT and H3D_H3H. 2017 https://www.ncbi.nlm.nih.gov/geo/query/acc.cgi?acc=GSE104312 Publicly available at the NCBI Gene Expression Omnibus (accession no. GSE104312)
Zhen Zhou, author; Li Ma, author; Yu-Ting Liu, author; Ya-Nan Hu, author. RNA transcription profile of different yeast mutants under glucose starvation (0.05% glucose) 2017 https://www.ncbi.nlm.nih.gov/geo/query/acc.cgi?acc=GSE88878 Publicly available at the NCBI Gene Expression Omnibus (accession no. GSE88878)
References
- Agez M, Chen J, Guerois R, van Heijenoort C, Thuret JY, Mann C, Ochsenbein F. Structure of the histone chaperone ASF1 bound to the histone H3 C-terminal helix and functional insights. Structure. 2007;15:191–199. doi: 10.1016/j.str.2007.01.002. [DOI] [PubMed] [Google Scholar]
- Antczak AJ, Tsubota T, Kaufman PD, Berger JM. Structure of the yeast histone H3-ASF1 interaction: implications for chaperone mechanism, species-specific interactions, and epigenetics. BMC Structural Biology. 2006;6:26. doi: 10.1186/1472-6807-6-26. [DOI] [PMC free article] [PubMed] [Google Scholar]
- Bentley GA, Lewit-Bentley A, Finch JT, Podjarny AD, Roth M. Crystal structure of the nucleosome core particle at 16 A resolution. Journal of Molecular Biology. 1984;176:55–75. doi: 10.1016/0022-2836(84)90382-6. [DOI] [PubMed] [Google Scholar]
- Berger SL. The complex language of chromatin regulation during transcription. Nature. 2007;447:407–412. doi: 10.1038/nature05915. [DOI] [PubMed] [Google Scholar]
- Carrozza MJ, Li B, Florens L, Suganuma T, Swanson SK, Lee KK, Shia WJ, Anderson S, Yates J, Washburn MP, Workman JL. Histone H3 methylation by Set2 directs deacetylation of coding regions by Rpd3S to suppress spurious intragenic transcription. Cell. 2005;123:581–592. doi: 10.1016/j.cell.2005.10.023. [DOI] [PubMed] [Google Scholar]
- Chen X, Xiong J, Xu M, Chen S, Zhu B. Symmetrical modification within a nucleosome is not required globally for histone lysine methylation. EMBO reports. 2011;12:244–251. doi: 10.1038/embor.2011.6. [DOI] [PMC free article] [PubMed] [Google Scholar]
- Dehé PM, Géli V. The multiple faces of Set1. Biochemistry and cell biology = Biochimie et biologie cellulaire. 2006;84:536–548. doi: 10.1139/o06-081. [DOI] [PubMed] [Google Scholar]
- Dollard C, Ricupero-Hovasse SL, Natsoulis G, Boeke JD, Winston F. SPT10 and SPT21 are required for transcription of particular histone genes in Saccharomyces cerevisiae. Molecular and Cellular Biology. 1994;14:5223–5228. doi: 10.1128/MCB.14.8.5223. [DOI] [PMC free article] [PubMed] [Google Scholar]
- Faucher D, Wellinger RJ. Methylated H3K4, a transcription-associated histone modification, is involved in the DNA damage response pathway. PLoS Genetics. 2010;6:e1001082. doi: 10.1371/journal.pgen.1001082. [DOI] [PMC free article] [PubMed] [Google Scholar]
- Fisher CL, Fisher AG. Chromatin states in pluripotent, differentiated, and reprogrammed cells. Current Opinion in Genetics & Development. 2011;21:140–146. doi: 10.1016/j.gde.2011.01.015. [DOI] [PubMed] [Google Scholar]
- Govind CK, Zhang F, Qiu H, Hofmeyer K, Hinnebusch AG. Gcn5 promotes acetylation, eviction, and methylation of nucleosomes in transcribed coding regions. Molecular Cell. 2007;25:31–42. doi: 10.1016/j.molcel.2006.11.020. [DOI] [PubMed] [Google Scholar]
- Huang daW, Sherman BT, Lempicki RA. Bioinformatics enrichment tools: paths toward the comprehensive functional analysis of large gene lists. Nucleic Acids Research. 2009a;37:1–13. doi: 10.1093/nar/gkn923. [DOI] [PMC free article] [PubMed] [Google Scholar]
- Huang daW, Sherman BT, Lempicki RA. Systematic and integrative analysis of large gene lists using DAVID bioinformatics resources. Nature Protocols. 2009b;4:44–57. doi: 10.1038/nprot.2008.211. [DOI] [PubMed] [Google Scholar]
- Jha DK, Strahl BD. An RNA polymerase II-coupled function for histone H3K36 methylation in checkpoint activation and DSB repair. Nature Communications. 2014;5:3965. doi: 10.1038/ncomms4965. [DOI] [PMC free article] [PubMed] [Google Scholar]
- Johnston M. A model fungal gene regulatory mechanism: the GAL genes of Saccharomyces cerevisiae. Microbiological Reviews. 1987;51:458–476. doi: 10.1128/mr.51.4.458-476.1987. [DOI] [PMC free article] [PubMed] [Google Scholar]
- Jones B, Su H, Bhat A, Lei H, Bajko J, Hevi S, Baltus GA, Kadam S, Zhai H, Valdez R, Gonzalo S, Zhang Y, Li E, Chen T. The histone H3K79 methyltransferase Dot1L is essential for mammalian development and heterochromatin structure. PLoS Genetics. 2008;4:e1000190. doi: 10.1371/journal.pgen.1000190. [DOI] [PMC free article] [PubMed] [Google Scholar]
- Joshi AA, Struhl K. Eaf3 chromodomain interaction with methylated H3-K36 links histone deacetylation to Pol II elongation. Molecular Cell. 2005;20:971–978. doi: 10.1016/j.molcel.2005.11.021. [DOI] [PubMed] [Google Scholar]
- Kent NA, Mellor J. Chromatin structure snap-shots: rapid nuclease digestion of chromatin in yeast. Nucleic Acids Research. 1995;23:3786–3787. doi: 10.1093/nar/23.18.3786. [DOI] [PMC free article] [PubMed] [Google Scholar]
- Keogh MC, Kurdistani SK, Morris SA, Ahn SH, Podolny V, Collins SR, Schuldiner M, Chin K, Punna T, Thompson NJ, Boone C, Emili A, Weissman JS, Hughes TR, Strahl BD, Grunstein M, Greenblatt JF, Buratowski S, Krogan NJ. Cotranscriptional set2 methylation of histone H3 lysine 36 recruits a repressive Rpd3 complex. Cell. 2005;123:593–605. doi: 10.1016/j.cell.2005.10.025. [DOI] [PubMed] [Google Scholar]
- Kornberg RD, Thomas JO. Chromatin structure; oligomers of the histones. Science. 1974;184:865–868. doi: 10.1126/science.184.4139.865. [DOI] [PubMed] [Google Scholar]
- Lawrence M, Daujat S, Schneider R. Lateral thinking: how histone modifications regulate gene expression. Trends in Genetics. 2016;32:42–56. doi: 10.1016/j.tig.2015.10.007. [DOI] [PubMed] [Google Scholar]
- Lechner CC, Agashe ND, Fierz B. Traceless synthesis of asymmetrically modified bivalent nucleosomes. Angewandte Chemie International Edition. 2016;55:2903–2906. doi: 10.1002/anie.201510996. [DOI] [PubMed] [Google Scholar]
- Lee DY, Hayes JJ, Pruss D, Wolffe AP. A positive role for histone acetylation in transcription factor access to nucleosomal DNA. Cell. 1993;72:73–84. doi: 10.1016/0092-8674(93)90051-Q. [DOI] [PubMed] [Google Scholar]
- Li B, Gogol M, Carey M, Pattenden SG, Seidel C, Workman JL. Infrequently transcribed long genes depend on the Set2/Rpd3S pathway for accurate transcription. Genes & Development. 2007;21:1422–1430. doi: 10.1101/gad.1539307. [DOI] [PMC free article] [PubMed] [Google Scholar]
- Lohr D, Hopper JE. The relationship of regulatory proteins and DNase I hypersensitive sites in the yeast GAL1-10 genes. Nucleic Acids Research. 1985;13:8409–8423. doi: 10.1093/nar/13.23.8409. [DOI] [PMC free article] [PubMed] [Google Scholar]
- Lohr D, Lopez J. GAL4/GAL80-dependent nucleosome disruption/deposition on the upstream regions of the yeast GAL1-10 and GAL80 genes. The Journal of Biological Chemistry. 1995;270:27671–27678. doi: 10.1074/jbc.270.46.27671. [DOI] [PubMed] [Google Scholar]
- Lohr D, Torchia T, Hopper J. The regulatory protein GAL80 is a determinant of the chromatin structure of the yeast GAL1-10 control region. The Journal of Biological Chemistry. 1987;262:15589–15597. [PubMed] [Google Scholar]
- Lohr D. Organization of the GAL1-GAL10 intergenic control region chromatin. Nucleic Acids Research. 1984;12:8457–8474. doi: 10.1093/nar/12.22.8457. [DOI] [PMC free article] [PubMed] [Google Scholar]
- Luger K, Mäder AW, Richmond RK, Sargent DF, Richmond TJ. Crystal structure of the nucleosome core particle at 2.8 A resolution. Nature. 1997;389:251–260. doi: 10.1038/38444. [DOI] [PubMed] [Google Scholar]
- Mann RK, Grunstein M. Histone H3 N-terminal mutations allow hyperactivation of the yeast GAL1 gene in vivo. The EMBO Journal. 1992;11:3297–3306. doi: 10.1002/j.1460-2075.1992.tb05408.x. [DOI] [PMC free article] [PubMed] [Google Scholar]
- Mikkelsen TS, Ku M, Jaffe DB, Issac B, Lieberman E, Giannoukos G, Alvarez P, Brockman W, Kim TK, Koche RP, Lee W, Mendenhall E, O'Donovan A, Presser A, Russ C, Xie X, Meissner A, Wernig M, Jaenisch R, Nusbaum C, Lander ES, Bernstein BE. Genome-wide maps of chromatin state in pluripotent and lineage-committed cells. Nature. 2007;448:553–560. doi: 10.1038/nature06008. [DOI] [PMC free article] [PubMed] [Google Scholar]
- Ng HH, Feng Q, Wang H, Erdjument-Bromage H, Tempst P, Zhang Y, Struhl K. Lysine methylation within the globular domain of histone H3 by Dot1 is important for telomeric silencing and Sir protein association. Genes & Development. 2002;16:1518–1527. doi: 10.1101/gad.1001502. [DOI] [PMC free article] [PubMed] [Google Scholar]
- Oudet P, Gross-Bellard M, Chambon P. Electron microscopic and biochemical evidence that chromatin structure is a repeating unit. Cell. 1975;4:281–300. doi: 10.1016/0092-8674(75)90149-X. [DOI] [PubMed] [Google Scholar]
- Pai CC, Deegan RS, Subramanian L, Gal C, Sarkar S, Blaikley EJ, Walker C, Hulme L, Bernhard E, Codlin S, Bähler J, Allshire R, Whitehall S, Humphrey TC. A histone H3K36 chromatin switch coordinates DNA double-strand break repair pathway choice. Nature Communications. 2014;5:4091. doi: 10.1038/ncomms5091. [DOI] [PMC free article] [PubMed] [Google Scholar]
- Papamichos-Chronakis M, Peterson CL. Chromatin and the genome integrity network. Nature Reviews Genetics. 2013;14:62–75. doi: 10.1038/nrg3345. [DOI] [PMC free article] [PubMed] [Google Scholar]
- Peng J, Zhou JQ. The tail-module of yeast Mediator complex is required for telomere heterochromatin maintenance. Nucleic Acids Research. 2012;40:581–593. doi: 10.1093/nar/gkr757. [DOI] [PMC free article] [PubMed] [Google Scholar]
- Pinskaya M, Gourvennec S, Morillon A. H3 lysine 4 di- and tri-methylation deposited by cryptic transcription attenuates promoter activation. The EMBO Journal. 2009;28:1697–1707. doi: 10.1038/emboj.2009.108. [DOI] [PMC free article] [PubMed] [Google Scholar]
- Ramachandran S, Vogel L, Strahl BD, Dokholyan NV. Thermodynamic stability of histone H3 is a necessary but not sufficient driving force for its evolutionary conservation. PLoS Computational Biology. 2011;7:e1001042. doi: 10.1371/journal.pcbi.1001042. [DOI] [PMC free article] [PubMed] [Google Scholar]
- Robinson MD, Grigull J, Mohammad N, Hughes TR. FunSpec: a web-based cluster interpreter for yeast. BMC Bioinformatics. 2002;3:35. doi: 10.1186/1471-2105-3-35. [DOI] [PMC free article] [PubMed] [Google Scholar]
- Roguev A, Schaft D, Shevchenko A, Pijnappel WW, Wilm M, Aasland R, Stewart AF. The Saccharomyces cerevisiae Set1 complex includes an Ash2 homologue and methylates histone 3 lysine 4. The EMBO Journal. 2001;20:7137–7148. doi: 10.1093/emboj/20.24.7137. [DOI] [PMC free article] [PubMed] [Google Scholar]
- Shilatifard A. Chromatin modifications by methylation and ubiquitination: implications in the regulation of gene expression. Annual Review of Biochemistry. 2006;75:243–269. doi: 10.1146/annurev.biochem.75.103004.142422. [DOI] [PubMed] [Google Scholar]
- Sikorski RS, Hieter P. A system of shuttle vectors and yeast host strains designed for efficient manipulation of DNA in Saccharomyces cerevisiae. Genetics. 1989;122:19–27. doi: 10.1093/genetics/122.1.19. [DOI] [PMC free article] [PubMed] [Google Scholar]
- Takahashi YH, Schulze JM, Jackson J, Hentrich T, Seidel C, Jaspersen SL, Kobor MS, Shilatifard A. Dot1 and histone H3K79 methylation in natural telomeric and HM silencing. Molecular Cell. 2011;42:118–126. doi: 10.1016/j.molcel.2011.03.006. [DOI] [PMC free article] [PubMed] [Google Scholar]
- Trapnell C, Roberts A, Goff L, Pertea G, Kim D, Kelley DR, Pimentel H, Salzberg SL, Rinn JL, Pachter L. Differential gene and transcript expression analysis of RNA-seq experiments with TopHat and Cufflinks. Nature Protocols. 2012;7:562–578. doi: 10.1038/nprot.2012.016. [DOI] [PMC free article] [PubMed] [Google Scholar]
- Tzagoloff A, Akai A, Needleman RB. Assembly of the mitochondrial membrane system: isolation of nuclear and cytoplasmic mutants of Saccharomyces cerevisiae with specific defects in mitochondrial functions. Journal of Bacteriology. 1975;122:826–831. doi: 10.1128/jb.122.3.826-831.1975. [DOI] [PMC free article] [PubMed] [Google Scholar]
- van Rossum B, Fischle W, Selenko P. Asymmetrically modified nucleosomes expand the histone code. Nature Structural & Molecular Biology. 2012;19:1064–1066. doi: 10.1038/nsmb.2433. [DOI] [PubMed] [Google Scholar]
- Vermeulen M, Timmers HT. Grasping trimethylation of histone H3 at lysine 4. Epigenomics. 2010;2:395–406. doi: 10.2217/epi.10.11. [DOI] [PubMed] [Google Scholar]
- Voigt P, LeRoy G, Drury WJ, Zee BM, Son J, Beck DB, Young NL, Garcia BA, Reinberg D. Asymmetrically modified nucleosomes. Cell. 2012;151:181–193. doi: 10.1016/j.cell.2012.09.002. [DOI] [PMC free article] [PubMed] [Google Scholar]
- Voigt P, Tee WW, Reinberg D. A double take on bivalent promoters. Genes & Development. 2013;27:1318–1338. doi: 10.1101/gad.219626.113. [DOI] [PMC free article] [PubMed] [Google Scholar]
- Wagner EJ, Carpenter PB. Understanding the language of Lys36 methylation at histone H3. Nature Reviews Molecular Cell Biology. 2012;13:115–126. doi: 10.1038/nrm3274. [DOI] [PMC free article] [PubMed] [Google Scholar]
- Wang S-S, Zhou BO, Zhou J-Q. Histone H3 lysine 4 hypermethylation prevents aberrant nucleosome remodeling at the PHO5 Promoter. Molecular and Cellular Biology. 2011a;31:3171–3181. doi: 10.1128/MCB.05017-11. [DOI] [PMC free article] [PubMed] [Google Scholar]
- Wang SS, Zhou BO, Zhou JQ. Histone H3 lysine 4 hypermethylation prevents aberrant nucleosome remodeling at the PHO5 promoter. Molecular and Cellular Biology. 2011b;31:3171–3181. doi: 10.1128/MCB.05017-11. [DOI] [PMC free article] [PubMed] [Google Scholar]
- Wasylyk B, Chambon P. Transcription by eukaryotic RNA polymerases A and B of chromatin assembled in vitro. European Journal of Biochemistry. 1979;98:317–327. doi: 10.1111/j.1432-1033.1979.tb13191.x. [DOI] [PubMed] [Google Scholar]
- Weiner A, Chen HV, Liu CL, Rahat A, Klien A, Soares L, Gudipati M, Pfeffner J, Regev A, Buratowski S, Pleiss JA, Friedman N, Rando OJ. Systematic dissection of roles for chromatin regulators in a yeast stress response. PLoS Biology. 2012;10:e1001369. doi: 10.1371/journal.pbio.1001369. [DOI] [PMC free article] [PubMed] [Google Scholar]
- White CL, Suto RK, Luger K. Structure of the yeast nucleosome core particle reveals fundamental changes in internucleosome interactions. The EMBO Journal. 2001;20:5207–5218. doi: 10.1093/emboj/20.18.5207. [DOI] [PMC free article] [PubMed] [Google Scholar]


