Abstract
Due to their highly permeable skin and ectothermy, terrestrial amphibians are challenged by compromises between water balance and body temperature regulation. The way in which such compromises are accommodated, under a range of temperatures and dehydration levels, impacts importantly the behavior and ecology of amphibians. Thus, using the terrestrial toad Rhinella schneideri as a model organism, the goals of this study were twofold. First, we determined how the thermal sensitivity of a centrally relevant trait—locomotion—was affected by dehydration. Secondly, we examined the effects of the same levels of dehydration on thermal preference and thermal tolerance. As dehydration becomes more severe, the optimal temperature for locomotor performance was lowered and performance breadth narrower. Similarly, dehydration was accompanied by a decrease in the thermal tolerance range. Such a decrease was caused by both an increase in the critical minimal temperature and a decrease in the thermal maximal temperature, with the latter changing more markedly. In general, our results show that the negative effects of dehydration on behavioral performance and thermal tolerance are, at least partially, counteracted by concurrent adjustments in thermal preference. We discuss some of the potential implications of this observation for the conservation of anuran amphibians.
Keywords: Bufonidae, critical temperatures, optimal temperatures, preferred body temperatures, tolerance range
1. INTRODUCTION
In common with other ectotherms, amphibians often engage in activities in temperatures that may not allow optimal performance. This may reflect either limitations in thermal niche availability and/or because thermoregulatory behavior may conflict with the activity being performed or with other concurrent activities (Huey & Slatkin 1976; Huey & Kingsolver 1989). Likewise, due to their vulnerability to evaporative water loss and environmental contingencies in water availability, many amphibians are active under variable hydration states (see Tracy et al. 2014). Both of these factors, hydration state and temperature, are known to profoundly affect the physiological performance and tolerance of amphibians (Jørgensen 1997; Navas, Gomes & Carvalho 2008). Indeed, as wet‐skinned ectotherms, amphibians, especially those with terrestrial habits, are particularly sensitive to alterations in body temperature (Carey 1978) and hydration states (Wygoda 1984; Tracy et al. 2014). Moreover, the interaction between these factors influences the mechanisms involved with the regulation of each of them. For example, thermal sensitive of behavioral performance can be affected by dehydration state (Preest & Pough 2003; Titon and Gomes, 2010), while dehydration state can cause changes in preferred temperature and thermal tolerance (Claussen 1977; Mitchell & Bergmann 2016). Therefore, terrestrial amphibians are particularly predisposed to experience important compromises between water balance and thermoregulation (Tracy 1976; Preest & Pough 1989; Titon and Gomes, 2010).
The influence of temperature and hydration state on behavioral performance can be investigated by determining thermal performance curves (TPCs) at different levels of body hydration (Huey & Stevenson 1979; Beuchat, Pough & Stewart 1984; Huey & Kingsolver 1989; Preest & Pough 1989; Angilletta, Huey & Frazier 2010). From these curves, one can extract a number of informative parameters that includes the following: the optimal temperature (T o) in which maximal performance is obtained; optimal thermal breadth, which informs the interval in which performance is kept above a given level (e.g., 80%, B80); and critical thermal limits (CT), which sets the limits within which the animal is able to perform. Thus, changes in T o may indicate whether the optimal temperature for performance on a given trait is affected by dehydration level. Changes in thermal performance breadth inform how dehydration may affect the capacity of the animals to buffer their performance against variations in temperature, while changes in CT may reveal conflicting demands associated with thermal tolerance and water balance (Claussen 1977; Feder & Hofmann 1999; Plummer et al. 2003).
Besides its influence on behavioral performance and its thermal sensitivity, dehydration is also known to affect thermoregulatory behavior in amphibians. For example, toads exhibited a decrease in their preferred body temperature (T pref) associated with dehydration (Williams & Wygoda 1993) or even with the exposition to dry air (Malvin & Wood 1991). This dehydration‐driven hypothermic response is thought to be of functional and ecological relevance because the potential for evaporative water loss is diminished at low body temperatures (Bundy & Tracy 1977; Tracy et al. 1993; Mitchell & Bergmann 2016). On the other hand, changes in T pref may compromise behavioral performance if discordant with changes in T o. Therefore, it becomes highly relevant to examine the concurrent changes in T o and T pref in response to hydration level. This approach may allow for the evaluation on how thermoregulatory behavior may be adjusted to accommodate for the expected detrimental effects of dehydration on behavioral performance (see Angilletta et al. 2003; Navas et al. 2008; Artacho et al. 2015).
The functional integration involving behavioral performance and its sensitivity to temperature, body temperature regulation, and hydration level constitutes a central aspect of ectotherms life history (Tracy 1976; Angilletta 2009). However, for many groups, such as terrestrial Neotropical anuran amphibians, such questions have rarely been examined (Navas et al. 2008). Accordingly, in the present study, we investigated the consequences of different hydration levels on the preferred body temperature and on the locomotor performance and its dependency to temperature in the terrestrial toad Rhinella schneideri (Figure 1). To this aim, we obtained thermal performance curves and determined the preferred body temperature on a thermal gradient for toads under different hydration levels. Based on the considerations made above, we predict that, as dehydration progresses, T o, T pref, thermal tolerance, and thermal performance breadth will decrease concurrently with a decrease in the absolute level of performance. Rhinella schneideri is a large‐bodied terrestrial toad widely distributed in South America from north and central Argentina, central Bolivia, Paraguay, Uruguay, and throughout Brazil. Along its distribution, R. schneideri occupies open and seasonally dry habitats, such as the Chaco and the Cerrado domains (Pramuk et al. 2008), being often found active away from water sources (Norman 1994; Santos et al. 2009). While many other sympatric anuran species estivate during cold and dry seasons, R. schneideri can remain active year around, even though with some seasonal decrease in activity (Noronha‐de‐Souza et al. 2015) and changes in thermoregulatory behavior (Bícego‐Nahas, Gargaglioni, & Branco 2001).
Figure 1.
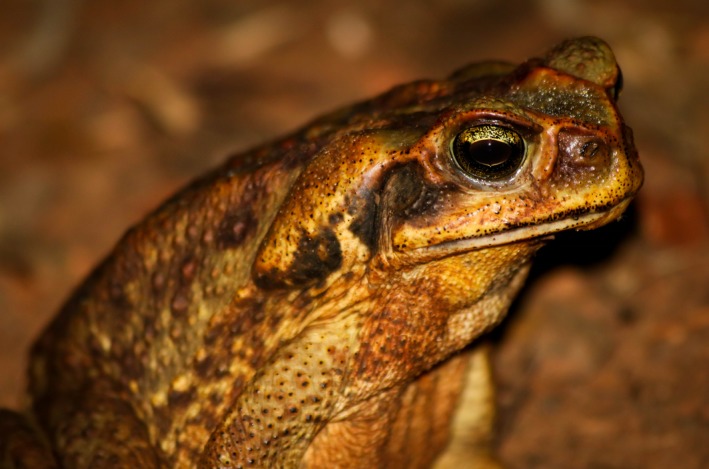
The toad Rhinella schneideri, a large‐bodied terrestrial anuran widely distributed in South America. Photograph by Lucas S. Almeida
2. MATERIAL AND METHODS
2.1. Animals
We collected adult toads of both sexes in the municipality of Barbosa, state of São Paulo, Brazil (21.25048°S, 49.92132°W; datum: WGS84; elev. 371 m), on September 18 and 19, 2015. Although this period is within the reproductive season registered for R. schneideri (Norman 1994), no toad was calling or engaged in any other breeding behavior at the time of capture; instead, they were all found apparently foraging for food. After capture, animals were transported to the Laboratory of Comparative Animal Physiology, Universidade Estadual Paulista (UNESP), in the municipality of Rio Claro, state of São Paulo, Brazil, approximately 350 km from the collection site. In the laboratory, toads were maintained individually in plastic cages (20 × 30 × 70 cm) provided with shelter and a bowl full of water in a room with controlled temperature (23 ± 2°C) and natural photoperiod. We monitored toads daily and fed them crickets every other day, except 3 days prior to the experiments. The first trial began within 3–7 days after toads arrived at the laboratory, and 60 days was the total time until the end of all experiments. During this period in captivity, toad's body masses varied less than 3% from that measured at the time of capture.
2.2. Dehydration protocol
We randomly divided the toads into four experimental groups of ten individuals, each of these groups were submitted to a different level of hydration, varying from fully hydrated (100%) to animals dehydrated until they have lost 10% (90% hydrated), 20% (80% hydrated), or 30% (70% hydrated) of their initial fully hydrated body masses. The body masses at fully hydration were determined by placing individual toads in plastic containers (~20 cm of diameter) filled with 2 cm of distilled water, which allowed for the direct contact between the water and the toad's pelvic region. After 60 min under this condition, we emptied the urinary bladder by gently pressing the pelvic region and weighted the animals (± 0.01 g). The weights found under this protocol were accepted as the body mass at fully hydration. Following the determination of the fully hydrated body masses, except for 100%, we proceed to the dehydration protocol until the desired level of dehydration was attained. To promote dehydration, toads were placed individually in a wind tunnel (airflow of 2.5 ± 0.5 m/s), at 25°C and relative humidity of 50 ± 5%. Under these conditions, toads lost water by average of 10 g/hr and were weighted every 15 min until they had attained the desired hydration level. All experiments started immediately thereafter.
Except for the control group, each individual toad was submitted to the dehydration procedure for eight times along the duration of the study. Each individual was always dehydrated to the same level, which was dictated by its allocation within a given experimental group. After the first dehydration, animals were submitted to the protocol for T pref determination; from the second to the sixth dehydration bouts, toads were submitted to the locomotor performance trials, five in total, and after the seventh and the eight dehydration bouts, they were subjected to the measurement of the minimal and maximal critical temperatures, respectively (see details for each protocol below). Between each dehydration procedure, animals returned to their maintenance cages where they had free access to water, were fed, and were allowed to recover for a minimum period of 3 days.
2.3. Preferred temperature
Preferred body temperature was determined in a circular arena (90 cm diameter and 100 cm height) with walls built with galvanized steel plates and floor mounted on a copper plate. In this arena, we produced a thermal gradient that ranged from 13 to 40°C. This was achieved by the use of heat tapes (reptile heat tape 6″, THG Heat Tapes) secured on the external side of the copper plate on one side of the arena and by the placement of packs of artificial ice (GeloTech, model 700), also on the external side of the copper plate, on the opposite side of the arena. The arena floor was covered with a black nonwoven fabric (TNT, Temasi), which was discarded and replaced after each individual measurement. The gradient temperature distribution and its evenness were checked every 30 min using an infrared thermal camera (Flir SC‐640; Flir Systems Inc.).
Before the beginning of T pref measurements, toads were kept inside a climatic chamber (122FC Eletrolab) at 20°C for 2 hr to ensure that all individuals had the same body temperatures at the onset of the experiments. Next, we weighted the animals (Marte AS5500C, ± 0.01 g) and measured their cloacal (Hand Held Digital Thermometer, ETI Thermometers) and dorsal (infrared thermometer ETI—EcoTemp model) temperatures. After that, toads were individually released into the middle area of the thermal gradient where they were left undisturbed for 30 min. Following this accustomization period, we measured the superficial dorsal temperature (infrared thermometer ETI—EcoTemp model) of the toads every 15 min for ten times. Finished this period, we immediately measured the cloacal temperature and again weighed the animals (same instruments as above). All trials were conducted between 18:00 and 00:00, when toads were active, in a room with dim light and air temperature controlled at 25 ± 2°C. No toad lost more than 1% of their initial body mass during any of the trials.
2.4. Locomotor performance
For the determination of the thermal performance curves, we focused on locomotor performance because foraging, reproduction, escape from predators, and many other ecologically relevant activities are inextricably associated with locomotion in anuran amphibians (Prates et al. 2013 and references therein). Moreover, previous studies found that locomotion may be greatly influenced by temperature (Rome, Stevens, & John‐Alder 1992) and dehydration (Preest & Pough 1989) in amphibians. Therefore, herein, we proceed to test the locomotor performance of our toads in five different temperatures (15, 20, 25, 30, and 35°C), in random order and performed on different days, usually more than 3 days apart to each other.
Locomotor performance was measured in a circular track made of polyethylene (15 cm width, 80 cm height, and 150 cm diameter) located inside a climatized room (Fitotron 011—Eletrolab) set to the desired temperature level. Previous to each trial, toads were kept for a period of 2 hr in a cage inside a smaller climatic chamber (122FC Eletrolab) set to the same temperature they were going to be tested. After this period, toads were weighed and had their cloacal temperature measured. Next, they were placed individually into the test track and the performance trial immediately begun. During the trial, toads were continuously stimulated to move by touches of a wood rod on the urostile during a 10 min' period. The distance covered during this period was defined as the absolute locomotor performance of the animal being tested. By the end of the trial, the cloacal temperature and body mass were once again recorded. No toad showed a change in body temperature more than 1.5°C apart from the designated experimental temperature and did not lose more than 1% of their initial body mass during any of the trials.
2.5. Critical temperatures
To determine maximum and minimal critical temperatures, toads were placed individually in plastic containers kept inside a climatic chamber (122FC Eletrolab) at 23°C. From this initial temperature, we either cooled or heated the chamber at a rate of 1°C/10 min. CT endpoints were established as the temperature in which toads lost their ability to right themselves, within 15 s, when manually turned upside down. During the experiment, this righting response was initially verified every 10 min, but below 15°C and above 35°C, it was checked every minute. Immediately after the loss of the righting reflex, we measured the body temperature of the toads by recording their cloacal temperature (Hand Held Digital Thermometer, ETI Thermometers).
After the experiments, we immersed the toads inside bowls filled with water at ambient temperature for recovering. If the toad died following the experiments, we discarded its data from the analyses. This happened only in three instances for the measurements of CTmax, twice at the 70% hydration level, and once at 80%.
2.6. Data analyses
For each individual toad, we defined T pref as the median skin body temperatures recorded at the thermal gradient. We also used the 25th and 75th quartiles of these same temperature recordings to establish the lower and upper limits of the preferred temperature range, respectively (Hertz, Huey & Stevenson 1993).
Locomotor performance was initially relativized as a percentage of the maximum absolute performance attained by each individual toad at any of the temperatures tested. After, the relativized levels of locomotor performance were combined with lower and upper performance bounds (i.e., performance = 0) taken from the critical temperature determinations, and plotted against temperature. Over these data, thermal performance curves were adjusted using the software TableCurve 2D (Systat Software) (see Angilletta 2006). In all cases, we applied LogNormal function, which provided the best adjustment (R 2 > .95) for describing the TPCs. We established the thermal optimum (T o) as the maximum (peak) of the curve (i.e., relative performance = 100%) and the thermal performance breadth as the temperature interval within which the toads reached 80% (lower B80 and upper B80) of their maximum performance (see Huey & Stevenson 1979; Tracy et al. 1993; Angilletta, Niewiarowski & Navas 2002). Also, we calculated the B80 range as the difference between upper B80 and lower B80.
Differences among hydration levels for all the parameters examined were tested with an analysis of variance (ANOVA). Previously, we checked for the potential influence of body masses variation on each and every multi‐group comparison using an analyses of covariance (ANCOVA). However, since no effect of body mass was found in any case, we proceeded with the ANOVA test. Whenever, statistical differences were revealed by the ANOVA test, they were isolated by the Student ‐ Newman ‐ Keuls (SNK) test. In cases in which our data failed to attend the premises of normality and homoscedasticity of variance, we employed the Kruskal‐Wallis test, followed by Dunn´s test, whenever necessary.
We used a Linear Mixed‐effects Model (lme4 package) to examine the effects of temperature and dehydration on the absolute locomotor performance of R. schneideri. We set the dehydration levels and temperature as factors and the absolute locomotor performance as the response variable. As the same individuals were tested repeteadly in different temperatures, we set the individuals as random factors. Finally, we performed multiple comparisons of means (Tukey contrasts) post hoc test for both temperature and dehydration level (package multcomp).
All the analyses were realized using R version 3.2.3 (R Development Core Team, 2015), and differences were accepted as significant at the level of p < 0.05.
3. RESULTS
3.1. Body mass
Toads keep their body condition along the data collection period and their body mass before dehydration did not differ among experimental groups (Kruskal–Wallis one‐way H = 2.530; df = 3; p = .47; Table 1) and neither among different trials (Kruskal–Wallis one‐way H = 1.521; df = 3; p = .678). Changes in body mass due to the dehydration protocol only reflected the fact that the different experimental groups were subjected to different levels of loss in body water content and were not considered as a factor in any of our latter analyses.
Table 1.
Standard body mass of Rhinella schneideri for the different experimental groups. The body mass values presented correspond to the mass of the toads before being dehydrated to their designated dehydration level
| Dehydration level (%) | N | Mean (g) | SD (g) | Range (g) |
|---|---|---|---|---|
| 100 | 10 | 178.39 | 99.34 | 84.11–364.4 |
| 90 | 10 | 131.61 | 64.36 | 82.42–239.72 |
| 80 | 10 | 148.46 | 92.73 | 80.69–339.95 |
| 70 | 10 | 142.43 | 63.28 | 78.82–268.21 |
3.2. Preferred body temperature
T pref differed among the different hydration levels (F 1,36 = 69.803; p < .001), with fully hydrated toads exhibiting T pref values higher than all other hydration levels. On the opposite, the most dehydrated toads of the 70% group had the lowest T pref among all experimental groups of fully hydrated toads (p < .001 in all comparisons; Figure 2), while no significant difference was detected between 90% and 80% (p = .199; Table 2; Figure 2).
Figure 2.
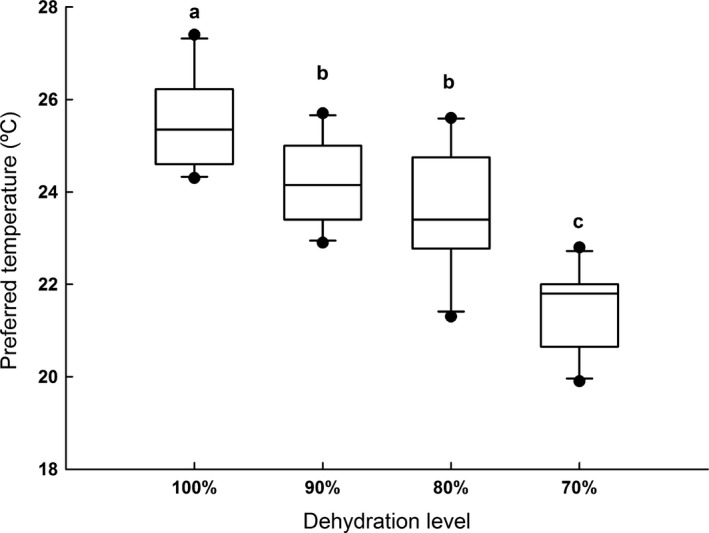
Influence of dehydration level on the preferred body temperatures (T pref), of Rhinella schneideri. The line inside the box plot, the borders, and the whiskers represent, respectively, the median, the second and third interquartile range, and the range of the data; dots are outliers. Different letters above boxplots indicate significant differences
Table 2.
Preferred temperature (T pref), thermal limits (CTmax and CTmin), optimal temperature (T o), thermal performance breadth (lower and upper B80), B80 range, and thermal tolerance range (TR) of Rhinella schneideri at different levels of dehydration. The values are show as mean ± standard deviation
| Dehydration level | ||||
|---|---|---|---|---|
| 100% | 90% | 80% | 70% | |
| T pref (°C) | 25.49 ± 0.98 | 24.24 ± 0.9 | 23.63 ± 1.33 | 21.46 ± 0.88 |
| CTmin (°C) | 6.37 ± 1.04 | 6.36 ± 0.87 | 9.38 ± 1.14 | 9.77 ± 1.57 |
| CTmax (°C) | 40.36 ± 0.84 | 39.82 ± 0.34 | 38.34 ± 0.7 | 38.5 ± 0.46 |
| T O (°C) | 30.1 ± 1.76 | 28.29 ± 1.85 | 23.34 ± 1.04 | 23.3 ± 0.81 |
| B80 (°C) | 22.1–35.78 | 20.45–34.47 | 17.23–30.32 | 17.44–30.4 |
| B80 range (°C) | 16.76 ± 2.67 | 14.35 ± 3.58 | 10.38 ± 3.98 | 11.42 ± 2.11 |
| TR (°C) | 33.98 ± 1.62 | 33.33 ± 0.84 | 29.03 ± 0.88 | 28.72 ± 1.72 |
3.3. Absolute locomotor performance
Temperature (F = 304.60; df = 4; p < .001), dehydration (F = 99.45; df = 3; p < .001), and the interaction of these variables (F = 22.34; df = 12; p < .001) strongly affect the absolute locomotor performance of R. schneideri (Table S1). In general, the locomotor performance improved with temperature elevation (Figure 3; Table S2). The maximum distances covered by toads lowered with the decrease in hydration level (Figure 3; Tables S2 and S4) and this effect was more pronounced at warmer temperatures (Figure 3; Table S1 and S3).
Figure 3.
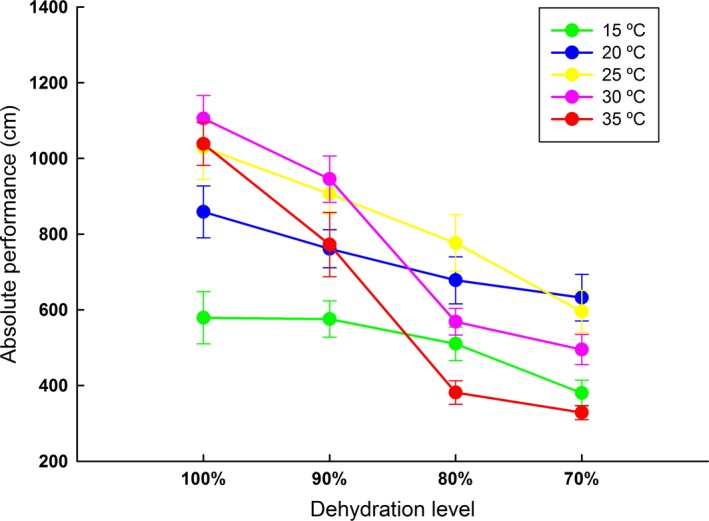
Absolute locomotor performance of Rhinella schneideri, at different levels of dehydration, at five different temperatures. Each symbol represents the mean and the associated whiskers the confidence interval (95%)
3.4. Optimal temperatures and thermal performance breadth
The optimal temperature for locomotor performance was significantly affected by dehydration (H = 29.983; d.f = 3; p < .001) with toads 100% and 90% hydrated exhibiting higher T os in comparison with those at 80% and 70% (Table 2; Figures 4 and 5). Lower B80 was greater (i.e., warmer) in better hydrated toads (100% and 90%) than in those more dehydrated (80% and 70%) (Table 2; Figure 6; H = 22.804; df = 3; p < .001). Upper B80 were greater (i.e., warmer) at higher hydration levels, except between 80% and 70% (F 3,39 = 63.29; p < .001; Figure 6). As a consequence, B80 range was broader for toads 100% and 90% hydrated in comparison with those at the 80% and 70% hydration levels (Table 2; Figure 4; H = 17.77; df = 3; p < .001).
Figure 4.
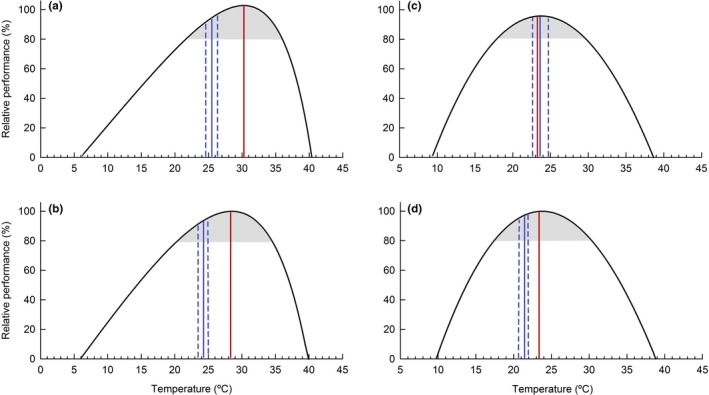
Thermal performance curves of Rhinella schneideri at four different levels of dehydration (a = 100%; b = 90%; c = 80%; d = 70%). The red vertical line represents the optimal temperature, the gray area represents the thermal performance breadth (80% of maximal performance), the blue solid vertical line represents the mean T pref, and the blue dotted lines represent the T pref interquartile range (25th and 75th)
Figure 5.
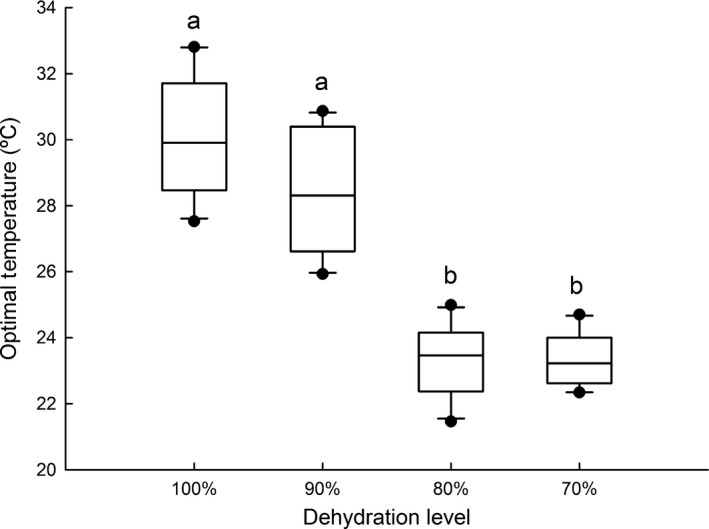
Optimal temperature for locomotor performance (T o) of Rhinella schneideri at different levels of dehydration. The line inside the box plot, the borders, and the whiskers represent, respectively, the median, the second and third interquartile range, and the range of the data; points are outliers. Different letters above boxplots indicate significant differences
Figure 6.
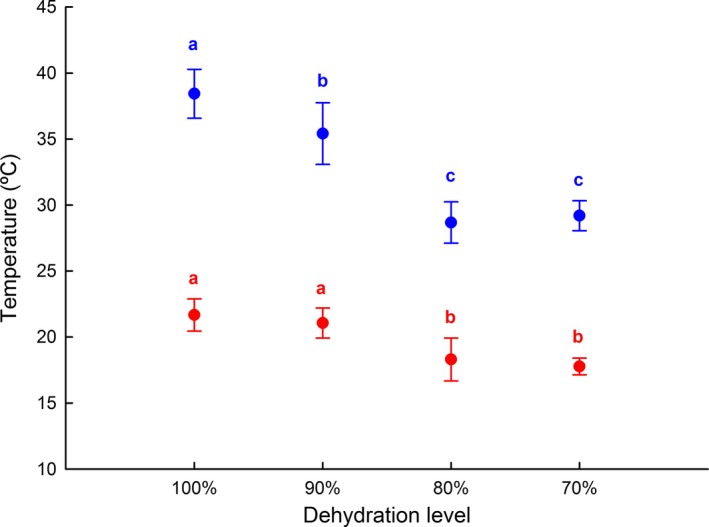
Upper B80 (blue) and lower B80 (red) values for Rhinella schneideri at four different dehydration levels. The dots represent the mean and the whiskers the confidence interval (95%). Different letters above boxplots indicate significant differences
3.5. Critical temperatures
The CTmin (F 3,36 = 38.17; p < .001) and CTmax (F 3,36 = 36.14; p < .001) were both affected by dehydration (Figure 7; Table 2). More specifically, CTmin and CTmax for the groups 90% and fully hydrated were higher and lower, respectively, compared to the less hydrated groups of 80% and 70%. Related to the changes in CT limits, tolerance range was found to be broader for 90% and fully hydrated groups in comparison with the 80% and 70% ones (Figure 8; F 3,33 = 36.979; p < .001).
Figure 7.
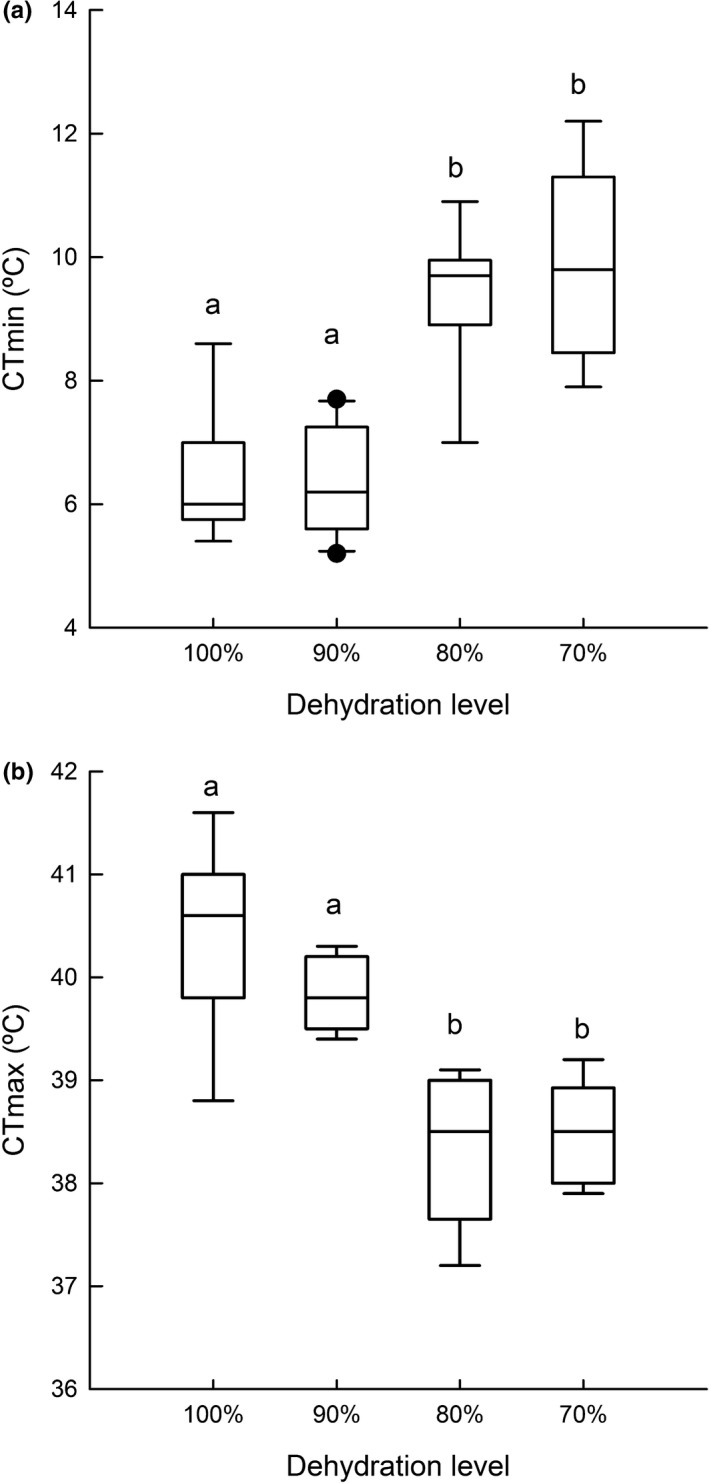
Critical thermal minimum (a) and maximum (b) of Rhinella schneideri at different levels of dehydration. The line inside the box plot, the borders, and the whiskers represent, respectively, the median, the second and third interquartile range, and the range of the data; dots are outliers. Different letters above boxplots indicate significant differences
Figure 8.
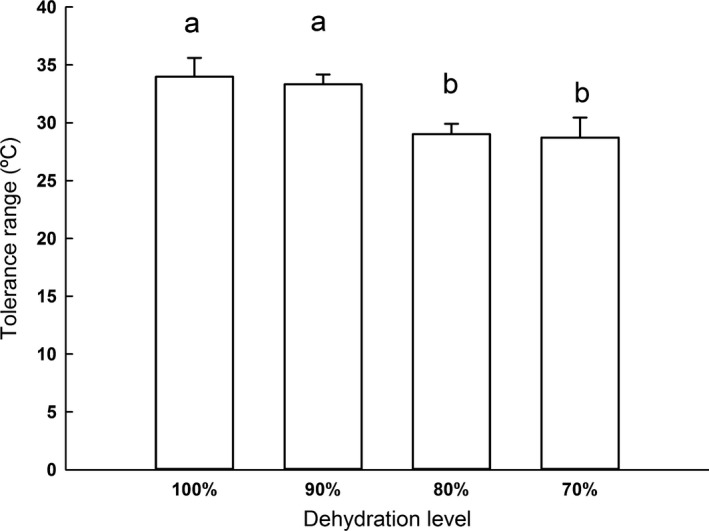
Mean tolerance range of Rhinella schneideri at different levels of dehydration. The whiskers and letters above the bars represent the standard deviation and significant differences, respectively
4. DISCUSSION
Temperature and dehydration affected the locomotor performance of R. schneideri, as previously reported for other terrestrial anurans (Moore & Gatten 1989; Preest & Pough 1989), including congeneric species (Titon et al., 2010; Prates et al. 2013; Titon and Gomes, 2010). Our results clearly showed that the better hydrated the animal, the better was their absolute locomotor performance in all temperatures tested. This deleterious influence of dehydration on the toad's performance, however, was temperature dependent. In general, the drop in performance associated with dehydration was more pronounced at higher temperatures (see Figure 1). Thus, if on the one hand higher temperatures promote a better performance, which possibly will translate in positive effects on fitness (Huey & Kingsolver 1989; Angilletta et al. 2010), on the other hand, higher temperatures associated with low relativity humidity increase the potential for water evaporation, which may culminate in dehydration that, as we found, had the most severe consequences at higher temperatures. Such potential trade‐off may be of limited importance if water availability is plenty and animals can be active at optimal temperatures without compromising their osmotic balance. In cases in which water availability is limited and dehydration is unavoidable, toads may remedy the situation by changing thermal preference to cooler levels and/or become less active (see Discussion below). However, if elevated temperature occurs in combination with limited water availability, our results indicate that this condition may translate into severe consequences to organismal performance. Within the Rhinella genus, such consequences seem to vary with interspecific differences in the thermal sensitivity of performance to dehydration, which, in turn, may be related to differences in the macroclimatic attributes of the different habitats in which these toads occur (see Titon and Gomes, 2010). Whatever the case, the increased frequency of extreme climatic events (Dillon et al. 2016; Buckley & Huey 2016a; Sheldon & Dillon 2016) combining higher temperatures with dry conditions (Camacho, Rodrigues & Navas 2015; Buckley & Huey 2016b; Williams et al. 2016) may pose an important threat to amphibian conservation.
Optimal temperatures for locomotor performance (T o) and performance breadth (B80) both decreased with dehydration. These results suggest that the underlying processes supporting locomotion changed their thermal sensitivity with dehydration (see also McClanahan 1964; Hillman 1980; Hillman 1987). In general, the deleterious effects of dehydration were accentuated at higher temperatures and, as result, the optimal level of performance moved toward low temperatures. Considering that the combination of high temperatures and dehydration does not only compromise performance importantly but also pose major risks for water balance (discussed above), the attainment of optimal levels of performance at lower temperatures when dehydration becomes severe may be interpreted as important to decrease the risks of excessive evaporative water loss without compromising performance too heavily. For this to happen, concurrent changes in thermal preference (discussed below) are instrumental. In fact, dehydration may add to the importance of thermoregulatory adjustments, as the narrowing in B80 indicates that the buffering capacity to sustain performance against temperature variation was also compromised with dehydration. Finally, changes in thermal behavior are contingent to the availability of adequate thermal niches and, therefore, human‐induced changes in habitat attributes may hinder such organismal response.
We found that thermal tolerance declined with hydration level in R. schneideri. This effect was particularly prominent for the more dehydrated groups and included both an increment in CTmin and a decrease in CTmax. These results suggest the existence of a conflicting demand between water homeostasis and thermal tolerance. Under a water deficit situation, amphibians experience considerable rises in their body fluid concentrations and can also mobilize different metabolites thought to counteract dehydration damages (Shoemaker 1964; Degani & Warburg 1984; Jørgensen 1997; Anderson et al. 2017). Similarly, the exposure to extreme temperatures, both cold and warm, induces the cellular production of molecules in order to mitigate thermal damages (e.g., heat‐shock proteins) (Easton, Rutledge, & Spotila 1987; Feder and Hofmann, 1999, see also Ketola‐Pirie & Atkinson 1983). Therefore, dehydration and thermal stress trigger molecular pathways and/or cause biochemical alterations that may interfere with each other response and, possibly, limit the magnitude of tolerance. Finally, as dehydration is accompanied by a decrease in the rates of evaporative water loss in R. schneideri (Anderson et al. 2017), the buffering of evaporative cooling against body temperature elevation might be compromised on dehydrated toads, which will lead to a decrease in CTmax. All these ideas agree with our observation that as dehydration becomes more severe, thermal tolerance range is narrowed.
Fully hydrated toads attained maximum levels of performance at temperatures much higher than their preferred body temperatures (Figure 4). Similar mismatches have been previously reported (Tracy et al. 1993; Köhler et al. 2011; Mitchell and Bergmann, 2016; Gvoždík & Kristín 2017) and may involve functional constraints and, perhaps, methodological limitations. For example, we should consider that the underlying processes driving thermoregulatory behavior during the determination of T pref in a thermal gradient are, most likely, diverse from those at play during the assessment of the sensibility of locomotor performance to temperature (see also Gvoždík & Kristín 2017). Also, T o determination usually is based on the assessment of a single trait, for example, locomotion (e.g., present study), while thermal preference may reflect the integration of various simultaneous processes (Huey & Stevenson 1979; Angilletta, Niewiarowski & Navas 2002; Martin & Huey 2008; Navas et al. 2008). The mismatch between T pref and T o may also result from differences in the selective forces that have acted during the evolution of each of these traits, as well as differences in how conservative they are. In such case, historical factors may contribute to the incongruence observed between T pref and T o (Huey & Bennett 1987; Angilletta, Hill & Robson 2002; Martin & Huey 2008; Mitchell & Bergmann 2016; Gvoždík & Kristín 2017).
Dehydration shifted thermal preference toward lower body temperatures in Rhinella schneideri. Therefore, the change in thermal preference agreed with the ideas discussed above in terms of accommodating conflicting demands related to water balance and behavioral performance. In terms of water balance, the decrease in thermal preference with dehydration is thought to be of great functional and ecological relevance as lower temperatures diminish the potential for water evaporation. Combined with the decrease in evaporative water loss associated with dehydration (Anderson et al. 2017), these responses are likely to assist animals already under a hydric deficit to slow down the rate of evaporative water loss, and eventually, reestablish their normal water balance (see also Bundy & Tracy 1977; Malvin & Wood 1991; Tracy et al. 1993; Williams & Wygoda 1993; Mitchell and Bergmann, 2016). In terms of behavioral performance, the concurrent changes in T pref and T o reduced the mismatch between these two variables (discussed above) as dehydration became more severe. Therefore, even if operating at low absolute levels under dehydration, the performance in locomotion could still occur at its optimum, as long as the animals were allowed to adjust their thermal preference. Such response has been previously reported for other anuran species (Köhler et al. 2011; Mitchell and Bergmann, 2016) and may contribute importantly to mitigate the effects of dehydration on homeostasis (Preest & Pough 1989; Preest & Pough 2003; Gvoždík & Kristín 2017).
In summary, our results show that while dehydration was associated with negative effects on behavioral performance and thermal tolerance, concurrent changes in thermoregulatory behavior contributed to minimize these effects. The most severe consequences of dehydration, not surprisingly, were associated with high temperatures. These observations highlight the importance of the availability of adequate thermal niches in order to allow the amphibians to resort on thermoregulatory adjustments in response to water stress situations. In this regard, future scenarios in which the combination of higher temperatures and low water availability is predicted to become more frequent (McMenamin, Hadly & Wright 2008; Hof et al. 2011; Sherwood & Fu 2014; Sunday et al. 2014) may pose quite significant threats to the conservation of terrestrial amphibians (Todgham & Stillman 2013; Sunday et al. 2014; Nowakowski et al. 2016).
CONFLICT OF INTEREST
The authors declare no conflict of interest.
AUTHORS' CONTRIBUTIONS
RCOA and DVA conceived the ideas and designed methodology; RCOA collected and analyzed the data; RCOA and DVA contributed equally to the writing of the manuscript. All authors contributed critically to the drafts and gave final approval for publication.
DATA ACCESSIBILITY
Data will be deposited in the Dryad Digital Repository.
Supporting information
ACKNOWLEDGMENTS
We thank Celso Gavira, Rodrigo Gavira, Diogo P. V. Andrade, and Ailton F. Neto for granting access to the collection site and helping with animal collection. We also thank Lucas S. Almeida for the high‐quality photograph of our study animal. The permit for animal collection was issued by Instituto Chico Mendes da Conservação da Biodiversidade—Brazil (Permit number 35081‐3), and all experimental protocols were approved by the Unesp Ethical Committee in Animal Experimentation (Comissão de Ética no Uso de Animais—UNESP, Permit number 29703‐1). This study was supported by the São Paulo Research Foundation—FAPESP (#13/04190‐9 and #2017/13005‐1 to DVA), CAPES (192868‐1 to RCOA), and the National Council for Scientific and Technological Development—CNPq (proc. 302045/2012‐0 and 306811/2015‐4 to DVA).
Anderson RCO, Andrade DV. Trading heat and hops for water: Dehydration effects on locomotor performance, thermal limits, and thermoregulatory behavior of a terrestrial toad. Ecol Evol. 2017;7:9066–9075. https://doi.org/10.1002/ece3.3219
REFERENCES
- Anderson, R. C. O. , Bovo, R. P. , Eismann, C. E. , Menegario, A. A. , & Andrade, D. V. (2017). Not good, but not all bad: Dehydration effects on body fluids, organ masses, and water flux through the skin of Rhinella schneideri (Amphibia, Bufonidae). Physiological and Biochemical Zoology, 90, 313–320. https://doi.org/10.1086/690189 [DOI] [PubMed] [Google Scholar]
- Angilletta, M. J. , Niewiarowski, P. H. , & Navas, C. A. (2002). The evolution of thermal physiology in ectotherms. Journal of Thermal Biology, 27, 249–268. [Google Scholar]
- Angilletta, M. J. , Hill, T. , & Robson, M. A. (2002). Is physiological performance optimized by thermoregulatory behavior?: A case study of the eastern fence lizard, Sceloporus undulatus . Journal of Thermal Biology, 27, 199–204. [Google Scholar]
- Angilletta, M. J. , Wilson, R. S. , Navas, C. A. , & James, R. S. (2003). Tradeoffs and the evolution of thermal reaction norms. Trends in Ecology & Evolution, 18, 234–240. [Google Scholar]
- Angilletta, M. J. (2006). Estimating and comparing thermal performance curves. Journal of Thermal Biology, 31, 541–545. [Google Scholar]
- Angilletta, M. J. (2009). Thermal adaptation: A theoretical and empirical synthesis. Oxford: Oxford University Press. [Google Scholar]
- Angilletta, M. J. , Huey, R. B. , & Frazier, M. R. (2010). Thermodynamic effects on organismal performance: Is hotter better? Physiological and Biochemical Zoology, 83, 197–206. [DOI] [PubMed] [Google Scholar]
- Artacho, P. , Saravia, J. , Ferrandière, B. D. , Perret, S. , & Galliard, L. (2015). Quantification of correlational selection on thermal physiology, thermoregulatory behavior, and energy metabolism in lizards. Ecology and Evolution, 5, 3600–3609. [DOI] [PMC free article] [PubMed] [Google Scholar]
- Beuchat, C. A. , Pough, F. H. , & Stewart, M. M. (1984). Response to simultaneous dehydration and thermal stress in three species of Puerto Rican frogs. Journal of Comparative Physiology B, 154, 579–585. [Google Scholar]
- Bícego‐Nahas, K. C. , Gargaglioni, L. H. , & Branco, L. G. S. (2001). Seasonal changes in the preferred body temperature, cardiovascular, and respiratory responses to hypoxia in the toad, Bufo paracnemis . Journal of Experimental Zoology, 289, 359–365. [DOI] [PubMed] [Google Scholar]
- Buckley, L. B. , & Huey, R. B. (2016a). Temperature extremes: Geographic patterns, recent changes, and implications for organismal vulnerabilities. Global Change Biology, 22, 3829–3842. [DOI] [PubMed] [Google Scholar]
- Buckley, L. B. , & Huey, R. B. (2016b). How extreme temperatures impact organisms and the evolution of their thermal tolerance. Integrative and Comparative Biology, 56, 98–109. [DOI] [PubMed] [Google Scholar]
- Bundy, D. , & Tracy, C. R. (1977). Behavioral response of American toads (Bufo americanus) to stressful thermal and hydric environments. Herpetologica, 33, 455–458. [Google Scholar]
- Camacho, A. , Rodrigues, M. T. , & Navas, C. (2015). Extreme operative temperatures are better descriptors of the thermal environment than mean temperatures. Journal of Thermal Biology, 49, 106–111. [DOI] [PubMed] [Google Scholar]
- Carey, C. (1978). Factors affecting body temperatures of toads. Oecologia, 35, 197–219. [DOI] [PubMed] [Google Scholar]
- Claussen, D. (1977). Thermal acclimation in ambystomatid salamanders. Comparative Biochemistry and Physiology ‐ Part A: Physiology, 58, 333–340. [Google Scholar]
- Degani, G. , & Warburg, M. R. (1984). Changes in concentrations of ions and urea in both plasma and muscle tissue in a dehydrated hylid anuran. Comparative Biochemistry and Physiology Part A: Physiology, 77, 357–360. [Google Scholar]
- Dillon, M. E. , Woods, H. A. , Wang, G. , Fey, S. B. , Vasseur, D. A. , Telemeco, R. S. , … Pincebourde, S. (2016). Life in the frequency domain: The biological impacts of changes in climate variability at multiple time scales. Integrative and Comparative Biology, 56, 14–30. [DOI] [PubMed] [Google Scholar]
- Easton, D. P. , Rutledge, P. S. , & Spotila, J. R. (1987). Heat shock protein induction and induced thermal tolerance are independent in adult salamanders. Journal of Experimental Zoology, 241, 263–267. [DOI] [PubMed] [Google Scholar]
- Feder, M. E. , & Hofmann, G. E. (1999). Heat‐shock proteins, molecular chaperones, and the stress response: Evolutionary and ecological physiology. Annual Review of Physiology, 61, 243–282. [DOI] [PubMed] [Google Scholar]
- Gvoždík, L. , & Kristín, P. (2017). Economic thermoregulatory response explains mismatch between thermal physiology and behavior in newts. Journal of Experimental Biology, 220, 1106–1111. https://doi.org/10.1242/jeb.145573 [DOI] [PubMed] [Google Scholar]
- Hertz, P. E. , Huey, R. B. , & Stevenson, R. D. (1993). Evaluating temperature regulation by field‐active ectotherms: The fallacy of the inappropriate question. The American Naturalist, 142, 796–818. [DOI] [PubMed] [Google Scholar]
- Hillman, S. S. (1980). Physiological correlates of differential dehydration tolerance in anuran amphibians. Copeia, 1, 125–129. [Google Scholar]
- Hillman, S. S. (1987). Dehydrational effects on cardiovascular and metabolic capacity in two amphibians. Physiological Zoology, 60, 608–613. [Google Scholar]
- Hof, C. , Araújo, M. B. , Jetz, W. , & Rahbek, C. (2011). Additive threats from pathogens, climate and land‐use change for global amphibian diversity. Nature, 480, 516–519. [DOI] [PubMed] [Google Scholar]
- Huey, R. B. , & Slatkin, M. (1976). Cost and benefits of lizard thermoregulation. Quarterly Review of Biology, 51, 363–384. [DOI] [PubMed] [Google Scholar]
- Huey, R. B. , & Stevenson, R. D. (1979). Integrating thermal physiology and ecology of ectotherms: A discussion of approaches. American Zoologist, 19, 357–366. [Google Scholar]
- Huey, R. B. , & Bennett, A. F. (1987). Phylogenetic studies of coadaptation: Preferred temperatures versus optimal performance temperatures of lizards. Evolution, 41, 1098–1115. [DOI] [PubMed] [Google Scholar]
- Huey, R. B. , & Kingsolver, J. G. (1989). Evolution of thermal sensitivity of ectotherm performance. Trends in Ecology & Evolution, 4, 131–135. [DOI] [PubMed] [Google Scholar]
- Huey, R. B. , & Kingsolver, J. G. (1993). Evolution of resistance to high temperature in ectotherms. American Naturalist, 142, S21–S46. [Google Scholar]
- Jørgensen, C. B. (1997). 200 years of amphibian water economy: From Robert Townson to the present. Biological Reviews of the Cambridge Philosophical Society, 72, 153–237. [DOI] [PubMed] [Google Scholar]
- Ketola‐Pirie, C. A. , & Atkinson, B. G. (1983). Cold‐and heat‐shock induction of new gene expression in cultured amphibian cells. Canadian Journal of Biochemistry and Cell Biology, 61, 462–471. [DOI] [PubMed] [Google Scholar]
- Köhler, A. , Sadowska, J. , Olszewska, J. , Trzeciak, P. , Berger‐Tal, O. , & Tracy, C. R. (2011). Staying warm or moist? Operative temperature and thermal preferences of common frogs (Rana temporaria), and effects on locomotion. The Herpetological Journal, 21, 17–26. [Google Scholar]
- Malvin, G. M. , & Wood, S. C. (1991). Behavioral thermoregulation of the toad, Bufo marinus: Effects of air humidity. Journal of Experimental Zoology, 258, 322–326. [DOI] [PubMed] [Google Scholar]
- Martin, T. L. , & Huey, R. B. (2008). Why “suboptimal” is optimal: Jensen's inequality and ectotherm thermal preferences. The American Naturalist, 171, E102–E118. [DOI] [PubMed] [Google Scholar]
- Mitchell, A. , & Bergmann, P. J. (2016). Thermal and moisture habitat preferences do not maximize jumping performance in frogs. Functional Ecology, 30, 733–742. [Google Scholar]
- McClanahan, L. (1964). Osmotic tolerance of the muscles of two desert‐inhabiting toads, Bufo cognatus and Scaphiopus couchi . Comparative Biochemistry and Physiology, 12, 501–508. [DOI] [PubMed] [Google Scholar]
- McMenamin, S. K. , Hadly, E. A. , & Wright, C. K. (2008). Climatic change and wetland desiccation cause amphibian decline in Yellowstone National Park. Proceedings of the National Academy of Sciences of the United States of America, 105, 16988–16993. [DOI] [PMC free article] [PubMed] [Google Scholar]
- Moore, F. R. , & Gatten, R. E. Jr (1989). Locomotor performance of hydrated, dehydrated, and osmotically stressed anuran amphibians. Herpetologica, 45, 101–110. [Google Scholar]
- Navas, C. A. , Gomes, F. R. , & Carvalho, J. E. (2008). Thermal relationships and exercise physiology in anuran amphibians: Integration and evolutionary implications. Comparative Biochemistry and Physiology Part A: Molecular & Integrative Physiology, 151, 344–362. [DOI] [PubMed] [Google Scholar]
- Norman, D. R. (1994). Amphibians and reptiles of the Paraguayan Chaco, Volume 1. San José, Costa Rica: Private printing. [Google Scholar]
- Noronha‐de‐Souza, C. R. , Bovo, R. P. , Gargaglioni, L. H. , Andrade, D. V. , & Bícego, K. C. (2015). Thermal biology of the toad Rhinella schneideri in a seminatural environment in southeastern Brazil. Temperature, 2, 554–562. [DOI] [PMC free article] [PubMed] [Google Scholar]
- Nowakowski, A. J. , Watling, J. I. , Whitfield, S. M. , Todd, B. D. , Kurz, D. J. , & Donnelly, M. A. (2016). Tropical amphibians in shifting thermal landscapes under land use and climate change. Conservation Biology, 31, 96–105. https://doi.org/10.1111/cobi.12769 [DOI] [PubMed] [Google Scholar]
- Plummer, M. V. , Williams, B. K. , Skiver, M. M. , & Carlyle, J. C. (2003). Effects of dehydration on the critical thermal maximum of the desert box turtle (Terrapene ornata luteola). Journal of Herpetology, 37, 747–750. [Google Scholar]
- Pramuk, J. B. , Robertson, T. , Sites, J. W. , & Noonan, B. P. (2008). Around the world in 10 million years: Biogeography of the nearly cosmopolitan true toads (Anura: Bufonidae). Global Ecology and Biogeography, 17, 72–83. [Google Scholar]
- Prates, I. , Angilleta, M. J. Jr , Wilson, R. S. , Niehaus, A. C. , & Navas, C. A. (2013). Dehydration hardly slows hopping toads (Rhinella granulosa) from xeric and mesic environments. Physiological and Biochemical Zoology, 86, 451–457. [DOI] [PubMed] [Google Scholar]
- Preest, M. R. , & Pough, F. H. (1989). Interaction of temperature and hydration on locomotion of toads. Functional Ecology, 3, 693–699. [Google Scholar]
- Preest, M. R. , & Pough, F. H. (2003). Effects of body temperature and hydration state on organismal performance of toads, Bufo americanus . Physiological and Biochemical Zoology, 76, 229–239. [DOI] [PubMed] [Google Scholar]
- R CORE TEAM (2015). R: A language and environment for statisticalcomputing Vienna, Austria: R Foundation for Statistical Computing. [Google Scholar]
- Rome, L. C. , Stevens, E. D. , & John‐Alder, H. B. (1992). The influence of temperature and thermal acclimation on physiological function In Feder M. E., & Burrgren W. W. (Eds.), Environmental physiology of the amphibians (pp. 183–205). Chicago, IL: Univerity of Chicago Press. [Google Scholar]
- Santos, T. G. , Vasconcelos, T. D. S. , Rossa‐Feres, D. D. C. , & Haddad, C. F. (2009). Anurans of a seasonally dry tropical forest: Morro do Diabo State Park, São Paulo state, Brazil. Journal of Natural History, 43, 973–993. [Google Scholar]
- Sheldon, K. S. , & Dillon, M. E. (2016). Beyond the mean: Biological impacts of cryptic temperature change. Integrative and Comparative Biology, 56, 110–199. [DOI] [PubMed] [Google Scholar]
- Sherwood, S. , & Fu, Q. (2014). A drier future? Science, 343, 737–739. [DOI] [PubMed] [Google Scholar]
- Shoemaker, V. H. (1964). The effects of dehydration on electrolyte concentrations in a toad, Bufo marinus . Comparative Biochemistry and Physiology, 13, 261–271. [DOI] [PubMed] [Google Scholar]
- Sunday, J. M. , Bates, A. E. , Kearney, M. R. , Colwell, R. K. , Dulvy, N. K. , Longino, J. T. , & Huey, R. B. (2014). Thermal‐safety margins and the necessity of thermoregulatory behavior across latitude and elevation. Proceedings of the National Academy of Sciences of the United States of America, 111, 5610–5615. [DOI] [PMC free article] [PubMed] [Google Scholar]
- Titon, B. Jr , Navas, C. A. , Jim, J. , & Gomes, F. R. (2010). Water balance and locomotor performance in three species of neotropical toads that differ in geographical distribution. Comparative Biochemistry and Physiology Part A: Molecular & Integrative Physiology, 156, 129–135. [DOI] [PubMed] [Google Scholar]
- Titon, B. Jr , & Gomes, F. R. (2010). Associations of water balance and thermal sensitivity of toads with macroclimatic characteristics of geographical distribution. Comparative Biochemistry and Physiology Part A: Molecular & Integrative Physiology, 280, 54–60. https://doi.org/10.1016/j.cbpa.2017.03.012 [DOI] [PubMed] [Google Scholar]
- Todgham, A. E. , & Stillman, J. H. (2013). Physiological responses to shifts in multiple environmental stressors: Relevance in a changing world. Integrative and Comparative Biology, 53, 539–544. [DOI] [PubMed] [Google Scholar]
- Tracy, C. R. (1976). A model of the dynamic exchanges of water and energy between a terrestrial amphibian and its environment. Ecological Monographs, 46, 293–326. [Google Scholar]
- Tracy, C. R. , Christian, K. A. , O'Connor, M. P. , & Tracy, C. R. (1993). Behavioral thermoregulation by Bufo americanus: The importance of the hydric environment. Herpetologica, 49, 375–382. [Google Scholar]
- Tracy, C. R. , Tixier, T. , Le Nöene, C. , & Christian, K. A. (2014). Field hydration state varies among tropical frog species with different habitat use. Physiological and Biochemical Zoology, 87, 197–202. [DOI] [PubMed] [Google Scholar]
- Williams, C. M. , Buckley, L. B. , Sheldon, K. S. , Vickers, M. , Pörtner, H. O. , Dowd, W. W. , … Stillman, J. H. (2016). Biological impacts of thermal extremes: Mechanisms and costs of functional responses matter. Integrative and Comparative Biology, 56, 73–84. [DOI] [PubMed] [Google Scholar]
- Williams, A. A. , & Wygoda, M. L. (1993). Dehydration stimulates behavioral hypothermia in the gulf coast toad, Bufo valliceps . Journal of Thermal Biology, 18, 223–227. [Google Scholar]
- Wygoda, M. L. (1984). Low cutaneous evaporative water loss in arboreal frogs. Physiological Zoology, 57, 329–337. [Google Scholar]
Associated Data
This section collects any data citations, data availability statements, or supplementary materials included in this article.
Supplementary Materials
Data Availability Statement
Data will be deposited in the Dryad Digital Repository.


