Abstract
Purpose
The metabolites PCr, ATP and in-organic phosphate i.e. Pi are biochemically coupled. Their pool sizes, assessed by their magnetization ratios, have been extensively studied and reflect bioenergetics status in vivo. However, most such studies have ignored chemical exchange and T1 relaxation effects. In this work, we aimed to extend the T1nom method to simultaneously quantify the reaction rate constants as well as phosphorus metabolite pool size ratios under partially relaxed conditions.
Materials and Methods
Modified Bloch-McConnell equations were used to simulate the effects of chemical exchanges on T1 relaxation times and magnetization ratios among PCr, γ-ATP and Pi. The T1nom method with iteration approach was used to measure both reaction constants and metabolite pool size ratios. In order to validate our method, in vivo data from rat brains (N= 8) at 9.4 T were acquired under two conditions i.e. approximately full relaxation (TR= 9 sec) and partial relaxation (TR= 3 sec). We compared metabolite pool size ratios and reaction constants before and after correcting the chemical exchange and T1 relaxation effects.
Results
There were significant errors in underestimation of PCr/γATP by 12 % (p= 0.03) and overestimation of ATP/Pi ratios by 14 % (p= 0.04) when not considering chemical exchange effects. These errors were minimized using our iteration approach, resulting in no significant differences (PCr/γATP, p= 0.47; ATP/Pi, p= 0.81) in metabolite pool size ratios and reaction constants between the two measurements (i.e. short vs. long TR conditions).
Conclusion
Our method can facilitate broad biomedical applications of 31P magnetization saturation transfer spectroscopy, requiring high temporal and/or spatial resolution for assessment of altered bioenergetics.
Keywords: Chemical exchange, T1relaxation, metabolite pool size ratios, reaction kinetics, bioenergetics
Introduction
Phosphorus magnetic resonance spectroscopy (31P-MRS) provides insight into bioenergetic impairment and mitochondrial dysfunction in vivo under various physiological and pathological conditions (1-5). Major phosphorus-containing metabolites related to bioenergetics detected by in vivo 31P-MRS include phosphocreatine (PCr), inorganic phosphate (Pi), and adenosine triphosphate (ATP) with the α-, β- and γ-resonances. These metabolites compose a chemical exchange network (PCr↔ATP↔Pi) catalyzed by the enzymes creatine kinase (CK) and ATP synthase (ATPase). These chemical reactions are crucial for regulating ATP metabolism and maintaining normal ATP functionality. The phosphorus metabolite levels or pool sizes assessed by their magnetization ratios such as PCr to γ-ATP (PCr/γ-ATP), γ-ATP to Pi (γ-ATP/Pi) and PCr to Pi (PCr/Pi) have been extensively studied in various disease states in vivo, for instance in the brain (6-8), heart (9,10), and muscle (2,11).
For measuring phosphorus-containing metabolite levels using a conventional MRS approach, Ernst and Anderson (12) suggested that large improvements in signal-to-noise ratio (SNR) per unit sampling time could be achieved by the use of short inter-pulse delay time (TR) and small flip angle (FA < 90°). However, the Ernst equation to correct resonance saturation effect due to short TR is only valid in the case where the species under consideration are not in chemical exchange or TR should be sufficiently short (rapid pulsing condition) so negligible chemical exchange occurs. In realistic experimental conditions, this is unlikely. Despite the essential role of accurate metabolite quantification, especially for determining the metabolic rates (or fluxes) of CK and ATPase reactions, most studies have ignored the chemical exchange and T1 relaxation effects on metabolite quantification (13-17) Hence, a more advanced correction method that is capable of considering T1 relaxation as well as chemical exchange effects would be required.
31P magnetization transfer, in particular magnetization saturation transfer (MST) spectroscopy has been widely used for measuring the reaction kinetics of enzymes noninvasively to provide insights into the biological mechanism of disease (18). However, the applications of 31P-MRS to access high-energy metabolite levels or kinetics of enzyme activity have been limited by its intrinsically low SNR, due primarily to the relatively low 31P gyromagnetic ratio and low metabolite concentrations (few millimolars). This results in long experiment times. In some cases, the lengthy total acquisition time may not be clinically acceptable; one such example is a conventional MST spectroscopy technique that requires multiple data point measurements with progressively saturating the γ-ATP resonance under full relaxation conditions. To overcome the lengthy scan time in MST, some novel methods have been suggested, such as two repetition time saturation transfer (TwiST) (19), four-angle saturation transfer (FAST) (20) and the T1nom method allowing rapid in vivo measurement of CK/ATPase reaction kinetics (21). Particularly, the T1nom method with optimized TR and FA under partial relaxation conditions allows us to measure CK and ATPase reaction rate constants using only two spectra, thereby substantially reducing experiment time (21).
The purpose of this study is to extend the T1nom method to simultaneously quantify the reaction constants as well as metabolite pool size ratios under partially relaxed conditions.
Materials and Methods
Theory
The reaction scheme used in this study is a three-site chemical exchange network with linear form:
where kf and kr are forward and reverse pseudo-first-order rate constants, respectively. The magnetizations of three species undergoing chemical exchange can be characterized by the following equation (22):
| [1] |
where I is a 3×3 unity matrix, M0 is the longitudinal magnetization vector at thermal equilibrium (TR ≥ 5T1), M(0) is the initial magnetizations at t=0, and A is a dynamic matrix depending upon all of the T1int (intrinsic spin-lattice relation time in the absence of chemical exchange) of the metabolites and upon all of the reaction rate constants between these metabolites. The matrix A can be defined as:
It is notable that the inverse of the diagonal elements of matrix A can be defined as T1app of PCr, γ-ATP and Pi, respectively (22,23). These are the apparent spin-lattice relaxation times in the presence of a radio-frequency (RF) saturation. Eq. [1] can be used for simulating magnetizations at different TR, or for inversion recovery experiments via replacement of t by TR, or tinv (inversion recovery time), respectively.
Previously we presented a novel strategy (the T1nom method) for measurements of CK/ATPase reaction rate constants in partially relaxed conditions (i.e., short TR), based on an approximately linear relationship between the kf value and the extent of magnetization reduction in response to saturation pulse. This measurement proceeds according to the following equation (21):
| [2] |
where β is the intercept (usually within ±5% of 1), Ms and Mc are magnetizations obtained with and without (control) applying saturation pulse on γ-ATP resonance, respectively, and T1nom is the nominal T1 relaxation time. In principle, Mc, Ms and its ratio (Mc/Ms) can be deduced from Eq. [1] in the case of no saturation and full time saturation (tsat ≈ TR and d1 = 0, where tsat is the saturation time, see Figure 1). Then T1nom can be determined from the slope of the line obtained by linear regression of the simulated Mc/Ms versus kf plot. This strategy was applied in our previous study.
Figure 1.
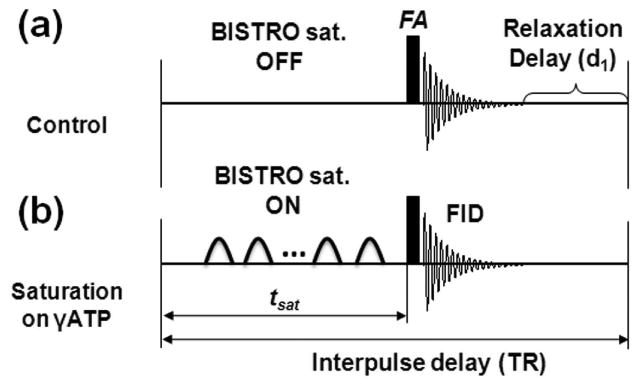
Diagram of the pulse sequence for magnetization saturation transfer experiments. The control (a) and saturated spectra (b) were acquired by saturation pulse train (BISTRO) “off” and “on”, respectively. The saturation pulse train with duration of tsat was used to saturate the γ-ATP resonance completely with the repetition time (TR) and the flip angle (FA). Obviously, magnetizations in the absence (i.e. during the time period of BISTRO saturation off and relaxation delay-d1) and presence of (i.e. during the time period of tsat) saturation pulse train will follow relaxation governed by relaxation times of T1mix and T1app, respectively.
To extend the T1nom method with arbitrary experimental parameters (TR, FA and tsat), the below formula for Mc/Ms from Lei et al. (24) was used in the current study:
| [3] |
where α = tsat/TR (0 ≤ α ≤ 1) and T1mix is spin-lattice relaxation time of metabolites with chemical exchanges in the absence of RF saturation. In our current simulations, we used Eq. [1] to predict magnetizations of PCr, γ-ATP and Pi during inversion recovery with different chemical exchange rate constants. Then T1mix values of PCr, γ-ATP and Pi were obtained by single-exponential fitting of simulated magnetizations. Therefore, using prior knowledge of T1int values from our previous study (25) and predetermined parameters (T1mix, T1app) as outlined above, we can simulate the relationship between Mc/Ms ratios and kf values using Eq. [3]. Thus, T1nom can be determined from the slope of the line obtained by linear regression of the simulated Mc/Ms versus kf plot. And we can calculate kf in short TR sequence from Eq. [2].
In order to provide a minimal α value for the application of our proposed method, we quantitatively evaluated the dependence of α values on the linearity by calculating summed squared fitting error (SSE) as below:
| [4] |
where S and Ŝ are simulated and fitted Mc/Ms ratios in the kf range of 0 to 1 sec-1, respectively. The calculated SSE values for each alpha value were normalized to the maximum SSE value. We considered that the linear relationship is maintained if normalized SSE values are below than 20 % with the correlation coefficient R2≥ 0.95.
The iteration approach for simultaneous measurements of reaction constants and pool size ratios is depicted in Figure 2. Briefly, based on initially estimated pool size ratios i.e. magnetization ratios at full relaxation condition (M0ini), T1int values from the literature or from prior measurements using the progressive saturation experiment, T1mix, T1app and T1nom are simulated as stated above. Then, using deduced T1nom and experimentally measured magnetizations with (Msmea) and without (Mcmea) saturation of γ-ATP resonance, kf is determined using Eq. [2]. Lastly, T1int, kf and M0int are used for the calculation of magnetizations without saturation of γ-ATP resonance at the experimental TR (Mccal) and new magnetizations at the full relaxation condition (M0new) using Eq. [1]. The new pool size ratios (M0new) are used to calculate the new T1nom and then new kf. The above procedures are repeated until calculated Mccal is close enough to the measured Mcmea (i.e., | Mcmea - Mccal |/Mcmea ≤ 1/SNR).
Figure 2.
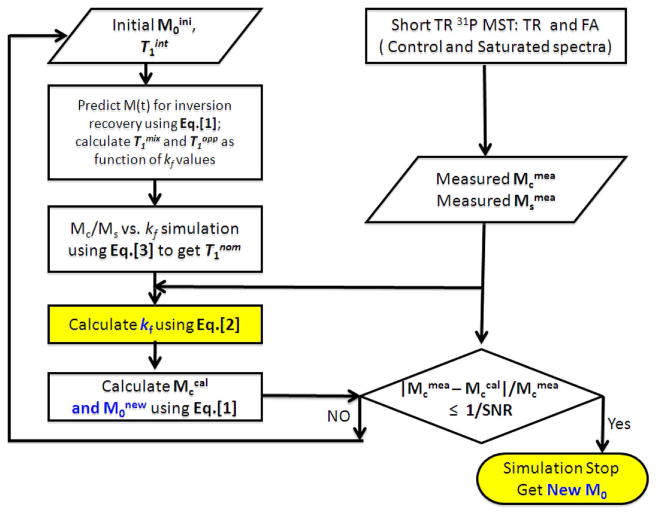
The flow chart showing our method for correcting T1 relaxation time and chemical exchange effects in short TR 31P-MST experiments. The procedure is repeated until simulated magnetization ratios are close enough to the measured magnetization ratios (i.e., the simulations stop when the difference is close to noise level). Note that only 2 spectra (i.e., control and saturated) are needed to measure metabolite ratios as well as forward CK/ATPase reaction rate constant.
The input parameters used in the simulation of our study is as follows: M0,PCr: M0,ATP: M0,Pi = 1: 0.55: 0.21; T1int of PCr= 3.83 sec, T1int of γ-ATP= 1.24 sec, T1int of Pi= 4.03 sec. These values were adapted from our previous report in rat brain (25). All abbreviations used in this study are listed in Table 1.
Table 1. Abbreviations and definitions of different types of T1.
| Abbreviation | Physical meanings |
|---|---|
| kf | Pseudo first-order forward reaction rate constant of enzyme |
| kr | Pseudo first-order reverse reaction rate constant of enzyme |
| M0 | Longitudinal magnetization at thermal equilibrium |
| M(0) | Initial magnetization at the time of zero |
| Mc | Magnetization without saturation pulse on γ-ATP resonance |
| Ms | Magnetization with saturation pulse on γ-ATP resonance |
| tsat | Saturation time |
| α | Percentage of saturation time over the repetition time (i.e., tsat/TR) |
| β | Intercept in simulated Mc/Ms versus kf plot |
| T1int | Intrinsic spin-lattice relation time in the absence of chemical exchange |
| T1mix | Spin-lattice relaxation time with chemical exchanges in the absence of RF saturation, determined byT1int, kf and pool size of metabolitesme metaboliest |
| T1app | Apparent spin-lattice relaxation time in the presence of a RF saturation, which is governed by T1int and kf. |
| T1nom | Nominal spin-lattice relaxation time defined as the slope of linear regression of simulated Mc/Ms versus kf plot |
Animals
All experimental protocols were performed according to the guidelines of the National Institute of Health and approved by the Institutional Animal Care and Use Committee of our institution. A total of 14 male Sprague-Dawley rats (250-360g) were used for our experiments (N= 6, inversion recovery experiment for T1mix measurement; N= 8, 31P-MST experiment with short and long TR). For MRI/MRS experiments, rats were anesthetized via inhalation of 2.5% (vol/vol) isoflurane in a nitrous oxide/ oxygen (3:2) mixture. Animal rectal temperatures were maintained at 37 ± 1 °C throughout the experiments.
31P-MRS Experiment
In vivo MR experiments were performed using a 9.4 T horizontal animal magnet (Magnex Scientific, Abingdon, UK) interfaced with Varian INOVA console (Palo Alto, CA, USA). A double-tuned (1H: butterfly-shape and 31P: elliptical-shape) surface coil was used for acquiring anatomical images, B0 shimming, and in vivo 31P spectra, respectively. The pulse sequence used for the in vivo 31P MST experiments is depicted in Figure 1 (23,25). Briefly, in vivo 31P spectra were acquired using the following acquisition parameters: spectral width 5000 Hz, 1024 data points. An adiabatic RF pulse (BIR4) with specific FA was used to excite the phosphate spins. For MST, in order to achieve complete saturation of the γ-ATP resonance, a B1-insensitive selective train to obliterate signal (BISTRO) (26) was used. Saturation times were controlled by varying the cycling number of the BISTRO pulse train. In addition, both an approximately full relaxation with steady-state saturation transfer experiment (TR= 9 sec; FA= 90°; tsat= 8.6 sec; 128 signal averages) and a partially relaxed saturation transfer experiment with optimized experimental parameters (21) (TR= 3 sec; FA= 45°; tsat= 2.6 sec; 256 signal averages) were performed to validate our methods. For the inversion recovery experiment to measure T1mix, 10 data points (inversion recovery time varied from 0.02 to 16 sec) were measured with TR= 18 sec and 48 signal averages.
Data Processing of 31P Spectra
In vivo 31P spectra were processed using the jMRUI software package (http://www.mrui.uab.es/mrui/mrui_Overview.shtml) (27). The peak integrals of PCr, γ-ATP, and Pi resonance were quantified by spectral fitting with the AMARES algorithm (28), as described in detail previously (29). All simulations in this study were performed using in-house written MATLAB software (R2009b, MathworksInc, USA). Statistical analysis was performed using non-parametric testing (Mann-Whitney test). All p values less than 0.05 were considered statistically significant.
Error Analysis
The accuracy for the calculation of magnetization pool size ratios and kf in our proposed method would depend on three kinds of parameters: (a) Mc/Ms measurement error due to finite spectral SNR, (b) FA inaccuracy commonly associated with RF surface coil, and (c) the uncertainty of T1int varied from the individual subject. SNR effect and the optimized acquisition parameters (e.g., TR, tsat, and FA) to minimize measurement errors have been discussed in our previous report (21). Here, we evaluated the effects of FA and T1int errors on calculated pool size ratios and kf by varying parameters (FA and T1int) with uncertainty level of ± 20%.
Results
Simulation of T1 Relaxation Times Under Chemical Exchange Conditions
In Figure 3, it is clear that T1 values for both PCr and Pi are in the following order: T1int>T1mix>T1app. Interestingly, for γ-ATP, T1 values are T1mix>T1int>T1app and T1mix increases with increased kf of the CK reaction (Figure 3a). The patterns of T1 relaxation time in regard to kf, ATPase are shown in Figure 3b; the change of γ-ATP T1 relaxation times are less sensitive to variation of kf, ATPase than to variation of kf, CK. As expected, the T1 relaxation time of PCr is less sensitive to kf, ATPase while the T1 relaxation times of Pi are the most sensitive parameter in this case.
Figure 3.
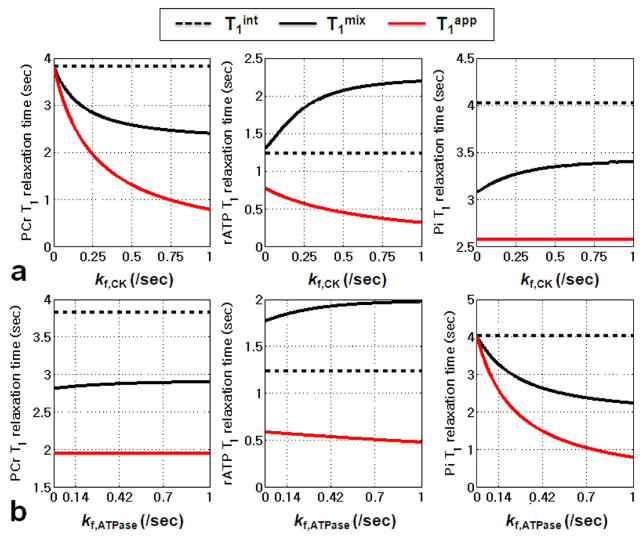
The three kinds of 31P containing metabolite spin-lattice relaxation times (i.e., T1int, T1mix, T1app) as function of kf,CK (a) and kf,ATPase (b). The physical meanings of each T1 term are described in text. The T1mix values are calculated by applying single-exponential least-square fit to the magnetizations simulated from Eq. [1]. Simulation parameters are as following: Spin system parameters: pool size ratio (PCr:γATP:Pi) = 1:0.55:0.21; intrinsic T1 for PCr, γATP, and Pi are 3.83, 1.24, and 4.03 sec, respectively. Chemical exchange parameter: (a) kf,ATPase = 0.14 sec-1(b) kf,CK = 0.25 sec-1
Furthermore, we simulated the effects of saturation time indicated by α on Mc/Ms ratio as a function of kf,CK(ATPase). Figure 4 shows the simulation results of Mc/Ms ratio with varied saturation time in experiments with short TR (TR=3 sec and FA=45°) and approximately full relaxation (TR= 9 sec and FA=90°), respectively. Interestingly, the approximately linear relationship between Mc/Ms ratio and kf,CK(ATPase) exists when α values are higher than 0.86 or less than 0.25 for short TR, and higher than 0.5 or less than 0.11 for long TR (Figure 4e and 4f). The small dynamic ranges of the Mc/Ms ratio may lead to large measurement errors if small α value is used. Therefore, we recommend α values in the higher range as indicated on the right side of Figures 4e and 4f.
Figure 4.
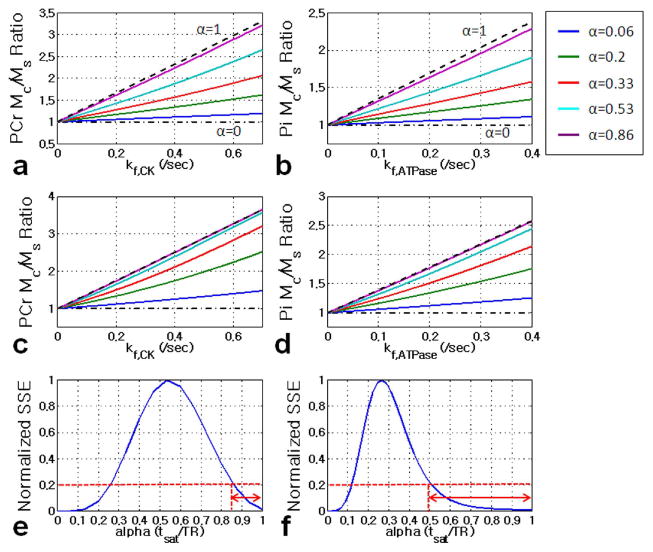
Simulated Mc/Ms ratio versus kf plot under various saturation times (tsat) indicated by α for FA of 45° and TR= 3 sec (a and b) and FA of 90° and TR= 9 sec (c and d). The simulation was performed using Eq. [3]. The α levels were varied from 0 to 1. The dashed and dash-dotted lines are obtained using α= 1 (full time saturation) and α= 0 (without saturation), respectively. The dependency of α values on the linear relationship between Mc/Ms ratio and kf value are also shown to guide the minimal α value that can be used for the application of our proposed method (e and f). Detailed descriptions about summed squared error (SSE) calculations are in text. We considered that the linear relationship is maintained if normalized SSE values are below than 20% with correlation coefficient R2≥ 0.95. The suggested α value ranges are indicated with arrows. Simulation parameters are as following: Spin system parameters: pool size ratio (PCr: γATP: Pi) = 1:0.55:0.21; intrinsic T1 for PCr, γATP, and Pi are 3.83, 1.24, and 4.03 sec, respectively.
The Effects of Chemical Exchange and Acquisition Parameters on Magnetization Ratios
Measurements of concentrations in NMR are frequently reported in terms of the ratio between two resonance amplitudes, one of which may serve as an internal reference for quantification. Therefore, for practicality, the simulated magnetizations by Eq. [1] are shown in terms of resonance ratios (i.e., PCr/γ-ATP, γ-ATP/Pi, and PCr/Pi) as function of TR, FA and kf (Figure 5). It is clear that the magnetization ratios are sensitive to acquisition parameters (TR, FA) (Figure 5a). Thus, quantification of magnetization ratios can be accurately performed by the use of long TR and small FA. Otherwise, the partial saturation effects due to short TR and chemical exchanges have to be considered. Figure 5b shows the percent differences in magnetization ratios between those calculated with and without considering the chemical exchange effect. For example, if we use TR=3 sec with FA=45° in the 31P-MRS experiment without considering chemical exchange effects, we may underestimate the PCr/γATP by 13% and overestimate γ-ATP/Pi ratios by 10%. Larger FA and shorter TR result in higher errors in quantification of metabolite levels. Figure 5c shows the effects of forward CK and ATPase reaction constants on simulated magnetization ratios. As expected, the PCr/γATP ratio is mostly affected by kf, CK, while γATP/Pi ratio is largely affected by kf, ATPase. PCr/Pi ratio is affected by both of kf, CK and kf, ATPase.
Figure 5.
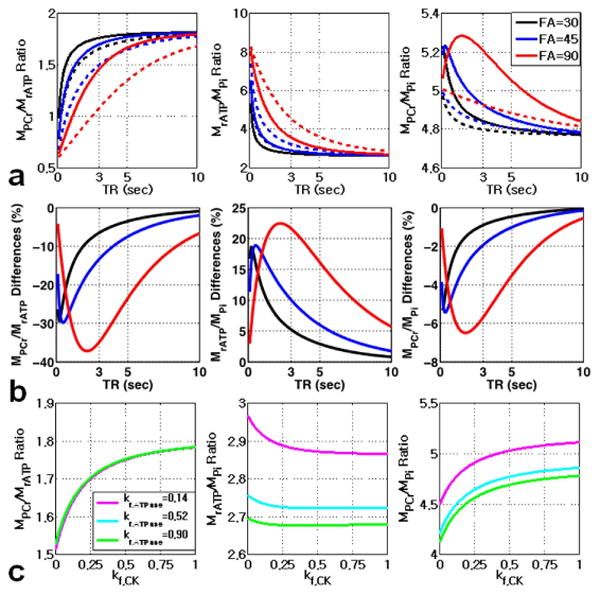
The simulated magnetization ratios with (solid line: kf,CK = 0.25 sec-1; kf,ATPase = 0.14 sec-1) and without (dashed line: kf,CK= kf,ATPase= 0 sec-1) considering chemical exchange effects are shown as function of TR (a) . Neglecting chemical exchange effects lead to underestimation of PCr/γATP, and overestimation of γATP/Pi and PCr/Pi ratio (b). The effects of FA on the magnetization ratios are also shown in different color line (black line: FA=30°, blue line: FA=45°, red line: FA=90°) in (a) and (b). The effects of kf, CK and kf, ATPase on the magnetization ratios are also shown in (c). Spin system parameters: pool size ratio (PCr:γATP:Pi) = 1:0.55:0.21; intrinsic T1 for PCr, γATP, and Pi are 3.83, 1.24, and 4.03 sec, respectively.
Validation of Our Approach
The measured T1mix values of PCr, γ-ATP and Pi from rat brains using the inversion recovery approach were 2.92±0.10 sec, 1.58±0.27 sec, and 3.52±0.69 sec, respectively. These results are comparable to the simulated T1mix values (PCr = 2.85 sec, γ-ATP = 1.81 sec, Pi = 3.28 sec) when kf, CK and kf, ATPase are 0.25 and 0.14 sec-1, respectively (Figure 3).
Figure 6 shows representative 31P spectra obtained from a rat brain. Table 2 summarizes the comparison results. There were no significant differences in both forward rate constants (kf, CK and kf, ATPase) between the two measurements (short vs. long TR) (p > 0.05). In addition, as can be seen in Table 2, without correcting for chemical exchange and T1 saturation effects, there were significant differences in the PCr/γ-ATP and γ-ATP/Pi ratios (p < 0.05). The PCr/γ-ATP ratio was underestimated by about 12% while γ-ATP/Pi was overestimated by about 14%; there was no major error in the PCr/Pi ratio estimate (∼2%). These results are consistent with our simulated results (Figure 5).
Figure 6.
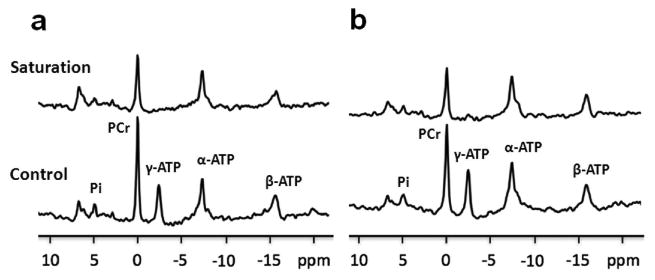
Representative 31P saturation and control spectra (upper and lower panel, respectively) from a rat brain with different acquisition parameters. (a) TR= 9 sec, tsat= 8.6 sec, FA= 90°, NT= 128; (b) TR= 3 sec, tsat= 2.6 sec, FA= 45°, NT= 256.
Table 2. Comparison of forward reaction rate constants and magnetization ratios deduced from approximately full (TR = 9 sec) and partial relaxation (TR = 3 sec) conditions.
| Reaction rate constants | TR = 9 sec | TR = 3 sec | |
|---|---|---|---|
| kf, CK (/sec) | 0.26 ± 0.04 | 0.25 ± 0.05 | |
| kf, ATPase (/sec) | 0.14 ± 0.03 | 0.13 ± 0.03 | |
|
| |||
| Magnetization Ratio | TR = 9 sec | TR = 3 sec | |
|
| |||
| Without Correction | With Correction | ||
|
| |||
| PCr/γATP ratio | 1.83 ± 0.19 | 1.61 ± 0.15 | 1.79 ± 0.17 |
| γATP/Pi ratio | 2.75 ± 0.65 | 3.20 ± 0.62 | 2.80 ± 0.58 |
| PCr/Pi ratio | 5.11 ± 1.73 | 5.20 ± 1.38 | 5.04 ± 1.39 |
All data are presented with mean ± standard deviation.
Effects of Errors of FA and T1int on Measurements of Magnetization Ratios and Reaction Kinetics
As shown in Figure 7, the calculated errors of magnetization pool size ratios (Figure 7a and 7b) are relatively less sensitive to the errors of FA and T1int compared to those of kf (Figure 7c and 7d). Even with ±20% uncertainty for each parameter, the errors of magnetization pool size ratios are less than 5%. Note that PCr/Pi ratios are relatively less sensitive to those parameters compared to PCr/γ-ATP and γ-ATP/Pi ratios.
Figure 7.
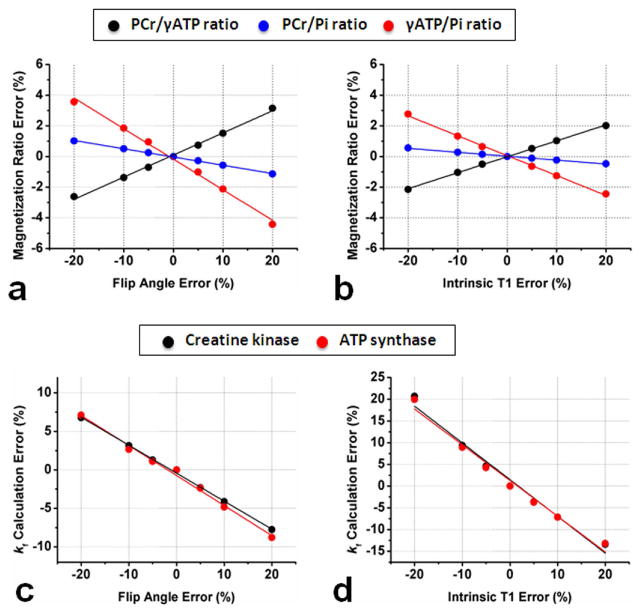
The effects of the errors of FA and T1int on calculated magnetization ratios (a and b) and forward reaction constants (c and d) from in vivo data (N= 8). Acquisition parameters: TR= 3 sec, tsat= 2.6 sec, FA= 45°; spin system parameters: intrinsic T1 for PCr, γATP, and Pi are 3.83, 1.24, and 4.03 sec, respectively.
Discussion
Previously we presented a novel strategy for rapid measurements of CK/ATPase reaction rate constants using short TR 31P-MST spectroscopy (21), which we named the T1nom method. In the current study, we leveraged this T1nom method in order to simultaneously quantify reaction rate constants as well as metabolite pool size ratios (PCr/γ-ATP, γ-ATP/Pi, and PCr/Pi) using the short TR 31P-MST experiment, and further validated the approach in vivo in the rat brain. Simultaneous measurement of both metabolite pool size ratios and reaction rate constants can provide more detailed information in studies of disease and response to therapy, in particular in conditions where there is no change in metabolite ratios but there is abnormal CK and/or ATPase activity (30,31). Moreover, our method uses only two spectra (control and saturated) with short TR, thereby increasing SNR and temporal resolution. This strategy can greatly facilitate in vivo bioenergetic studies for assessment of mitochondrial function.
Metabolite quantification is of great importance in in vivo 31P-MRS for studies of bioenergetic status. However, the chemical exchange and partial saturation effects due to short TR have been ignored in most studies of in vivo 31P-MRS (13-17), leading to substantial errors in metabolite quantification. Therefore, one needs caution in interpreting in vivo 31P-MRS data when these effects have not been considered. Conventionally, the saturation factor based on Ernst equation has been widely used to correct resonance saturation effects; for instance, metabolite quantification by in vivo 1H-MRS with previously measured T1 values at a specific scanner. This is popularly called T1 correction. But this approach does not work for quantification of PCr, ATP and Pi in vivo because T1 relaxation times in a system with chemical exchange (i.e., T1mix) of PCr, ATP and Pi could be different due to the altered enzyme activities of CK and ATPases, as illustrated by our simulations. Direct measurement of T1mix values by inversion recovery is time-consuming, requiring multiple data points. In this work, we suggest that one can correct the chemical exchange and T1 saturation effects without measuring T1mix values of metabolites since simulated T1mix values are quite consistent with those from the in vivo measurements. Although our strategy involves an iterative simulation step, the computation time (on a computer with 2.2 GHz Intel Core i7 and 16 GB memory) for all steps (usually only 3-4 iterations) was less than 20 seconds to obtain final thermal equilibrium magnetization ratios (i.e., fully relaxed magnetization, M0), even if we used an extremely different initial metabolite pool size ratio (e.g., PCr:γATP:Pi=1:0.001:0.0001). In addition, the simulations of T1mix of PCr, γ-ATP and Pi are very helpful to understand why magnetization ratios could be under- or overestimated if one neglects the chemical exchange and partial saturation effects.
The key property of T1nom used in this work is a function of the properties of both spin system and acquisition parameters according to the below equation:
| [5] |
Under the full relaxation condition, T1nom = T1int. Although there is no general analytic expression about T1nom, it can be deduced from the linear regression of Mc/Ms vs. kf,CK(ATPase) plot using Eq. [3]. The linear relationship between Mc/Ms and kf,CK(ATPase) is well maintained in the large range of acquisition parameters as long as the saturation time (tsat) is close to TR (i.e., α> 0.86). This may impose specific absorption rate (SAR) problems especially at ultra-high field magnetic scanners, where SAR limitations require a short saturation time and thereby leading to a nonlinear function of Mc/Ms vs. kf,CK(ATPase). However, kf,CK(ATPase) still could be deduced by solving Eq. [3] from two spectra in which only one unknown parameter (kf,CK(ATPase)) exists if T1int is known. These two parameters (kf and T1int) are properties of the chemical exchange system described in Eq. [3]. The other parameters (T1mix, T1app) depend on parameters of kf and T1int as outlined above.
One of the challenges encountered in the application of the 31P-MST approach is the direct irradiation of the observed resonance due to imperfect saturation profiles. This is called the RF spillover effect. Without accounting for this effect, calculated reaction rates may be inaccurate. The most common approach for accounting for RF spillover effects is performing a control experiment with application of an RF saturation pulse on the opposite site of the coupled spin (e.g., PCr), but with the same chemical shift offset to the γ-ATP resonance. In this work, we applied a BISTRO saturation scheme with significantly improved saturation profile (26,32). Previously, we demonstrated that the RF spillover effect is negligible during the use of the BISTRO saturation scheme with control spectrum acquired in the absence of RF saturation at 9.4 T and 4 T (23,29,30). Therefore, we believe only two 31P spectra (control and saturation of γ-ATP resonance) are required to determine forward reaction kinetics of CK/ATPases reactions in vivo at high/ultra-high field scanner (≥ 4 T). In addition, it is notable that potential FA errors associated with the applied adiabatic RF pulse in our experiment may lead to significant measurement errors for kf quantification. This problem can be addressed using an alternative experimental set-up where the 31P volume coil functions as transmitter with more homogeneous excitation and a surface coil functions as receiver. Another consideration is that the relayed magnetization transfer and nuclear Overhauser effect (NOE) (32-34) may contribute to the quantification errors in the three-site chemical exchange model. However, this contribution should be small, since relayed magnetization transfer and/or NOE effects induce negligible magnetization transfer effects (32). The Pi resonances from extra- and intracellular compartments have been observed previously (23,35), but it is difficult to resolve these two adjacent Pi resonances in our current study due to the limited SNR of spectra obtained from small rat brains at 9.4 T.
There is growing evidence for abnormalities of high-energy substance levels and/or altered kinetics in various diseases across multiple biological systems such as brain (7,13-17,29,30), liver (36,37), muscle (2) and heart (9,10,38,39). Our method can be applied to any of those listed above (i.e. it is not restricted to brain), but we recommend caution when using T1int values from the literature. Although there are reports to suggest that T1int is constant under various physiological conditions (21,30), the value of T1int could still change with magnetic field strength, different organs and pathological/physiological conditions. Therefore, we strongly recommend direct T1int measurement in a cohort of subjects while using our approach. T1in can be measured using a progressive MST experiment at fully relaxed conditions with multiple saturation times (5∼7 spectra) (23,25). However, this approach results in long experiment times and may not be clinically acceptable. Four-angle saturation transfer (FAST) (20) is an alternative choice. Notably, even if T1int is unknown, kf and T1int values can be obtained by fitting the dependence of Mc/Ms ratio on tsat using Eq.[3] after simulating T1mix using Eq.[1]. Thus, kf as well as metabolites poor size ratios could still be determined with multiple spectra with short TR and varied saturation times. Our method provides a universal approach for any experiment conditions to measure CK/ATPases reactions in vivo.
One advantage of the currently proposed method is that both CK/ATPase reaction rate constants and metabolite levels can be rapidly measured using only two spectra with short TR. This approach should lead to improvements in SNR and temporal resolution and enable “functional” MRS (fMRS) studies where the impact of bioenergetically-costly interventions on CK and ATPase reactions can be quantified. Using such an fMRS approach will allow us to study energy metabolism changes, for instance, during visual stimulation paradigms or muscle metabolism during exercise; these may be useful to uncover abnormal bioenergetics when resting state phosphate metabolite levels of PCr, ATP and Pi appear normal. Lastly, our method can be combined with 3D-CSI techniques to determine whether bioenergetics of gray matter and white matter (40) are significantly different, and/or allow us to directly map the forward CK/ATPase flux rate as well as metabolite concentrations in considerably shorter scan times.
Some limitations in this study should be noted. First, we acquired in vivo 31P-MRS data from the entire animal brain in order to boost SNR. Therefore, metabolite pool size ratios and reaction rate constants measured in this study represent an average value over all brain tissues. Second, our long TR experiment used TR= 9 sec to shorten experiment time; this is shorter than the TR= 16 sec required for full relaxation. However, at this condition, the magnetizations of PCr, ATP and Pi are almost fully recovered (i.e., PCr: 97 %, ATP: 98 %, Pi: 95 %), as seen in our simulation results. Thus, we believe that the comparison of metabolite pool size ratios and reaction rate constants between short and long TR experiments are reasonable for the validation of our approach.
In summary, we demonstrated the effects of chemical exchanges on T1 relaxation times as well as magnetization ratios under various experimental conditions in the chemical exchange network of PCr↔ATP↔Pi. We suggest a new strategy to simultaneously measure metabolite pool size ratios and kinetic constants of CK/ATPase reactions using 31P-MST spectroscopy. Our method enables correction for T1 relaxation and chemical exchange effects due to short TR. Using this method, we can shorten the experiment time while still obtaining complete measurements of both metabolite ratios and reaction kinetics with high sensitivity. This can facilitate future applications requiring high temporal and/or spatial resolution, and may provide important insights into biological mechanisms of impaired bioenergetics associated with physiological or pathological conditions.
Acknowledgments
The authors thank Drs. Yi Zhang, Xiao-Hong Zhu and Qiang Xiong for their assistance in the experiments and thoughtful discussion.
Contract Grant Support: This work was partially supported by National Institutes of Health (NIH) Grants MH092704 (FD), MH094594 (DO), MH105388 (DO), NS070839 (WC) and R24 MH106049 (WC); the Brain & Behavior Research Foundation (FD).
References
- 1.Harper DG, Jensen JE, Ravichandran C, et al. Tissue Type-Specific Bioenergetic Abnormalities in Adults with Major Depression. Neuropsychopharmacology. 2016 doi: 10.1038/npp.2016.180. [DOI] [PMC free article] [PubMed] [Google Scholar]
- 2.Khushu S, Rana P, Sekhri T, Sripathy G, Tripathi RP. Bio-energetic impairment in human calf muscle in thyroid disorders: a 31P MRS study. Magn Reson Imaging. 2010;28(5):683–689. doi: 10.1016/j.mri.2010.01.006. [DOI] [PubMed] [Google Scholar]
- 3.Koslik HJ, Hamilton G, Golomb BA. Mitochondrial dysfunction in Gulf War illness revealed by 31Phosphorus Magnetic Resonance Spectroscopy: a case-control study. PLoS One. 2014;9(3):e92887. doi: 10.1371/journal.pone.0092887. [DOI] [PMC free article] [PubMed] [Google Scholar]
- 4.Phillips AC, Sleigh A, McAllister CJ, et al. Defective mitochondrial function in vivo in skeletal muscle in adults with Down's syndrome: a 31P-MRS study. PLoS One. 2013;8(12):e84031. doi: 10.1371/journal.pone.0084031. [DOI] [PMC free article] [PubMed] [Google Scholar]
- 5.Yuksel C, Tegin C, O'Connor L, et al. Phosphorus magnetic resonance spectroscopy studies in schizophrenia. J Psychiatr Res. 2015;68:157–166. doi: 10.1016/j.jpsychires.2015.06.014. [DOI] [PubMed] [Google Scholar]
- 6.Schulz UG, Blamire AM, Davies P, Styles P, Rothwell PM. Normal cortical energy metabolism in migrainous stroke: A 31P-MR spectroscopy study. Stroke. 2009;40(12):3740–3744. doi: 10.1161/STROKEAHA.109.558163. [DOI] [PubMed] [Google Scholar]
- 7.Sikoglu EM, Jensen JE, Vitaliano G, et al. Bioenergetic measurements in children with bipolar disorder: a pilot 31P magnetic resonance spectroscopy study. PLoS One. 2013;8(1):e54536. doi: 10.1371/journal.pone.0054536. [DOI] [PMC free article] [PubMed] [Google Scholar]
- 8.Vidyasagar R, Kauppinen RA. 31P magnetic resonance spectroscopy study of the human visual cortex during stimulation in mild hypoxic hypoxia. Exp Brain Res. 2008;187(2):229–235. doi: 10.1007/s00221-008-1298-8. [DOI] [PubMed] [Google Scholar]
- 9.Chida K, Otani H, Saito H, et al. Feasibility of rapid-sequence 31P magnetic resonance spectroscopy in cardiac patients. Acta Radiol. 2005;46(4):386–390. doi: 10.1080/02841850510021283. [DOI] [PubMed] [Google Scholar]
- 10.Mazaev VV, Stukalova OV, Ternovoi SK, Chazova IE. [Evaluation of myocardial energy metabolism by 31 P-magnetic resonance spectroscopy in patients with hypertrophic cardiomyopathy versus healthy individuals] Vestn Rentgenol Radiol. 2012;(6):8–12. [PubMed] [Google Scholar]
- 11.Righi V, Constantinou C, Mintzopoulos D, et al. Mitochondria-targeted antioxidant promotes recovery of skeletal muscle mitochondrial function after burn trauma assessed by in vivo 31P nuclear magnetic resonance and electron paramagnetic resonance spectroscopy. FASEB J. 2013;27(6):2521–2530. doi: 10.1096/fj.12-220764. [DOI] [PMC free article] [PubMed] [Google Scholar]
- 12.Ernst RR, Anderson WA. Application of Fourier Transfrom Spectroscopy to Magnetic Resonance. Rev Sci Instrum. 1966;37:93–102. [Google Scholar]
- 13.Ha DH, Choi S, Oh JY, Yoon SK, Kang MJ, Kim KU. Application of 31P MR spectroscopy to the brain tumors. Korean J Radiol. 2013;14(3):477–486. doi: 10.3348/kjr.2013.14.3.477. [DOI] [PMC free article] [PubMed] [Google Scholar]
- 14.Maintz D, Heindel W, Kugel H, Jaeger R, Lackner KJ. Phosphorus-31 MR spectroscopy of normal adult human brain and brain tumours. NMR Biomed. 2002;15(1):18–27. doi: 10.1002/nbm.735. [DOI] [PubMed] [Google Scholar]
- 15.Schulz UG, Blamire AM, Corkill RG, Davies P, Styles P, Rothwell PM. Association between cortical metabolite levels and clinical manifestations of migrainous aura: an MR-spectroscopy study. Brain. 2007;130(Pt 12):3102–3110. doi: 10.1093/brain/awm165. [DOI] [PubMed] [Google Scholar]
- 16.Shi XF, Kondo DG, Sung YH, et al. Frontal lobe bioenergetic metabolism in depressed adolescents with bipolar disorder: a phosphorus-31 magnetic resonance spectroscopy study. Bipolar Disord. 2012;14(6):607–617. doi: 10.1111/j.1399-5618.2012.01040.x. [DOI] [PMC free article] [PubMed] [Google Scholar]
- 17.Vancova O, Baciak L, Kasparova S, et al. In vivo and in vitro assessment of brain bioenergetics in aging rats. J Cell Mol Med. 2010;14(11):2667–2674. doi: 10.1111/j.1582-4934.2009.00879.x. [DOI] [PMC free article] [PubMed] [Google Scholar]
- 18.Ugurbil K. Magnetization transfer measurements of creatine kinase and ATPase rates in intact hearts. Circulation. 1985;72(5 Pt 2):IV94–96. [PubMed] [Google Scholar]
- 19.Schär M, Gabr RE, El-Sharkawy AM, Steinberg A, Bottomley PA, Weiss RG. Two repetition time saturation transfer (TwiST) with spill-over correction to measure creatine kinase reaction rates in human hearts. J Cardiovasc Magn Reson. 17:70. doi: 10.1186/s12968-015-0175-4. [DOI] [PMC free article] [PubMed] [Google Scholar]
- 20.Bottomley PA, Ouwerkerk R, Lee RF, Weiss RG. Four-angle saturation transfer (FAST) method for measuring creatine kinase reaction rates in vivo. Magn Reson Med. 2002;47(5):850–863. doi: 10.1002/mrm.10130. [DOI] [PMC free article] [PubMed] [Google Scholar]
- 21.Xiong Q, Du F, Zhu X, et al. ATP production rate via creatine kinase or ATP synthase in vivo: a novel superfast magnetization saturation transfer method. Circ Res. 2011;108(6):653–663. doi: 10.1161/CIRCRESAHA.110.231456. [DOI] [PMC free article] [PubMed] [Google Scholar]
- 22.Spencer RG, Fishbein KW. Measurement of spin-lattice relaxation times and concentrations in systems with chemical exchange using the one-pulse sequence: breakdown of the Ernst model for partial saturation in nuclear magnetic resonance spectroscopy. J Magn Reson. 2000;142(1):120–135. doi: 10.1006/jmre.1999.1925. [DOI] [PubMed] [Google Scholar]
- 23.Du F, Zhu XH, Qiao H, Zhang X, Chen W. Efficient in vivo 31P magnetization transfer approach for noninvasively determining multiple kinetic parameters and metabolic fluxes of ATP metabolism in the human brain. Magn Reson Med. 2007;57(1):103–114. doi: 10.1002/mrm.21107. [DOI] [PubMed] [Google Scholar]
- 24.Lei H, Ugurbil K, Chen W. Measurement of unidirectional Pi to ATP flux in human visual cortex at 7 T by using in vivo 31P magnetic resonance spectroscopy. Proc Natl Acad Sci U S A. 2003;100(24):14409–14414. doi: 10.1073/pnas.2332656100. [DOI] [PMC free article] [PubMed] [Google Scholar]
- 25.Du F, Zhu XH, Zhang Y, et al. Tightly coupled brain activity and cerebral ATP metabolic rate. Proc Natl Acad Sci U S A. 2008;105(17):6409–6414. doi: 10.1073/pnas.0710766105. [DOI] [PMC free article] [PubMed] [Google Scholar]
- 26.de Graaf RA, Luo Y, Garwood M, Nicolay K. B1-insensitive, single-shot localization and water suppression. J Magn Reson B. 1996;113(1):35–45. doi: 10.1006/jmrb.1996.0152. [DOI] [PubMed] [Google Scholar]
- 27.Naressi A, Couturier C, Castang I, de Beer R, Graveron-Demilly D. Java-based graphical user interface for MRUI, a software package for quantitation of in vivo/medical magnetic resonance spectroscopy signals. Comput Biol Med. 2001;31(4):269–286. doi: 10.1016/s0010-4825(01)00006-3. [DOI] [PubMed] [Google Scholar]
- 28.Vanhamme L, van den Boogaart A, Van Huffel S. Improved method for accurate and efficient quantification of MRS data with use of prior knowledge. J Magn Reson. 1997;129(1):35–43. doi: 10.1006/jmre.1997.1244. [DOI] [PubMed] [Google Scholar]
- 29.Du F, Cooper A, Lukas SE, Cohen BM, Ongur D. Creatine kinase and ATP synthase reaction rates in human frontal lobe measured by 31P magnetization transfer spectroscopy at 4T. Magn Reson Imaging. 2013;31(1):102–108. doi: 10.1016/j.mri.2012.06.018. [DOI] [PMC free article] [PubMed] [Google Scholar]
- 30.Du F, Cooper AJ, Thida T, et al. In vivo evidence for cerebral bioenergetic abnormalities in schizophrenia measured using 31P magnetization transfer spectroscopy. JAMA Psychiatry. 2014;71(1):19–27. doi: 10.1001/jamapsychiatry.2013.2287. [DOI] [PMC free article] [PubMed] [Google Scholar]
- 31.Tkac I, Henry PG, Zacharoff L, et al. Homeostatic adaptations in brain energy metabolism in mouse models of Huntington disease. J Cereb Blood Flow Metab. 2012;32(11):1977–1988. doi: 10.1038/jcbfm.2012.104. [DOI] [PMC free article] [PubMed] [Google Scholar]
- 32.Du F, Zhang Y, Chen W. Relayed magnetization transfer from nuclear Overhauser effect and chemical exchange observed by in vivo 31P MRS in rat brain. Magn Reson Imaging. 2012;30(5):716–721. doi: 10.1016/j.mri.2012.01.005. [DOI] [PMC free article] [PubMed] [Google Scholar]
- 33.Rink K, Berger MC, Korzowski A, et al. Nuclear-Overhauser-enhanced MR imaging of 31P-containing metabolites: multipoint-Dixon vs. frequency-selective excitation. Magn Reson Imaging. 33(10):1281–1289. doi: 10.1016/j.mri.2015.07.017. [DOI] [PubMed] [Google Scholar]
- 34.Ren J, Yang B, Sherry AD, Malloy CR. Exchange kinetics by inversion transfer: integrated analysis of the phosphorus metabolite kinetic exchanges in resting human skeletal muscle at 7 T. Magn Reson Med. 73(4):1359–1369. doi: 10.1002/mrm.25256. [DOI] [PMC free article] [PubMed] [Google Scholar]
- 35.Tiret B, Brouillet E, Valette J. Evidence for a “metabolically inactive” inorganic phosphate pool in adenosine triphosphate synthase reaction using localized 31P saturation transfer magnetic resonance spectroscopy in the rat brain at 11.7 T. J Cereb Blood Flow Metab. 2016;36(9):1513–1518. doi: 10.1177/0271678X16657095. [DOI] [PMC free article] [PubMed] [Google Scholar]
- 36.Jeon MJ, Lee Y, Ahn S, et al. High resolution in vivo 31P-MRS of the liver: potential advantages in the assessment of non-alcoholic fatty liver disease. Acta Radiol. 2015;56(9):1051–1060. doi: 10.1177/0284185114550850. [DOI] [PubMed] [Google Scholar]
- 37.Valkovic L, Gajdosik M, Traussnigg S, et al. Application of localized (3)(1)P MRS saturation transfer at 7 T for measurement of ATP metabolism in the liver: reproducibility and initial clinical application in patients with non-alcoholic fatty liver disease. Eur Radiol. 2014;24(7):1602–1609. doi: 10.1007/s00330-014-3141-x. [DOI] [PubMed] [Google Scholar]
- 38.Holloway C, ten Hove M, Clarke K, Neubauer S. MR spectroscopy in heart failure. Front Biosci (Schol Ed) 2011;3:331–340. doi: 10.2741/s154. [DOI] [PubMed] [Google Scholar]
- 39.Murakami Y, Zhang J, Eijgelshoven MH, et al. Myocardial creatine kinase kinetics in hearts with postinfarction left ventricular remodeling. Am J Physiol. 1999;276(3 Pt 2):H892–900. doi: 10.1152/ajpheart.1999.276.3.H892. [DOI] [PubMed] [Google Scholar]
- 40.Zhu XH, Qiao H, Du F, et al. Quantitative imaging of energy expenditure in human brain. Neuroimage. 60(4):2107–2117. doi: 10.1016/j.neuroimage.2012.02.013. [DOI] [PMC free article] [PubMed] [Google Scholar]


