

Abstract
Background
The United Kingdom National External Quality Assessment Service (UK NEQAS) for Leucocyte Immunophenotyping Immune Monitoring Programme, provides external quality assessment (EQA) to non-U.S. laboratories affiliated with the NIH NIAID Division of AIDS (DAIDS) clinical trials networks. Selected laboratories are required to have oversight, performance monitoring and remediation undertaken by Immunology Quality Assessment (IQA) staff under the DAIDS contract. We examined whether laboratory accuracy improves with longer EQA participation and whether IQA remediation is effective.
Methods
Laboratory accuracy, defined by the measurement residuals from trial sample medians, was measured on four outcomes: both CD4+ absolute counts (cells/μL) and percentages; and CD8+ absolute counts (cells/μL) and percentages. Three laboratory categories were defined: IQA monitored (n=116), United Kingdom/non-DAIDS (n=137), and non-DAIDS/non-UK (n=1034). For absolute count outcomes, the groups were subdivided into single platform (SPT) and dual platform (DPT) users.
Results
Increasing EQA duration was found to be associated with increasing accuracy for all groups in all four lymphocyte subsets (p<0.0001). In the percentage outcomes, the typical IQA group laboratory improved faster than laboratories from the other two groups (p<0.005). No difference in the overall rate of improvement was found between groups for absolute count outcomes. However, in the DPT subgroup the IQA group ultimately showed greater homogeneity.
Conclusions
EQA participation coupled with effective laboratory monitoring and remedial action is strongly associated with improved laboratory accuracy, both incrementally and in the proportion of laboratories meeting suggested standards. Improvement in accuracy provides more reliable laboratory information facilitating more appropriate patient treatment decisions.
Keywords: flow cytometry, quality assessment, quality improvement, mixed effects model
INTRODUCTION
The role of flow cytometry in the measurement of absolute T lymphocytes subsets, particularly CD4+ T lymphocytes, in HIV infected individuals is well documented and is used to provide information with respect to therapeutic interventions [1–5]. In recent years, the use of single platform flow cytometry (SPT) has been the method of choice and uses either a volumetric approach, where the absolute count is calculated from a known volume of aspirated sample, or a bead based approach where a known number of beads are added to a known volume of sample and the ratio and subsequent absolute count calculated accordingly [6–7]. Because therapeutic interventions rely on accurate laboratory assessment of the absolute T lymphocyte subsets it is important to have in place both internal (internal quality control (IQC)) and external quality systems (proficiency testing (PT)/external quality assessment (EQA)) that can measure the quality of the results generated and facilitate the correct remedial action should problems be identified [8]. Indeed, the International Federation of Clinical Chemistry and Laboratory Medicine (IFCC) and the World Association of Societies of Pathology and Laboratory Medicine (WASP) issued, in 1999, the following policy statement “It is in the interests of patients, of society, and of governments that clinical laboratories operate at high standards of professional and technical competence…. and that their competence is verified through a process of inspection and comparison against appropriate standards.”
Quality measurement systems should be an integral part of a laboratory’s quality monitoring system and be designed in such a way as to quickly identify potential areas of concern with laboratory measurement processes to facilitate remedial action such as determining the root cause of an analytical error or identifying the cause of poor performance in EQA programs [9]. Indeed, the monitoring of laboratory performance, both within the laboratory itself and via EQA programs, is becoming an increasing requirement for laboratory accreditation [10]. Previous evidence has suggested that the longer a laboratory participates in an EQA program there is improvement in the laboratory [11–13]. However, what has never been documented is whether this improvement is linked to: (i) increased accuracy by the laboratory and/or (ii) if remedial action by the EQA program when a poor performing laboratory is identified leads to improvement.
UK NEQAS for Leucocyte Immunophenotyping (UK NEQAS LI), an ISO 17043 accredited EQA program [14], providing EQA to over 4,000 laboratories worldwide for flow cytometric immunophenotyping and molecular haemato-oncology, and the Immunology Quality Assessment (IQA) program, that provides EQA to NIH funded laboratories undertaking lymphocyte subset analysis in North America, have been collaborating with respect to determining if EQA participation improves accuracy of measurement in lymphocyte subset determination and if this accuracy improves the longer a laboratory participates in EQA. To assess the effect of EQA program participation we examined the UK NEQAS Immune Monitoring (UK NEQAS IM) program cohort that comprised of a total of 1287 laboratories over a period of 11 years from November 2003 to September 2014. This generated a total dataset of 234,612 results for CD4+ T lymphocyte absolute counts and percentages along with CD8+ T lymphocyte absolute counts and percentages obtained from 132 EQA samples. Within this cohort, three groups were identified and defined as: Division of AIDS (DAIDS) sponsored IQA monitored and remediated laboratories; laboratories based solely in the United Kingdom and; the rest of the world (i.e., laboratories that were not in either of these first two categories). The latter two groups, unlike the DAIDS cohort, received no active constant remediation or training unless they were identified as being “out of consensus”.
In the first group review of EQA performance reports, assay procedures, and QA and QC procedures were conducted to help identify errors and root causes of problems in testing. Details of corrective action investigations in the underperforming sites highlighted: training needs; technical staff assessment; instrument calibration and verification requirements; and inappropriate handling and testing of EQA samples. The collaboration with DAIDS network coordinators in follow up reviews of laboratory EQA performances provided added guidance and oversight for quality improvement.
MATERIALS AND METHODS
Study Design
This study is a historical analysis of eleven years of UK NEQAS IM program data between November 2003 and September 2014 where 132 stabilized samples (two samples were sent bimonthly) were distributed to 1,287 laboratories participating laboratories. Samples were prepared using a validated stabilization procedure previously described [7–8]. The four measurement types whose values that laboratories could report are: CD4+ T lymphocyte absolute counts (n=64,999) and percentages (n=59,626), and CD8+ T lymphocyte absolute counts (n=56,490) and percentages (n=53,497).
Using Laird-Ware [15–16] longitudinal mixed effects models, similar to those used in characterizing participation in the domestic IQA program over time and laboratory accuracy [11], we quantified the relationship between duration of laboratory participation in the UK NEQAS IM program and improved accuracy while controlling for (ruling out) possible other reasons for changes in accuracy. Variables included in the models to control for their possible effects and thus make the laboratories as directly comparable as possible include: Year that sample was measured; which controls for any cohort effects; Gating strategy; which controls for differences in and changes in gating strategy over time; equipment manufacturer and platform; which controls for both differences in and changes in over time. There are four separate models, one for each of the lymphocyte subsets of CD4+ T lymphocytes and CD8+ T lymphocytes absolute counts and percentage values. These models were fit on the log-log scale but results are presented on the original untransformed scale.
Parameters in Models
Response Variables
The response variables that are used to characterize accuracy are a function of the absolute residual for each measurand. The absolute residual is the absolute value of the difference between a laboratory’s measurement of a sample and the median value for that sample based on all laboratories that provided measurements. A decrease in the absolute residual corresponds to an increase in accuracy. Natural log (LN) transformations of the absolute residuals of CD4+ T lymphocytes and CD8+ T lymphocytes absolute counts and percentage values were applied as part of creating linear models on the log-log scale.
Primary Variables of Interest
The number of years of participation by a laboratory in the UK NEQAS IM program (Duration) is the focus of this study and it is LN transformed as part of the linearization process. Also of interest is laboratory group membership and defined as: DAIDS sponsored IQA monitored and remediated laboratories (n=116); United Kingdom laboratories (n=137); and those not in either of these two categories (n=1,034). The first group consisted of laboratories involved in DAIDS clinical trial network activity and that were identified by DAIDS as needing assistance in improving their accuracy and precision, usually due to resource limitations. The second group consisted of laboratories located in the United Kingdom only and the third group was all others that participate in the UK NEQAS IM program. Remedial intervention by the UK NEQAS IM program to the second group occurred when a laboratory had results that were significantly different from the consensus value. In this case the laboratory is suggested to undertake an investigation and the findings are reported to the UK NEQAS IM program. If needed, technical advice and/or analysis of data files is provided to the laboratory in an attempt to resolve any underlying issues. Remedial intervention by the UK NEQAS IM program to the third group was only provided upon laboratory request.
Other covariates included in models
There are five additional covariates that were included to control for possible effect upon laboratory accuracy: the LN of the sample median value; calendar year; platform (single or dual platform technology); gating strategy used; and flow cytometer manufacturer. As previously reported laboratory measurement variability is proportional to the average value of the sample [11,17]. Thus, we would expect that as the sample median increased, accuracy decreased. Given that the sample median values have varied over time the LN of the sample median is included to account and control for these fluctuations as they could be a source of any trend found in laboratory accuracy. Only one other study has quantified the relationship between sample median value and variability [11] and this study builds upon that finding. Additionally, this is an important variable to determine and control in order to rule out the possibility that changes in laboratory accuracy was simply a by-product of changes in sample composition.
Calendar year, as a categorical variable, is included to control for any cohort effect that may be present. Platform is included in the count models for several reasons. One reason is that different average values (means and medians) were found by platform and therefore we calculate the absolute residual separately for each platform type based upon the respective platform sample median values. Frequencies of the use of the different platforms for CD4+ T lymphocytes absolute counts by group are shown in Table 1. Another reason is that the within group variability has been shown to vary by platform [11]. Additionally, laboratories can switch from SPT to DPT or DPT to SPT over the course of the study and we want to control for the possibility that improvement over time was simply a by-product of platform switching. Note that this switching will be reflected in the number of laboratories reported in the tables as each laboratory/platform combination is treated as the unit of observation in the statistical models.
Table 1.
Frequencies of CD4 absolute count measurements by platform and group
| Group | DPT | SPT | Total |
|---|---|---|---|
| DAIDS – IQA monitored | 654 | 6538 | 7192 |
| United Kingdom | 1521 | 10863 | 12384 |
| Non IQA/UK | 7451 | 37972 | 45423 |
| Total | 9626 | 55373 | 64999 |
Gating strategy was defined as a five level categorical variable, the categories being: CD45/SSC; Forward Scatter/Side Scatter (FSC/SSC) [which included Panleukogating (PLG)]; Facscount (T-cell); Partec (volumetric); and other. Frequencies of the use of the different gating strategies for CD4+ T lymphocytes absolute counts by group are shown in Table 2. We control for this as laboratories may have switched strategies over time and we want to rule this out as the basis for laboratory improvement.
Table 2.
Frequencies of CD4 absolute count measurements by gating strategy and group
| Group | CD45/SSC | FSC/SSC | Facscount | Partec | Other | Total |
|---|---|---|---|---|---|---|
| DAIDS – IQA monitored | 4454 | 516 | 1942 | 0 | 280 | 7192 |
| United Kingdom | 11781 | 497 | 24 | 0 | 82 | 12384 |
| Non IQA/UK | 32191 | 3759 | 7651 | 1731 | 91 | 45423 |
| Total | 48426 | 4772 | 9617 | 1731 | 453 | 64999 |
Flow cytometer manufacturers were divided into three categories: BD Biosciences (BD) (n=43,215); Beckman Coulter (BC) (n=18,276); and other (n=3,508).
Random Effects
The random effects are at the laboratory level and include an intercept term and the LN of duration in the program (the slope term). This permits separate estimates for each laboratory’s trajectory in each of the groups. They also control for any unobserved heterogeneity among the laboratories.
Modeling Process
Mixed effects models were fit using a standard procedure [18–19]. The set of hypotheses being tested in this procedure are that the explanatory variables improve the model fit, that is the parameter value is non-zero. The null hypothesis in each case is that the explanatory variable doesn’t improve the model fit, i.e., the parameter value is zero. Briefly, this procedure consisted of first fitting the fixed effects using Maximum Likelihood based estimation and likelihood ratio tests for significance testing, while using a hypothesized random effects structure. Next the random effects terms and their covariance structure, given the fixed effects terms found to be significant in the first step, were fit using Restricted Maximum Likelihood. The fit of the covariance structure and random effects terms was evaluated using likelihood ratio tests when appropriate or the Bayesian Information Criterion. The utility and necessity of natural log transformations of the outcome variable and duration in the program was verified by use of graphical residual analysis comparing models with and without the transformations. These models are similar to those used in prior work [11] that examined the effect of calendar time in the domestic IQA program upon each individual laboratory’s absolute residuals. There are two refinements to those models in this work. The first, the utiiization of duration in the program rather than calendar time as the primary predictor. This was possible due to the large number of laboratories entering the program at different time points permitting separate estimations of the effect of duration and calendar year. The other involved the use of the log-log scale obviating the need of a polynomial of duration to characterize the response function.
RESULTS
Final Models
Count Models
For both count models the fixed effects of Group (CD4+ p<0.01; CD8+ p<0.05) and LN Duration (p<0.0001) were significant as were the Sample Median, Calendar Year, Platform, Gating Strategy, Manufacturer, and the interactions of Platform by LN Duration, Platform by Calendar Year, and Platform by Manufacturer (p<0.0001 all terms). The random intercept and slope terms were both significant with the unit of analysis being the laboratory nested within Group and a separate unstructured covariance matrix for each platform (p<0.0001 overall).
Percentage Models
For both percentage models the system of the fixed effects of Group, LN Duration, and their interaction was significant (p<0.005 overall) as were the Sample Median, Calendar Year, Gating Strategy, and Manufacturer (p<0.0001 all terms). The random intercept and slope terms were both significant with the subject being the laboratory and a separate unstructured covariance matrix for each Group (p<0.0001 overall).
Model Results
The following results are presented in terms of the ‘typical’ laboratory. The typical laboratory is a mathematical construct derived from the fixed effect terms in the models [19]. It can be thought of as a hypothetical laboratory that is in the middle of the actual laboratories with respect to the magnitude of the laboratory specific intercept and slope terms generated by the random effects.
For the absolute count outcomes the typical DPT laboratory started out with larger absolute residuals (roughly twice the magnitude of a typical SPT laboratory). This is evidenced by significantly different platform specific fixed effect intercept terms (p<0.0001 for each). For the percentage outcomes the typical IQA monitored laboratory started out with larger absolute residuals than the typical laboratories in the other two groups. This is evidenced by significantly different IQA monitored group specific fixed effect intercept terms (p<0.01 for each).
Increasing duration was found to be associated with increasing accuracy for all four lymphocyte subsets (p<0.0001 for each) for typical labs. This was evidenced by negative slopes (on the log-log scale) for the fixed effects of LN Duration upon the absolute residuals. For the absolute count outcomes there was a significant difference between platforms in rate of improvement, but not between groups, with the typical DPT laboratory improving faster than the typical SPT laboratory. In the percentage outcomes there was a significant difference between the typical laboratory in the IQA group and the typical laboratories in the other two groups (p<0.005 for each) with the typical IQA group laboratory improving faster than the typical laboratories from the other two groups. There was no difference between the typical laboratories in the non-IQA groups. Percentage change in the absolute residual after two years in program for percentage outcomes by group and platform is shown in Tables 3 and 4 respectively.
Table 3.
Percentage reduction in percentage absolute residuals after two years in the program
| Group | CD4 | CD8 |
|---|---|---|
| DAIDS – IQA monitored | 23.1% | 27.0% |
| United Kingdom | 10.4% | 11.8% |
| Non IQA/UK | 10.6% | 12.4% |
Table 4.
Percentage reduction in absolute count absolute residuals after two years in the program
| Platform | CD4 | CD8 |
|---|---|---|
| Single Platform Technology | 6.6% | 10.0% |
| Dual Platform Technology | 19.0% | 21.4% |
Typical laboratory trajectories for each outcome are shown in Figures 1 to 4. These trajectories are based upon a normal range sample median value, the base case of CD45/SSC gating and use of a BD flow cytometer. They are back transformed from the log-log scale that leads to so called ‘elastic’ models where a certain percentage change of time is associated with a particular percentage change in the absolute residual. Figure 5 shows the magnitude of the improvement over time for the clinically significant case of CD4+ T lymphocyte counts with a sample median value of 350 cells/μL.
Figure 1.

Model based trajectories of typical laboratory performance for CD4+ count residuals for samples with a median value of 1125 cells/μL
Figure 4.

Model based trajectories of typical laboratory performance for CD8+% residuals for samples with a median value of 25%
Figure 5.
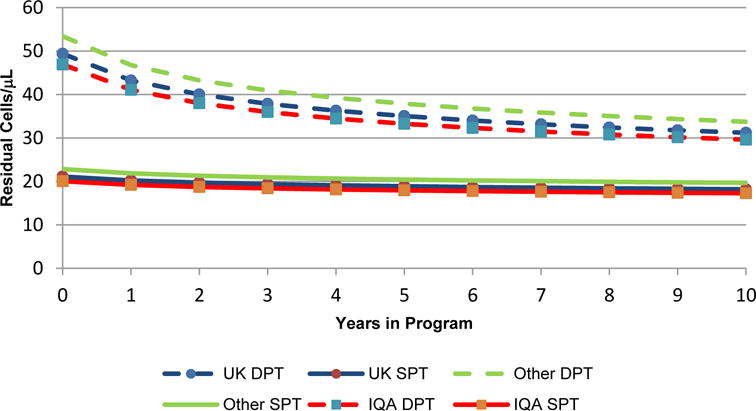
Model based trajectories of typical laboratory performance for CD4+ count residuals for samples with a median value of 350 cells/μL
Two things should be noted based on the random effects estimates (data not shown) when interpreting the figures for the count outcomes. The first is that the ‘within platform variability’ for the intercept terms has considerable overlap between platforms with greater variability for the DPT laboratories at the beginning of the study period. The other is the negative correlation (r = −0.80 to −0.85) between the intercept and slope random effects terms (as indicated by the random effects covariance terms) indicates that there is a tendency for laboratory performance to converge upon the typical laboratory’s performance by the end of the study period. That is, those laboratories that start with lower accuracy (larger intercept terms) improve more (steeper downward slopes) than others that start with greater accuracy within their platform group. Conversely, laboratories that start with greater accuracy (smaller intercept terms) improve less (shallower downward slope) than those that start with lower accuracy.
Table 5 illustrates these effects for the case of CD4+ T lymphocyte counts with a sample median value of 350 cells/μL. The values used to generate this table consist of the predicted values for each laboratory/platform combination using the base model levels of the other covariates. One laboratory’s values were excluded in the DPT/Other group due to it being an extreme outlier, most likely due to consistent data entry errors on the laboratory’s part. Note that the mean values for each group will not be the same as the typical value for the group due to the skewed distribution of the data on the original scale as well as the use of weighted least squares in the estimation process.
Table 5.
Predicted Absolute Residuals for CD4 counts at a sample level of 350 cells/μL
| Platform | Group | N Labs | Time | Mean | Standard Deviation (SD) | Minimum | Maximum |
|---|---|---|---|---|---|---|---|
| DPT | UK | 33 | Start | 51.4 | 25.2 | 17.8 | 110.1 |
| 10 Years | 35.6 | 19.5 | 11.9 | 95.8 | |||
| DPT | IQA | 27 | Start | 78.8 | 87.8 | 8.0 | 392.4 |
| 10 Years | 30.1 | 8.1 | 12.9 | 49.1 | |||
| DPT | Other | 200 | Start | 67.4 | 56.6 | 9.1 | 414.9 |
| 10 Years | 36.7 | 18.2 | 6.2 | 122.6 | |||
| SPT | UK | 128 | Start | 24.2 | 13.2 | 7.7 | 104.1 |
| 10 Years | 18.4 | 4.1 | 10.5 | 33.9 | |||
| SPT | IQA | 101 | Start | 22.3 | 13.4 | 8.2 | 116.4 |
| 10 Years | 17.6 | 4.3 | 10.0 | 32.6 | |||
| SPT | Other | 875 | Start | 25.9 | 17.4 | 4.5 | 252.9 |
| 10 Years | 20.4 | 6.1 | 7.8 | 79.1 |
DISCUSSION
Previous work suggests there is a beneficial effect of EQA participation on laboratory accuracy but little has been done to quantify its effect or control for possible alternate explanations for laboratory improvements [7–14, 17]. In this work, after controlling for multiple covariates, we found that EQA participation coupled with effective laboratory monitoring and remedial action is strongly associated with improved laboratory accuracy. We also quantified the relationship between accuracy and duration of EQA participation for the UKNEQAS program both with and without IQA remediation. Improvement in accuracy provides more reliable information to clinical trials facilitating improved patient treatment decisions.
The use of in-vitro diagnostics for diagnosis of disease or disorders, classification, treatment and subsequent monitoring to assess treatment effectiveness are key aspects in health care management. All of these require high levels of standardization and quality assessment to guarantee “the right result on the right patient at the right time”. This is essential for clinical decisions and to improve global cost-effective health outcome benefits. Laboratory Medicine is a science-based discipline that is at the forefront of rapid technological and as such the innovative changes that occur present challenges for method validation, training, and implementation of quality procedures such as quality assessment and guideline compliance. Thus, it is vitally important that accuracy and precision of laboratory parameters are closely monitored and corrective/remedial action is specifically targeted. Participation in EQA programs and the identification of laboratories that are not performing well is a vital part of the whole quality monitoring process for any given laboratory.
We found that for the percentage outcomes, the rate of increasing accuracy was greater for the typical lab in the IQA program in comparison to the other two groups (Figures 3 and 4). Furthermore, the within group variance, representing how wide the spread was between labs within a group, improved significantly more for the IQA laboratories using DPT (Table 5). Additionally, we have shown that with all outcomes and all groups the typical laboratory showed increasing accuracy as duration in the EQA program increased. Given that this study has controlled all other covariates within the modeling it would be reasonable to assume that the increased accuracy over time is as a result of technician learning over the same period.
Figure 3.

Model based trajectories of typical laboratory performance for CD4+% residuals for samples with a median value of 50%
The most probable explanation for better initial absolute count outcomes for IQA than percent outcomes is that the absolute count outcomes included a number of FACSCount instruments (roughly 25% of the IQA group count measurements came from FACSCounts) where the laboratories did not report percentage outcomes. FACSCount instruments did well on the absolute count outcomes and thus would have made the typical DAIDS laboratory for absolute counts better than the typical DAIDS laboratory for percentages.
It has been suggested that in order to have reliable clinical decisions that the absolute residual for CD4+ T lymphocyte counts with a sample value of 350 cells/μL be no greater than 50 cells/μL [20]. Figure 5 and table 5 show several interesting patterns relating to this cut-off; the first is that for laboratories using DPT the typical value at the start of EQA is lower than the average predicted value while there is no difference for the SPT using laboratories. Additionally there is no difference between the typical laboratory and the mean predicated value at ten years. This is most likely a by-product of the greater variability of DPT using laboratories at the beginning of EQA and would suggest that the most useful value for characterizing the laboratories as a group is that of the typical laboratory. However, it does illustrate the considerable difference in within group variability. Focusing on the results shown in Table 5, looking over time at the within group variability (and at the maximum values for the laboratories) we can see that the IQA group shows greater improvement, particularly by the poorly performing labs. This greater improvement brings them into line with the suggested 50 cells/μL and supports overall greater within group homogeneity.
One thing that should be pointed out with respect to the use of the natural log transform for both the response variables and the duration of program participation variable is that this implies a non-linear relationship between the two on the untransformed scale. Another modeling approach that could have been used would be to fit some non-linear mixed model to the data. The linear model with the log transformations was chosen however for several reasons. The primary reason is that the form of non-linear models is usually theory based and there is currently no theory for the nature of the distribution of the absolute residuals in measurements involving flow cytometry. Additionally, the linear mixed model assumptions of Gaussian distributed model regression residuals and their homogeneity of variance over the range of the predictor variable, in our case duration of program participation, were found to be met when the log transformations were applied but not otherwise.
In summary, the work presented here that has undertaken a historical analysis of lymphocyte subset related EQA data collected for 1,287 sites over an eleven year period. It supports the overall value of testing site participation in EQA activities that are also coupled with quality oversight and technical remediation to provide long term quality improvement of associated laboratory activities.
Figure 2.

Model based trajectories of typical laboratory performance for CD8+ count residuals for samples with a median value of 650 cells/μL
Acknowledgments
This project has been funded with Federal funds from the National Institute of Allergy and Infectious Diseases, National Institutes of Health, Department of Health and Human Services, under Contract No. HHSN272201400014C. We wish to thank all those involved in the IQA and UK NEQAS IM programs: including Sylvia Hood at the IQA and Matthew Fletcher at the UK NEQAS IM program. The authors declare no conflicts of interest.
LITURATURE CITED
- 1.Phillips A, Sabin CA, Elford J, Bofill M, Janossy G, Lee CA. Use of CD4 lymphocyte count to predict long-term survival free of AIDS after HIV infection. BMJ. 1994;309:309–13. doi: 10.1136/bmj.309.6950.309. [DOI] [PMC free article] [PubMed] [Google Scholar]
- 2.Phillips AN, Lundgren JD. The CD4 lymphocyte count and risk of clinical progression. Curr Opin HIV AIDS. 2006;1:43–9. doi: 10.1097/01.COH.0000194106.12816.b1. [DOI] [PubMed] [Google Scholar]
- 3.Post FA, Wood R, Maartens G. CD4 and total lymphocyte counts as predictors of HIV disease progression. QJM. 1996;89:505–8. doi: 10.1093/qjmed/89.7.505. [DOI] [PubMed] [Google Scholar]
- 4.Panel on Antiretroviral Guidelines for Adults and Adolescents. Guidelines for the use of antiretroviral agents in HIV-1-infected adults and adolescents. Department of Health and Human Services; 2015. Available from: http://aidsinfo.nih.gov/ContentFiles/AdultandAdolescentGL.pdf. [Google Scholar]
- 5.Churchill D, Waters L, Ahmed N, Angus B, Boffito M, Bower M, et al. BHIVA guidelines for the treatment of HIV-1- positive adults with antiretroviral therapy. 2015:1–114. doi: 10.1111/hiv.12426. Available from: http://www.bhiva.org/documents/Guidelines/Treatment/2015/2015-treatment-guidelines.pdf. [DOI] [PubMed]
- 6.Barnett D, Granger V, Whitby L, Storie I, Reilly JT. Absolute CD4+ T lymphocyte and CD34+ stem cell counts by single-platform flow cytometry: the way forward. Br J Haematol. 1999;106:1059–62. doi: 10.1046/j.1365-2141.1999.01632.x. [DOI] [PubMed] [Google Scholar]
- 7.Whitby L, Granger V, Storie I, Goodfellow K, Sawle A, Reilly JT, Barnett D. Quality control of CD4+ T lymphocyte enumeration: results from the last 9 years of the United Kingdom National External Quality Assessment Scheme for Immune Monitoring (1993–2001) Cytometry. 2002;50:102–10. doi: 10.1002/cyto.10094. [DOI] [PubMed] [Google Scholar]
- 8.Whitby L, Whitby A, Fletcher M, Helbert M, Reilly JT, Barnett D. Comparison of methodological data measurement limits in CD4+ T lymphocyte flow cytometric enumeration and their clinical impact on HIV management. Cytometry Part B, Clinical Cytometry. 2013;84:248–54. doi: 10.1002/cyto.b.21094. [DOI] [PubMed] [Google Scholar]
- 9.Miller WG. The role of proficiency testing in achieving standardization and harmonization between laboratories. Clin Biochem. The Canadian Society of Clinical Chemists. 2009;42:232–5. doi: 10.1016/j.clinbiochem.2008.09.004. [DOI] [PubMed] [Google Scholar]
- 10.BS EN ISO 15189:2012 Medical laboratories. Requirements for quality and competence. 2012 [Google Scholar]
- 11.Bainbridge J, Wilkening CL, Rountree W, Louzao R, Wong J, Perza N, Garcia A, Denny TN. The Immunology Quality Assessment Proficiency Testing Program for CD3+4+ and CD3+8+ lymphocyte subsets: A ten year review via longitudinal mixed effects modeling. Journal of Immunological Methods. 2014;409:82–90. doi: 10.1016/j.jim.2014.05.017. [DOI] [PMC free article] [PubMed] [Google Scholar]
- 12.Glencross DK, Aggett HM, Stevens WS, Mandy F. African regional external quality assessment for CD4 T-cell enumeration: development, outcomes, and performance of laboratories. Cytometry Part B, Clinical Cytometry. 2008;74:S69–79. doi: 10.1002/cyto.b.20397. [DOI] [PubMed] [Google Scholar]
- 13.Levering WHBM, van Wieringen WN, Kraan J, van Beers WAM, Sintnicolaas K, van Rhenen DJ, Gratama JW. Flow cytometric lymphocyte subset enumeration: 10 years of external quality assessment in the Benelux countries. Cytometry Part B, Clinical Cytometry. 2008;74B:79–90. doi: 10.1002/cyto.b.20370. [DOI] [PubMed] [Google Scholar]
- 14.Reilly J, Barnett D. UK NEQAS for leucocyte immunophenotyping: the first 10 years. Journal of Clinical Pathology. 2001;54:508–511. doi: 10.1136/jcp.54.7.508. [DOI] [PMC free article] [PubMed] [Google Scholar]
- 15.Laird NM, Ware JH. Random-effects models for longitudinal data. Biometrics. 1982;38:963–974. [PubMed] [Google Scholar]
- 16.Verbeke G, Molenbergh G, Rizopoulos D. Random Effects Models for Longitudinal Data. In: van Montfort K, Oud JHL, Satorra A, editors. Longitudinal Research with Latent Variables. Berlin Heidelberg: Springer-Verlag; 2010. pp. 37–96. [Google Scholar]
- 17.Kunkl A, Risso D, Terranova MP, Girotto M, Brando B, Mortara L, Lantieri PB. Grading of laboratories on CD4+ T lymphocyte evaluations based on acceptable data boundaries defined by the measurement error. Cytometry. 2002;50:117–26. doi: 10.1002/cyto.10069. [DOI] [PubMed] [Google Scholar]
- 18.Cheng J, Edwards LJ, Maldonado-Molina MM, Komro KA, Muller KE. Real longitudinal data analysis for real people: building a good enough mixed model. Statistics in medicine. 2010;29(4):504–520. doi: 10.1002/sim.3775. [DOI] [PMC free article] [PubMed] [Google Scholar]
- 19.Fitzmaurice GM, Laird NM, Ware JH. Applied longitudinal analysis. Hoboken, NJ: Wiley-Interscience; 2004. [Google Scholar]
- 20.Daneau G, Buyze J, Wade D, Diaw PA, Dieye TN, Sopheak T, Florence E, Lynen L, Kestens L. CD4 Results with a Bias Larger than Hundred Cells Per Microliter Can Have a Significant Impact on the Clinical Decision During Treatment Initiation of HIV Patients. Cytometry Part B, Clinical Cytometry. 2016;00B:000–000. doi: 10.1002/cyto.b.21366. http://doi.org/10.1002/cyto.b.21366. [DOI] [PubMed] [Google Scholar]