

Abstract
Obese dogs seem to have a different gut microbiome (GM) composition compared to lean dogs, and in humans, GM composition may negatively impact the ability to lose weight in some individuals. The purpose of this study was to investigate the interaction between exercise, weight‐loss and the composition of GM in dogs. Eighteen obese pet dogs were recruited for a 12‐week weight‐loss intervention. All dogs were fed restrictively with a commercial high‐protein/high‐fibre dry diet, and eight of these dogs were enrolled in an exercise program in addition to the diet intervention. Faecal samples were collected and the dogs were weighed at week 0, week 6 and week 12. GM composition was determined using MiSeq‐based tag‐encoded 16S rRNA gene high‐throughput amplicon sequencing, and concentrations of short chain fatty acids (SCFA) by gas‐liquid chromatography. Total weight loss, food allowance and GM were not changed by exercise inclusion. However, Megamonas abundance negatively correlated with weight loss rate and Ruminococcaceae relative abundance was lower at 12 weeks in dogs with a faster weight loss rate (≥1% per week) compared with slower weight loss rate (<1% per week) independent of exercise. Acetic and propionic acid concentrations decreased in the dogs with a faster weight loss rate. Members of Megamonas and Ruminococcaceae produce acetic and propionic acids and we therefore interpret that having a GM that favour SCFA production may negatively affect weight loss rate in dogs. Weight loss rate in dogs may be related to the composition of the GM and its production of metabolites.
Keywords: Canine, faecal, intestinal, microbiome, overweight, obesity, short chain fatty acids
Introduction
Obesity is considered the most common companion animal nutritional imbalance in developed countries (German 2006). Studies have shown that obesity in dogs leads to a shortened life span (Kealy et al. 2002), decreased quality of life as well as an increased risk of diseases such as degenerative joint diseases, neoplasia and respiratory dysfunction (Alenza et al. 2000; Kealy et al. 2002; Bach et al. 2007). Treatment of obesity is in theory a simple combination of restricting intake of calories and, if possible, increasing energy expenditure. However, in reality weight loss trials, even when successful, rarely sustain long‐term effects (Fildes et al. 2015; German et al. 2015). Research in the field of obesity has uncovered a complicated network of factors contributing to weight gain and resistance to weight loss, including diet, genes, and gut microbiota (GM). Furthermore, the swift increase in the occurrence of obesity during recent decades makes a single/simple genetic cause highly unlikely, and instead favours the impact of combinations of environmental factors (Ajslev et al. 2015). Recent studies in animal models and humans have underlined the importance of the GM composition in both influencing the amount of energy extracted from the diet as well as affecting the risk of obesity and development of metabolic disease (Ley et al. 2006; Handl et al. 2013; Pedersen et al. 2016).
In humans, several studies have investigated the GM compositional differences between obese and lean individuals and the effect of weight loss (Ley et al. 2006; Duncan et al. 2008; Santacruz et al. 2009; Cotillard et al. 2013). However, it remains difficult to separate the effects of weight loss from energy restriction and altered macronutrient composition. Ley et al. (2006) found the GM differences between obese and lean humans to be reversible with weight loss, and the identified changes occurring as a part of weight loss were not related to the two different diets used. Subsequent studies failed to repeat this result, and instead found the GM changes seen with weight loss in obese humans to be related to the composition of the weight loss diets (Duncan et al. 2008; Santacruz et al. 2009). A possible explanation for these inconsistencies is that different subpopulations of obese individuals may respond differently to a specific weight loss diet (Santacruz et al. 2009; Cotillard et al. 2013).
In addition to dietary means for achieving weight loss, exercise supports energy expenditure and influences the metabolism in a multitude of ways (Lavie et al. 2015). Evidence from animal models suggests that exercise may influence the GM composition (Queipo‐Ortuño et al. 2013). This may also be true in humans, though data separating the influence of diet from exercise have not yet been published (Clarke et al. 2014). Obese and overweight dogs also seem to differ in their GM composition compared to lean dogs (Handl et al. 2013). However, to the best of our knowledge the GM composition of obese pet dogs during weight loss has not previously been studied.
This study was conducted to investigate if the GM composition relates to how effectively dogs lose weight during a weight loss intervention, and if exercise can influence the GM composition during weight loss in overweight dogs. Short chain fatty acids analysis was performed to elucidate interactions between the GM and weight loss rate. The faecal samples were obtained from dogs participating in a 12‐week weight loss intervention with or without an exercise program. Results from this intervention have previously been published regarding effects on body composition, immunometabolic parameters, gene expression and energy expenditure (Larsson et al. 2014; Herrera Uribe et al. 2016; Vitger et al. 2016, 2017).
Methods and material
Dogs and collection of samples
Overweight dogs (n = 18 included in this study) were recruited through advertisements, pamphlets at the University Hospital for Companion Animals, University of Copenhagen, and by referrals from local primary care practices. Overweight, but otherwise healthy medium‐ to large‐breed adult dogs (Body Condition Score ≥ 6, on a scale from 1 to 9 (Laflamme 1997)) with a sedentary life style (defined as no regular high intensity activity, and only short and/or low intensity daily walks), were included in a prospective non‐randomized 12‐week weight loss trial. Dogs were considered healthy when they had no recent history of severe illness, no abnormalities identified on physical examination and a complete blood count (CBC) and biochemistry within the laboratory reference interval. None of the included dogs had previously been enrolled in a weight loss intervention. The study was approved by the Administrative and Ethical Committee at the Department of Veterinary Clinical and Animal Sciences, University of Copenhagen, as well as by the Danish Animal Experimentation Inspectorate (approval No. 2011_561‐80). For the entire duration of the study, all dogs were fed the same commercial low‐fat, high‐protein/high fibre, dry diet (Royal Canin Satiety Support, protein 44.5% of ME, fat 29.7% of ME, carbohydrate 25.8% of ME, crude fibre 17.9% of DM, total dietary fibre 31.4% of DM, Royal Canin, Aimargues, France). Following inclusion, the dogs were allocated to either a diet and exercise (FD) group, or to a diet‐only (DO) group solely by owner preference, as previously described (Vitger et al. 2016). Prior to study start, dogs were weighed and had their BCS determined. Physical examination, blood and urine samples were collected and analysed to verify that the dogs were healthy. Dual‐energy X‐ray absorptiometry (DEXA), scans as well as fat and muscle biopsy collections were performed at week 0, 6 and 12, and these results have been published previously (Herrera Uribe et al. 2016; Vitger et al. 2016). The amount of diet to be fed daily to each dog was calculated, by the use of a purpose‐designed software program (Slimfit, Royal Canin, Aimargues, France). Dogs were fed 55% of the daily estimated maintenance energy requirement (MER) (according to the calculation, 552.3 kJ/kg target weight0.73[251 kJ/lb target weight0.73]) to achieve a weight loss rate of approximately 1.5% per week. At commencement of the program and at fortnightly visits to the hospital, all dogs were weighed and adherence to diet and exercise routines were discussed with the owners. In cases of non‐compliance, – primarily the dog scavenging for food, – measures to minimize the problem were discussed with the owner. If needed, adjustments in the amount fed were made to achieve the targeted weight loss rate. Dogs that received local or systemic antibiotics during the intervention were excluded. Dogs participating in the exercise program would come to the hospital for training three times a week. Training was supervised and consisted of 30 min in the water treadmill and 30 min on the land‐based treadmill. Moreover, the owners of the dogs in the fitness group were encouraged to increase their dog's home exercise by half an hour daily.
At inclusion, prior to introduction of feeding with the weight loss diet, and subsequently after 6 and 12 weeks faecal samples were collected per rectum, transferred to a tube, frozen and kept at −80°C until further analyses.
DNA extraction
The faecal samples were thawed on ice and approximately 200 mg of sample were weighted into a FastPrep tube (QBiogene, Carlsbad, CA, USA) for extracting cellular DNA with QIAamp DNA Stool Mini Kit (Qiagen, Hilden, Germany) according to the manufacturer's standard protocol, but modified with an initial bead‐beating step (FastPrep, FP120). DNA concentration was measured using Nanodrop (ND‐100, NanoDrop Technologies, Wilmington, DE, USA). Extracted DNA was stored at −20°C until further analysis.
PCR amplification, Illumina sequencing
The faecal prokaryotic microbiota composition were determined using tag‐encoded 16S rRNA gene MiSeq‐based (Illumina, San Diego, CA, USA) high throughput sequencing as previously reported (Pyndt Jørgensen et al. 2014). In short, the V3‐V4 region of the 16S rRNA gene was amplified by PCR using primers compatible with the Nextera Index Kit (Illumina). Amplified fragments with adapters and tags were purified, and quantified prior to Illumina sequencing.
Short chain fatty acids analysis
Concentrations of the short‐chain fatty acids (SCFAs) acetic, propionic, butyric, isobutyric, valeric and isovaleric acid, and lactic acid in faecal samples were quantified by gas chromatography as previously described (Canibe et al. 2007). Faecal short chain fatty acid content was analysed for both week 0 and 6 samples for 9 of 12 dogs where enough faecal matter was available post sequencing. Additionally, enough faecal matter was available for analysis of week 0 samples from two dogs and a 6‐week sample from one additional dog. Since changes in feeding amount was adjusted in several dogs between week 6 and 12, the 12 week samples were not included in the SCFA analysis to minimize possible interaction between the feeding ration and weight loss.
Bioinformatics and Statistical analysis
After the conclusion of the intervention, three dogs (2 FD and 1 DO) were excluded from faecal analyses as they had received antibiotic treatment during the intervention. Additionally, two samples were excluded from the bioinformatics and statistical analysis of the GM composition due to low DNA concentration (1 week 6 and 1 week 12 sample from two different dogs in the DO group), and three samples due to number of reads being <10 000 reads per sample (1 week 0, and 1 week 6, sample and 1 week 12 sample from one dog in the FD group). In total 11 dogs (six dogs, 15 samples in the FD group and five dogs, 16 samples in the DO groups) were included in the bioinformatic and statistical analysis of the GM composition (see Fig. S1). The sequencing results were analysed using the Quantitative Insights Into Microbial Ecology (QIIME) pipeline (Caporaso et al. 2010). Principal Coordinate Analysis (PCoA) plots were generated with the Jackknifed Beta Diversity workflow (see Fig. S2), and analysis of similarities (ANOSIM) was used to evaluate group differences between groups using weighted and unweighted uniFrac distance metrics.
Alpha diversity expressed as an observed species (sequence similarity 97% OTUs) value was computed for rarefied OTU tables (33 000 reads per sample) using the alpha rarefaction workflow. Testing on the differences in alpha diversity was conducted using t‐test employing the non‐parametric (Monte Carlo) method (999 permutations) i.e. implemented in the compare alpha diversity workflow. Since no significant changes in the GM composition were found when comparing the FD and DO groups, the two groups were merged for the remainder of the analysis. The 2014 AAHA Weight Management Guidelines for Dogs and Cats describes a weight loss rate of 1–2% as desirable (Brooks et al. 2014). To explore if the weight loss rate during the intervention related to GM composition, the dogs were divided into groups based on having a fast weight loss (≥1% of body weight (BW) per week) or a slow weight loss (<1% of BW per week). The false discovery rate (FDR), was calculated to illustrate the expected proportion of Type I errors (represented as q‐values in Tables 1 and 2). The GM composition changes that were significant over time (week 0, 6 and 12) on a genus level, when data from both groups (FD and DO) were pooled together, were then tested for correlation with weight lost, using Spearman correlation. In addition to the PCoA, a Principal Component Analysis (PCA) was conducted in MATLAB 2015b of the rarefied relative abundance OTUs (genus level) data and SCFA data (see Fig. S3). This was done to visualize possible clustering patterns of the fast weight loss compared to the slow weight loss group relating to the GM as well as the SCFA data. The first four components were plotted against each other, as they together accounted for >90% of the variation in the data. An ANOVA comparing the SCFA levels at week 0 and week 6 was performed in R Studio 2015. The ANOVA used to compare the faecal SCFA concentrations included age as a factor, as age has previously been found to influence SCFA concentration in dogs (Gomes et al. 2011).
Table 1.
The three most significant differences in gut microbiota (GM), as relative abundance OTUs at genus level, comparing the three time points week 0–6, week, 0–12 and week 6–12, in dogs (n = 11) during a 12 week weight loss trial (data was analysed using ANOVA, P < 0.05, in bold, was considered a significant change)
| Bacterial genusa | P‐value | False discovery rate q‐value | ||
|---|---|---|---|---|
| GM change | Week 0–6 | Sutterella spp. | 0.01 | 0.56 |
| Fusobacterium spp. | 0.02 | 0.42 | ||
| Megamonas spp. | 0.03 | 0.44 | ||
| Week 0–12 | Megamonas spp. | 0.01 | 0.48 | |
| Fusobacterium spp. | 0.02 | 0.36 | ||
| Sutterella spp. | 0.04 | 0.48 | ||
| Week 6–12 | Parabacteroides spp. | 0.14 | 5.46 | |
| Faecalibacterium spp. | 0.16 | 3.20 | ||
| Unknown (Erysipelotrichaceae spp.) | 0.20 | 2.72 |
if unknown genus, (family).
Table 2.
The three most significant differences comparing the gut microbiota (GM), as relative abundance OTUs at genus level, between fast weight loss rate (≥1% of body weight per week) and slow weight loss rate (<1.0% bodyweight per week) dogs at three time points, week 0, week 6 and week 12, from dogs (n = 11) during a 12 week weight loss trial (data was analysed using ANOVA, P < 0.05, in bold, was considered a significant change)
| Bacterial genusa | P‐value | False discovery rate q‐value | ||
|---|---|---|---|---|
| GM | Week 0 | Streptococcus spp. | 0.14 | 4.76 |
| Catenibacterium spp. | 0.16 | 2.71 | ||
| Unknown (Ruminococcaceae spp.) | 0.19 | 2.14 | ||
| Week 6 | Helicobacter spp. | 0.06 | 2.49 | |
| Campylobacter spp. | 0.07 | 1.36 | ||
| Unknown (Clostridiaceae spp.) | 0.09 | 1.32 | ||
| Week 12 | Unknown (Ruminococcaceae spp.) | 0.02 | 0.92 |
if unknown genus, (family).
Results
Three dogs did not complete the intervention, one of these dogs had a mammary tumour and was reluctant to exercise, and one dog had signs of lumbar pain and one dog arthritis. Three additional dogs were excluded due to having received local or systemic antibiotics during the intervention. All dogs (n = 12) lost weight during the intervention (5.55% [2.9–11.3] at 6 weeks and additionally 6.75% [1.3–12.2] at 12 weeks of initial BW). No adjustments in the amount fed were made between inclusion and 6 weeks in any of the dogs while adjustments to the amount of diet being fed was made in seven of the 10 dogs (reduced amount in six and increased amount in one dog) between week 6 and 12. Of the 11 dogs, where DNA quality and the number of reads per sample were adequate, for inclusion in the bioinformatics and statistical analysis of the GM data, five were Labrador retrievers, two were Australian Shepherds and two were mixed breeds, while the remaining dogs were a Bernese Mountain dog, and a Basset Griffon Vendeen. Characteristics of the 12 dogs including age, sex, neutering status and weight loss rate are summarized in Table 3. Prior to inclusion, the main diet of 10 dogs was various commercial dry diets, one dog was fed a raw food diet prior to inclusion, and another was fed a mix of commercial dry diet and table scraps.
Table 3.
Group (exercise and diet (FD) or diet only (DO)), breed, age, sex and neutering (female entire (FE), female neutered (FN), male entire (ME) and male neutered (MN)), body composition and weight loss rate, for dogs (n = 12) undergoing a 12‐week weight loss intervention including groups
| Group | Breed | Age, years | Sex and neutering | BCS 1–9 week 0/week 12 | BF% week 0/week 12 | WL rate week 0–6 (%/week) | WL rate week 6–12 (%/week) |
|---|---|---|---|---|---|---|---|
| FD | Labrador retriever | 8.2 | FE | 7/6 | 51/43 | 6 | 7 |
| FD | Labrador retriever | 7.0 | FN | 7/5 | 46/37 | 3.6 | 9.2 |
| DO | Basset Griffon Vendeen | 6.7 | FE | 7/7 | 61/57 | 5.1 | 7 |
| FD | Berner Sennen | 5.6 | FN | 8/7 | 67/53 | 8.5 | 7.5 |
| DO | Labrador retriever | 6.2 | MN | 8/8 | 55/51 | 3.6 | 4.6 |
| FD | Australian Shepherd | 10.0 | FN | 7/6 | 53/45 | 4.9 | 12.2 |
| FD | Australian Shepherd | 3.0 | FN | 7/7 | 53/46 | 2.9 | 9.5 |
| DO | Nova Scotia Duck Tolling Retriever | 8.9 | FN | 8/7 | 52/43 | 10.2 | 6 |
| DO | Mixed breed | 5.5 | FN | 8/6 | 50/41 | 11.3 | 6.5 |
| DO | Labrador retriever | 3.6 | ME | 6/5 | 35/30 | 9.1 | 1.3 |
| DO | Labrador retriever | 8.5 | MN | 7/6 | 51/45 | 4.2 | 5.7 |
| FD | Mixed breed | 6.9 | FN | 7/6 | 55/43 | 6.9 | 6.1 |
Body Condition Score (BCS) on a scale from 1 to 9, and body fat percentage (BF%) from week 0 and 12, previously included in Vitger et al. (2016). Weekly weight loss in percentage of body weight from week 0 to week 6 (WL rate week 0–6), weekly weight loss in percentage of body weight from week 6 to end of trial (WL rate week 6–12).
Six of the 12 dogs failed to reach the expected weight loss (1% of BW per week) at 6 weeks and the amount of diet was therefore reduced at that point. The daily feeding level was reduced for six of 12 dogs at 6 weeks of intervention while one of the 12 dogs reached ideal weight at week 6, and for this dog the amount of diet fed was adjusted to maintenance level for week 7–12. There were no obvious differences in the distribution of breed, age, sex and neutering status between the dogs that had a slow weight loss rate (<1% of BW per week), with the dogs that had a fast weight loss rate (≥1% of BW per week) (for details see Table S1).
In general, the GM of the dogs was dominated by genera Fusobacterium (~20–50%) and Bacteroides (~15–35%). A significant difference was seen in the three genera Suterella, Fusobacterium and Megamonas between week 0 and week 6 as well as between week 0 and week 12, when analysing the results from both groups pooled together using an ANOVA (P = 0.01, P = 0.02 and P = 0.03, respectively, Table 1). However, none of the false discovery rate (FDR) q‐values are below 0.05. No significant change was seen between 6 and 12 weeks. To further elucidate if GM differences were related to weight loss rate, the dogs were divided according to weekly weight loss percentage. The dogs having lost ≥1% bodyweight (BW) per week were classified as having a fast weight loss rate, and the dogs having lost <1% bodyweight (BW) per week classified as having a slow weight loss rate. A decrease in Megamonas genus correlated (R 2 = 0.68, P = 0.06) with fast weight loss rate (≥1% per week) between week 0 and 6 (Fig. 1.). No correlation was found between the weight loss rate and the changes in Suterella (R = 0.10) and Fusobacterium (R = 0.24) genera.
Figure 1.
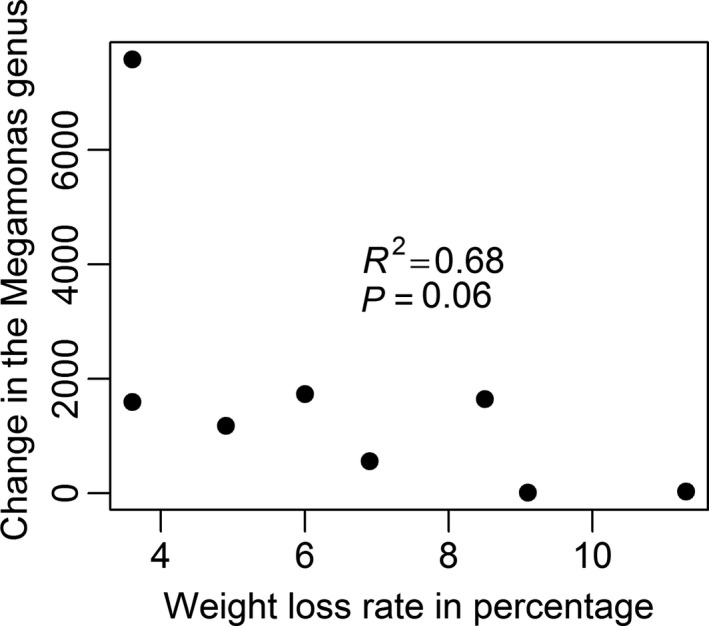
Correlation between the change in the Megamonas genus between week 0 and week 6 (y‐axis) and the weight loss rate in percentage per week (x‐axis), in dogs (n = 8) undergoing a 12 week weight loss trial.
The proportion of an unknown genus of the family Ruminococcaceae was significantly lower in the dogs with a fast weight loss rate (P = 0.02, q = 0.92) at 12 weeks. No significant differences were found in any relative abundance of the identified genera of the GM when comparing the fast and slow weight loss rate dogs at either week 0 or at week 6.
For nine of the 12 dogs sufficient faecal material remained post‐sequencing to analyse the faecal SCFA content of paired samples from week 0 and 6. From the remaining three dogs, adequate faecal material was left to perform the SCFA analyses for 1 week 6 sample from 1 of the dogs and 2 week 12 samples from the other two dogs. The faecal amount of acetic acid was significantly lower at 6 weeks (Table 4, P = 0.04) in the dogs with a fast weight loss rate compared to the dogs with a slow weight loss rate. There was also a tendency towards lower propionic acid at 6 weeks in the dogs with a fast weight loss rate compared to the dogs with a slow weight loss rate (Table 4, P = 0.05). There were no significant differences in the faecal short chain fatty acid content at week 0 between the dogs with a fast compared to slow weight loss rate. When plotting the third and fourth principal components of the PCA, including GM proportions and SCFA data at week 0 and 6 as well as the SCFA data, the dogs with a fast weight loss rate at week 6 seemed to visually cluster together (Fig. S3). However, weight loss rate was not a significant factor for the third (PC3) or fourth (PC4) principal components when analysed using an ANOVA (P > 0.1). Plotting of the first and second principal component did not yield any clustering related to the weight loss rate (results not shown).
Table 4.
Faecal short chain fatty acid levels (mean ± SD) in week 0 and 6 in dogs (n = 12) undergoing a 12 week weight loss trial, comparing dogs with a fast (≥1% of body weight per week) and slow (<1.0% bodyweight per week) weight loss rate
| SCFA | Fast | Slow | P‐valuea | 95% CI | ||
|---|---|---|---|---|---|---|
| Faecal SCFA | Week 0 | Acetic acid | 70.2 ± 27.4 | 64.7 ± 22.3 | 0.75 | −40.1 to 29.1 |
| Propionic acid | 44.0 ± 21.4 | 28.2 ± 10.2 | 0.22 | −39.5 to 7.99 | ||
| Isobutyric acid | 1.01 ± 0.56 | 0.81 ± 0.7 | 0.65 | −1.05 to 0.65 | ||
| n‐Butyric acid | 10.6 ± 4.1 | 9.8 ± 2.1 | 0.68 | −5.38 to 3.88 | ||
| Iso‐valeric acid | 0.74 ± 0.42 | 0.62 ± 0.6 | 0.71 | −0.81 to 0.55 | ||
| n‐Valeric acid | 0.28 ± 0.23 | 0.29 ± 0.29 | 0.97 | −0.35 to 0.36 | ||
| DL‐Lactic acid | 0.41 ± 1.0 | 0.00 ± 0 | 0.34 | −1.44 to 0.62 | ||
| Succinic acid | 13.1 ± 19.6 | 11.4 ± 25.4 | 0.89 | −32.4 to 29.0 | ||
| Week 6 | Acetic acid | 54.3 ± 2.9 | 71.5 ± 15.9 | 0.04 | 0.48 to 33.8 | |
| Propionic acid | 23.2 ± 4.0 | 32.7 ± 7.78 | 0.05 | 0.43 to 18.5 | ||
| Isobutyric acid | 1.3 ± 0.49 | 1.22 ± 0.76 | 0.77 | −1.05 to 0.81 | ||
| n‐Butyric acid | 8.2 ± 1.4 | 10.5 ± 3.78 | 0.24 | −1.89 to 6.45 | ||
| Iso‐valeric acid | 1.2 ± 0.57 | 1.03 ± 0.63 | 0.57 | −1.06 to 0.68 | ||
| n‐Valeric acid | 0.19 ± 0.17 | 1.13 ± 1.83 | 0.10 | −0.96 to 2.83 | ||
| Succinic acid | 1.3 ± 4.0 | 1.31 ± 2.93 | 0.85 | −5.60 to 4.64 | ||
Data was analysed using ANOVA, and reported as mean ± SD, P < 0.05, in bold, was considered a significant change).
Adjusted P‐value.
Discussion
In this study, we show that weight loss on a purpose‐made weight loss diet seems to affect the GM in dogs independent of inclusion of moderate physical activity. Whether this difference is due to diet change or weight loss per se is difficult to determine from our study. Although all the dogs were fed the same diet, we were still able to identify a correlation between weight loss rate and the GM composition and faecal SCFA. A near‐significant correlation was found between a decrease in Megamonas spp. between week 0 and 6, and a fast weight loss rate. In addition, the proportion of an unknown genus of the family Ruminococcaceae was found to be significantly lower in dogs with a fast weight loss rate at 12 weeks. However, even though the unknown genus of the family Ruminococcaceae was significantly lower in dogs with a fast weight loss rate, the FDR q‐value was not low, which could be related to lack of power or that the result is a type 1 error. Interestingly, the faecal acetic acid level was also lower at 6 weeks, and in addition, a tendency towards lower propionic acid at 6 weeks was seen in the dogs with a fast weight loss rate. Members of Megamonas and Ruminococcaceae are known to produce acetic and propionic acid. The importance of a reduction in the Megamonas genus and an unknown genus of the Ruminococcaceae in weight loss rate is therefore supported by a simultaneous reduction in acetic and propionic acid. This indicates that for some overweight dogs a reduction in Megamonas and Ruminococcaceae occurred, which then may have led to a decrease in certain SCFA, leading to a more expedient weight loss in these dogs. When comparing the distribution of group (FD vs. DO), breed, age, sex and neutering status, we found no difference in the distribution between these factors relating to fast compared to slow weight loss rate (Table S1). The daily amount fed to the dogs during the study was based on a 55% reduction in maintenance energy requirement, which has been used in previous studies (German et al. 2007). Because the amount to be fed to each dog was solely based on giving 55% of their estimated MER, the degree of energy restriction in relation to previous feeding level was not necessarily the same for all included dogs; this could be a possible confounder of the changes in GM composition and metabolites related to weight loss rate. Similarly, differences in composition of the study diet both in macro‐ and micro nutrient content compared to the diets given to the dogs previous to inclusion may also have been a confounding factor. Furthermore, between week 6 and 12 most of the dogs were either fed less than the 55% of their estimated MER (five dogs) or fed to maintain optimal bodyweight (two dogs), which may have influenced the result regarding the proportion of Ruminococcaceae found to be lower in the dogs with a fast weight loss rate at 12 weeks.
Another limitation of this study is that the exact timing of antibiotic and or deworming treatment prior to study inclusion, or whether or not the dogs had ever received antibiotics at all is unknown, and this may potentially have influenced the results. Similarly, even though the owners were asked to only feed the test diet during the 12 weeks, a few deviations were reported, and additional deviations may have occurred, which could also have influenced the results. Furthermore, the study period was limited to 12 weeks, and therefore several dogs had not reached their optimal weight at the end of the study. In human weight loss studies, it is common that patients do not reach optimal weight during the study periods but “only” manage to achieve a moderate weight reduction. However, even a moderate weight loss of 5 to 10% improves metabolic health significantly (Soleymani et al. 2016). In addition, how samples are collected and handled, which variable region of the 16S rRNA gene is analysed, and sequencing technique used, etc., have previously been shown to influence GM results (Cruaud et al. 2014). This is a well‐known limitation that hinders direct comparison of results between studies of the gut microbiota. However, a strength of this study is that the faecal samples were collected per rectum and subsequently immediately frozen at −80°C. Furthermore, GM characterization was carried out using a well‐established and documented workflow.
Obese humans have been shown to have a GM with a seemingly increased capacity for harvesting energy from their diet compared to lean humans (Turnbaugh et al. 2006). The tendency towards a correlation of a decrease in the genus Megamonas, and a lower proportion of Ruminococcaceae in addition to the decrease in acetic and propionic acid, could suggest that the difference in the dogs’ rate of weight loss may relate to extraction of energy through colonic fermentation of fermentable carbohydrates. This is in consistent with studies in humans, which indicate that obese individuals may respond differently to a weight loss diet depending on their GM composition (Santacruz et al. 2009; Cotillard et al. 2013).
Members of Megamonas and Ruminococcaceae produce acetic and propionic acid, which in rodents has been shown to be a substrate for lipogenesis and cholesterol formation (Conterno et al. 2011). Furthermore, obese humans and rodents also seem to have an increased amount of faecal SCFA content compared to lean individuals, and this difference does not seem to be related to a decrease in absorption (Rahat‐Rozenbloom et al. 2014). SCFAs are thought to benefit the host by improving glucose homeostasis and stimulating enterocyte differentiation, but it should be noted that SCFAs such as acetic acid also serve as an energy source for the host (McNeil 1984).
In a comparison of the GM composition of 21 obese pet dogs to the GM composition of 22 lean dogs, Handl et al. (2013) found that bacteria belonging to the phylum Actinobacteria and the genus Roseburia were more abundant amongst the obese dogs compared to the lean. Some members of the Roseburia genus are, similarly to some members of the Megamonas and Ruminococcaceae, recognized as producers of SCFAs with fermentable fibres as the substrate (Ríos‐Covián et al. 2016). SCFA‐producing bacteria may therefore be more abundant in some obese dogs compared to lean dogs, and our results indicate that SCFA production may be important for the weight loss rate in diet‐induced weight loss in dogs. However, the sample size of this study was small (n = 12), and the presented results should therefore be interpreted with caution.
The lack of association between GM composition and exercise could be due to the study population being too small. Alternatively, the amount or frequency of exercise was not sufficient to significantly impact GM composition in this population of overweight pet dogs. Clarke et al. found differences in the GM composition between professional rugby players and two groups of controls, one with body mass index (BMI) ≤25 and one of >28. However, they also found that the dietary habits differed greatly between the athletes and the controls and that the estimated dietary protein content was related to the GM differences detected (Clarke et al. 2014). This could be another explanation for why no difference was found between the FD and DO group in this study.
In summary, a sub‐population of overweight and obese dogs seems to have a GM composition that could make them more resistant to weight loss, an effect which may be related to an increased ability to harvest energy from the diet through production of SCFA. This finding should be confirmed in a larger study of pet dogs, as well as colony dogs, living in a controlled environment, to assess if these alterations in GM impact long‐term weight loss success and to clarify possible underlying mechanisms.
Source of funding
Supported in part by the University of Copenhagen UNIK Food, Fitness and Pharma Research Program and the University of Copenhagen Synergy in Human and Animal Research (SHARE) program. Royal Canin, Denmark, donated the diets used for dogs included in the study.
Conflict of interest
The authors declare that they have no conflicts of interest.
Ethics statement
The authors confirm that the ethical policies of the journal, as noted on the journal's author guidelines page, have been adhered to and the appropriate ethical review committee approval has been received. The study was approved by the Administrative and Ethical Committee at the Department of Veterinary Clinical and Animal Sciences, University of Copenhagen, as well as by the Danish Animal Experimentation Inspectorate (approval No. 2011_561‐80).
Contribution
I.N.K assisted in the clinical study, performed the analysis of the GM, the statistical analysis and drafted the initial manuscript. S.S.K. assisted in the GM analysis and statistical analysis, and participated in manuscript preparation. A.D.V. was responsible for and conducting the clinical study, and participated in manuscript preparation. C.R.B. planned the clinical study and supervised the collection and conduction of the intervention, interpretation of results, and participated in manuscript preparation. D.S.N. assisted in the planning of the laboratory analysis, and provided supervision for the GM analysis, and participated in manuscript preparation. C.L. conducted the SCFA analysis and assisted in the interpretation of SCFA results, and participated in manuscript preparation. All authors reviewed and agreed the content of the final manuscript.
Supporting information
Figure S1. Flowchart illustrating inclusion and exclusion of dogs, undergoing a 12 week weight loss trial, and samples from the dogs collected at three time points (week 0, week 6 and week 12) used in the bioinformatics and statistical analysis, shown according to which group (exercise and diet (FD) or diet only (DO)) the dogs were included in.
Figure S2. Principal Coordinates Analysis (PCoA) plot based on weighted UniFrac distance metrics of the gut microbiome, as rarefied, relative abundance OTUs at genus level, of dogs undergoing a 12 week weight loss trial. The first three principal coordinates (PCo1‐3) are shown, comparing the group with a fast weight loss (WL) rate (≥1% of body weight per week, red points), and slow WL rate (<1% of body weight per week, blue points) between week 0 and week 6 (data was analysed with ANOSIM, P < 0.05 was considered a significant change).
Figure S3. Plot of the third (PC3) and fourth (PC4) principal components of the fast WL rate group (≥1% of body weight per week) and slow WL rate group (<1% of body weight per week) between week 0 and week 6. The Principal Component Analysis was conducted using the gut microbiome (rarefied, relative abundance OTUs) data and the short chain fatty acid (SCFA) data, from dogs (n = 11) undergoing a 12 week weight loss trial.
Table S1. Distribution of group (exercise and diet (FD, n = 6), or diet only (DO, n = 5)), breed, age, sex and neutering status of dogs undergoing a 12 week weight loss trial. Dogs are grouped based on whether they had a fast weight loss rate (≥1% weight loss per week) or a slow weight loss rate (<1% weight loss per week) between week 0 and week 6.
Acknowledgements
This research represents a portion of a thesis submitted by the first author to the University of Copenhagen, Department of Veterinary Clinical Sciences as partial fulfillment of the requirements for a doctoral degree.
Presented in abstract form at the 19th Congress of the European Society of Veterinary and Comparative Nutrition (ESVCN 2015), Toulouse, France, September 2015.
References
- Ajslev T.A., Angquist L., Silventoinen K., Baker J.L. & Sorensen T.I. (2015) Stable intergenerational associations of childhood overweight during the development of the obesity epidemic. Obesity (Silver Spring) 23, 1279–1287. [DOI] [PubMed] [Google Scholar]
- Alenza M.D.P., Pena L., del Castillo N. & Nieto A.I. (2000) Factors influencing the incidence and prognosis of canine mammary tumours. Journal of Small Animal Practice 41, 287–291. [DOI] [PubMed] [Google Scholar]
- Bach J.F., Rozanski E.A., Bedenice D., Chan D.L., Freeman L.M., Lofgren J.L. et al (2007) Association of expiratory airway dysfunction with marked obesity in healthy adult dogs. American Journal of Veterinary Research 68, 670–675. [DOI] [PubMed] [Google Scholar]
- Brooks D., Churchill J., Fein K., Linder D., Michel K.E., Tudor K. et al, American Animal Hospital, A . (2014) 2014 AAHA weight management guidelines for dogs and cats. Journal of the American Animal Hospital Association 50, 1–11. [DOI] [PubMed] [Google Scholar]
- Canibe N., Hojberg O., Badsberg J.H. & Jensen B.B. (2007) Effect of feeding fermented liquid feed and fermented grain on gastrointestinal ecology and growth performance in piglets. Journal of Animal Science 85, 2959–2971. [DOI] [PubMed] [Google Scholar]
- Caporaso J.G., Kuczynski J., Stombaugh J., Bittinger K., Bushman F.D., Costello E.K. et al (2010) QIIME allows analysis of high‐throughput community sequencing data. Nature Methods 7, 335–336. [DOI] [PMC free article] [PubMed] [Google Scholar]
- Clarke S.F., Murphy E.F., O'Sullivan O., Lucey A.J., Humphreys M., Hogan A. et al (2014) Exercise and associated dietary extremes impact on gut microbial diversity. Gut 63, 1913–1920. [DOI] [PubMed] [Google Scholar]
- Conterno L., Fava F., Viola R. & Tuohy K.M. (2011) Obesity and the gut microbiota: does up‐regulating colonic fermentation protect against obesity and metabolic disease? Genes & Nutrition 6, 241–260. [DOI] [PMC free article] [PubMed] [Google Scholar]
- Cotillard A., Kennedy S.P., Kong L.C., Prifti E., Pons N., Le Chatelier E. et al, Consortium A.N.R.M. , Dore J., Zucker J.D., Clement K., Ehrlich S.D., Henegar; Fondacci; Jamet. (2013) Dietary intervention impact on gut microbial gene richness. Nature 500, 585–588. [DOI] [PubMed] [Google Scholar]
- Cruaud P., Vigneron A., Lucchetti‐Miganeh C., Ciron P.E., Godfroy A. & Cambon‐Bonavita M.‐A. (2014) Influence of DNA extraction method, 16S rRNA targeted hypervariable regions, and sample origin on microbial diversity detected by 454 pyrosequencing in marine chemosynthetic ecosystems. Applied and Environmental Microbiology 80, 4626–4639. [DOI] [PMC free article] [PubMed] [Google Scholar]
- Duncan S.H., Lobley G.E., Holtrop G., Ince J., Johnstone A.M. , Louis P. & Flint H.J. (2008) Human colonic microbiota associated with diet, obesity and weight loss. International Journal of Obesity 32, 1720–1724. [DOI] [PubMed] [Google Scholar]
- Fildes A., Charlton J., Rudisill C., Littlejohns P., Prevost A.T. & Gulliford M.C. (2015) Probability of an obese person attaining normal body weight: cohort study using electronic health records. American Journal of Public Health 105, e54–e59. [DOI] [PMC free article] [PubMed] [Google Scholar]
- German A.J. (2006) The growing problem of obesity in dogs and cats. The Journal of Nutrition 136, 1940S–1946S. [DOI] [PubMed] [Google Scholar]
- German A.J., Holden S.L., Bissot T., Hackett R.M. & Biourge V. (2007) Dietary energy restriction and successful weight loss in obese client‐owned dogs. Journal of Veterinary Internal Medicine 21, 1174–1180. [DOI] [PubMed] [Google Scholar]
- German A.J., Titcomb J.M., Holden S.L., Queau Y., Morris P.J. & Biourge V. (2015) Cohort study of the success of controlled weight loss programs for obese dogs. Journal of Veterinary Internal Medicine 29, 1547–1555. [DOI] [PMC free article] [PubMed] [Google Scholar]
- Gomes M. D. O. S., Beraldo M.C., Putarov T.C., Brunetto M.A., Zaine L., Glória M.B.A., Carciofi A.C. (2011) Old beagle dogs have lower faecal concentrations of some fermentation products and lower peripheral lymphocyte counts than young adult beagles. British Journal of Nutrition 106, S187–S190. [DOI] [PubMed] [Google Scholar]
- Handl S., German A.J., Holden S.L., Dowd S.E., Steiner J.M., Heilmann R.M. et al (2013) Faecal microbiota in lean and obese dogs. FEMS Microbiology Ecology 84, 332–343. [DOI] [PubMed] [Google Scholar]
- Herrera Uribe J., Vitger A.D., Ritz C., Fredholm M., Bjørnvad C.R. & Cirera S. (2016) Physical training and weight loss in dogs lead to transcriptional changes in genes involved in the glucose‐transport pathway in muscle and adipose tissues. The Veterinary Journal 208, 22–27. [DOI] [PubMed] [Google Scholar]
- Kealy R.D., Lawler D.F., Ballam J.M., Mantz S.L., Biery D.N., Greeley E.H. et al (2002) Effects of diet restriction on life span and age‐related changes in dogs. Journal of the American Veterinary Medical Association 220, 1315–1320. [DOI] [PubMed] [Google Scholar]
- Laflamme D. (1997) Development and validation of a body condition score system for cats: a clinical tool. Feline Practice 25, 13–18. [Google Scholar]
- Larsson C., Vitger A., Jensen R.B., Junghans P. & Tauson A.H. (2014) Evaluation of the oral (13)C‐bicarbonate technique for measurements of energy expenditure in dogs before and after body weight reduction. Acta Veterinaria Scandinavica 56, 87. [DOI] [PMC free article] [PubMed] [Google Scholar]
- Lavie C.J., De Schutter A. & Milani R.V. (2015) Healthy obese versus unhealthy lean: the obesity paradox. Nature Reviews. Endocrinology 11, 55–62. [DOI] [PubMed] [Google Scholar]
- Ley R.E., Turnbaugh P.J., Klein S. & Gordon J.I. (2006) Microbial ecology: human gut microbes associated with obesity. Nature 444, 1022–1023. [DOI] [PubMed] [Google Scholar]
- McNeil N.I. (1984) The contribution of the large intestine to energy supplies in man. The American Journal of Clinical Nutrition 39, 338–342. [DOI] [PubMed] [Google Scholar]
- Pedersen H.K., Gudmundsdottir V., Nielsen H.B., Hyotylainen T., Nielsen T., Jensen B.A.H. et al (2016) Human gut microbes impact host serum metabolome and insulin sensitivity. Nature 535, 376–381. [DOI] [PubMed] [Google Scholar]
- Pyndt Jørgensen B., Hansen J.T., Krych L., Larsen C., Klein A.B., Nielsen D.S. et al (2014) A possible link between food and mood: dietary impact on gut microbiota and behavior in BALB/c mice. PLoS ONE 9, e103398. [DOI] [PMC free article] [PubMed] [Google Scholar]
- Queipo‐Ortuño M.I., Seoane L.M., Murri M., Pardo M., Gomez‐Zumaquero J.M., Cardona F. et al (2013) Gut microbiota composition in male rat models under different nutritional status and physical activity and its association with serum leptin and ghrelin levels. PLoS ONE 8, e65465. [DOI] [PMC free article] [PubMed] [Google Scholar]
- Rahat‐Rozenbloom S., Fernandes J., Gloor G.B. & Wolever T.M. (2014) Evidence for greater production of colonic short‐chain fatty acids in overweight than lean humans. International Journal of Obesity (Lond) 38, 1525–1531. [DOI] [PMC free article] [PubMed] [Google Scholar]
- Ríos‐Covián D., Ruas‐Madiedo P., Margolles A., Gueimonde M., delos Reyes‐Gavilán C.G. , Salazar N.. (2016) Intestinal short chain fatty acids and their link with diet and human health. Frontiers in Microbiology 7, 185. [DOI] [PMC free article] [PubMed] [Google Scholar]
- Santacruz A., Marcos A., Warnberg J., Marti A., Martin‐Matillas M., Campoy C. et al (2009) Interplay between weight loss and gut microbiota composition in overweight adolescents. Obesity 17, 1906–1915. [DOI] [PubMed] [Google Scholar]
- Soleymani T., Daniel S. & Garvey W.T. (2016) Weight maintenance: challenges, tools and strategies for primary care physicians. Obesity Reviews 17, 81–93. [DOI] [PMC free article] [PubMed] [Google Scholar]
- Turnbaugh P.J., Ley R.E., Mahowald M.A., Magrini V., Mardis E.R. & Gordon J.I. (2006) An obesity‐associated gut microbiome with increased capacity for energy harvest. Nature 444, 1027–1031. [DOI] [PubMed] [Google Scholar]
- Vitger A.D., Stallknecht B.M., Nielsen D.H. & Bjornvad C.R. (2016) Integration of a physical training program in a weight loss plan for overweight pet dogs. Journal of the American Veterinary Medical Association 248, 174–182. [DOI] [PubMed] [Google Scholar]
- Vitger A.D., Stallknecht B.M., Miles J.E., Hansen S.L., Vegge A. & Bjornvad C.R. (2017) Immunometabolic parameters in overweight dogs during weight loss with or without an exercise program. Domestic Animal Endocrinology 59, 58–66. [DOI] [PubMed] [Google Scholar]
Associated Data
This section collects any data citations, data availability statements, or supplementary materials included in this article.
Supplementary Materials
Figure S1. Flowchart illustrating inclusion and exclusion of dogs, undergoing a 12 week weight loss trial, and samples from the dogs collected at three time points (week 0, week 6 and week 12) used in the bioinformatics and statistical analysis, shown according to which group (exercise and diet (FD) or diet only (DO)) the dogs were included in.
Figure S2. Principal Coordinates Analysis (PCoA) plot based on weighted UniFrac distance metrics of the gut microbiome, as rarefied, relative abundance OTUs at genus level, of dogs undergoing a 12 week weight loss trial. The first three principal coordinates (PCo1‐3) are shown, comparing the group with a fast weight loss (WL) rate (≥1% of body weight per week, red points), and slow WL rate (<1% of body weight per week, blue points) between week 0 and week 6 (data was analysed with ANOSIM, P < 0.05 was considered a significant change).
Figure S3. Plot of the third (PC3) and fourth (PC4) principal components of the fast WL rate group (≥1% of body weight per week) and slow WL rate group (<1% of body weight per week) between week 0 and week 6. The Principal Component Analysis was conducted using the gut microbiome (rarefied, relative abundance OTUs) data and the short chain fatty acid (SCFA) data, from dogs (n = 11) undergoing a 12 week weight loss trial.
Table S1. Distribution of group (exercise and diet (FD, n = 6), or diet only (DO, n = 5)), breed, age, sex and neutering status of dogs undergoing a 12 week weight loss trial. Dogs are grouped based on whether they had a fast weight loss rate (≥1% weight loss per week) or a slow weight loss rate (<1% weight loss per week) between week 0 and week 6.