

Abstract
Purpose:
To determine interocular differences in the retinal nerve fiber layer (RNFL) and optic nerve head (ONH) parameters in a pediatric population using Cirrus high-definition optical coherence tomography (HD-OCT).
Methods:
Seventy normal Indian children aged 5–17 years presenting to the Pediatric Clinic were included in this observational cross-sectional study. All subjects underwent a comprehensive ophthalmologic examination and an evaluation of the RNFL and ONH by Cirrus HD-OCT. Differences between the right and left eyes were calculated and values were compared by means of a paired t-test. Subjects were also divided into two groups based on age (under or over 10 years of age). Interocular differences in RNFL and ONH parameters together with sex and age variations for these differences were determined.
Results:
The mean age of studied pediatric population was 11.83 ± 3.3 years (range 5–17). Average RNFL thickness was 94.46 ± 8.7 μm (± SD) (range 77–111). Differences in the average RNFL between right and left eyes were not statistically significant (P = 0.060). Superior quadrant RNFL was thicker in the left eye and temporal quadrant was thicker in the right eye. Among ONH parameters, there were no statistically significant differences in any parameters, except vertical cup-disc (CD) ratio which was significant (P = 0.007). The 2.5%–97.5% limits of asymmetry were 9 μm for average RNFL, 0.14 for average CD ratio, and 0.22 for vertical CD ratio. Mean interocular RNFL thickness differences in superior, superior nasal, and temporal superior quadrants were 10.61 (P < 0.001), 12.57 (P < 0.001), and 4.46 (P = 0.002) μm, respectively. Interocular nerve fiber layer thickness differences were not significantly correlated with sex, while only significant differences with age were observed in 12 clock hour sector analysis, mainly in nasal inferior and inferior quadrant.
Conclusions:
We report the degree of interocular symmetry of RNFL and ONH parameters measured by Cirrus HD-OCT in a healthy pediatric population. The normal interocular RNFL asymmetry should not exceed 9 μm and vertical CD ratio beyond 0.22 should be considered for further investigations. The physiologic asymmetry provided by this study may assist in identifying changes in RNFL thickness and ONH parameters in pediatric glaucoma and ONH disorders.
Keywords: Interocular asymmetry, optical coherence tomography, retinal nerve fiber layer thickness, spectral-domain
Although the human body looks symmetrical on the outside, most of our vital organs are not exactly symmetrical and there exists some physiologic asymmetry. The same applies to retinal parameters of both eyes where some amount of physiological variations can occur. Few studies have been published in limited ethnic populations on interocular asymmetry of retinal nerve fiber layer (RNFL) in adult and pediatric healthy eyes.[1,2,3,4,5,6,7,8]
Optical coherence tomography (OCT) has a well-established structural imaging role in ophthalmic disease diagnosis and management and has proven its importance in visualization and quantification of ocular structures. The most common clinical implication of this noncontact high-resolution technology is in glaucoma, retinal diseases, neuro-ophthalmology, and anterior segment applications.[1]
Spectral-domain OCT (SD-OCT) images faster with a high axial image resolution than earlier domain-based generations of this technology. The quantification of structural and ultrastructural changes with SD-OCT expands the utility of OCT in pediatric ophthalmology in evaluating pediatric and juvenile glaucoma, pediatric neuro-ophthalmology, and pediatric retinal disorders.[2,3] To enhance the information provided by structural diagnostic tool of OCT for pediatric optic and retinal disorders, a comparison with population-derived normative data is needed to identify deviations from the normal range. The studies on variations in normal morphology in RNFL also emphasizes the need for normative data and interocular symmetry in the pediatric population.[2,3,4,5,6,7,8]
Methods
This was a cross-sectional study of healthy Indian children 5–17 years of age visiting the pediatric ophthalmology clinic at a tertiary eye care center. Ethical review board permission was taken. Informed consent was obtained from parents or guardians. Included in the study were subjects with no ocular abnormality, except refractive error with spherical equivalent (SE) less than ± 3.5 diopters (D) or astigmatism less than 1.5D and normal fundus examination.
Patients with strabismus, amblyopia, retinal pathology, optic nerve cup-to-disc (CD) ratio >0.7 or asymmetry of >0.2 between fellow eyes, and history of previous intraocular surgery were excluded. Patients with history of prematurity, developmental delay, neurological, metabolic or other systemic diseases were also excluded. All subjects received a comprehensive ophthalmologic examination from a pediatric ophthalmologist. The visual acuity of each eye was recorded using the Snellen chart, and intraocular pressure (IOP) was recorded by applanation or noncontact tonometer (where possible). Slit-lamp biomicroscopy, cycloplegic refraction, and dilated fundoscopy were performed. Pupils were dilated using tropicamide 1% and phenylephrine 2.5% and cyclopentolate 1% eyedrops. The manual retinoscopy was also confirmed by automated refraction (Topcon KR 8900).
The Cirrus high-definition OCT (HD-OCT) (Model 4000 software version 5.1.1.4; Carl Zeiss Meditec, Dublin, CA, USA) was used to obtain high-definition images. The OCT measurement of all children was performed by the same experienced technician with the pupil dilated. The macula and peripapillary RNFL examinations were performed using an internal fixator. The scans with a signal strength of at least 6 were included in the study.
Optic disc cubes of 200 × 200 protocol were utilized to assess peripapillary RNFL thickness. RNFL thickness (all four quadrants: superior, nasal, inferior, and temporal; average, and 12 clock hours), RNFL symmetry, rim area, disc area, average CD ratio, vertical CD ratio, and cup volume were recorded. The clock hour RNFL thicknesses and 12 30° sectors were defined in clockwise order for the right eye and counterclockwise for the left eye.
Statistical analysis
The differences between right and left eyes were calculated and values were compared by means of a paired t-test. Descriptive statistics were reported as means and SDs and 2.5th, 5th, 95th, and 97.5th percentiles for continuous variables and frequency and percentage for categorical variables. Mean differences for all parameters were calculated by subtracting left eye parameters from right eye parameters, and their P values reported using the paired sample t-test. P value lesser than 0.05 was considered as statistically significant. The Spearman correlation coefficient was computed to measure the interocular agreement/correlation. All statistical analysis was performed by STATA 11.1 (Texas, USA).
Results
Ninety subjects consented to participate in this study. Twenty cases were excluded because scan quality was not good. Thus, 70 subjects were eligible for statistical analysis. For interocular symmetry evaluation, all eyes were studied. The mean age of the studied pediatric population was 11.83 ± 3.3 years (range 5–17). There was no statistically significant difference between male and female subjects for refraction (P = 0.26) and age (P = 0.959). The mean SE was 0.61 ± 0.9 diopters (D) in the right eyes and 0.69 ± 0.9 D in the left eyes (P = 0.133).
Mean global RNFL thickness was 94.46 ± 8.7 μm, (range, 77–111). The RNFL thickness was 93.60 ± 9.5 μm (range 69–119) in right eye and 94.71 ± 8 μm (range 72–117) in left eye; the difference was statistically insignificant (P = 0.06). Fig. 1 scatter plot shows that there was no significant difference in average RNFL thickness of the right and left eyes. The mean RNFL thickness in four quadrants and for all clock hours and gender-wise distribution is provided in Table 1. The mean RNFL thickness was highest in the inferior quadrant followed by superior, nasal, and temporal quadrants [Table 1]. The RNFL was thickest inferiorly (122.99 ± 17.9 μm) and superiorly (118.26 ± 14.50 μm), thinner nasally (72.91 ± 17.1 μm), and thinnest temporally (60.41 ± 9.7 μm). RNFL quadrant thicknesses in the right and left eyes followed a pattern similar to adults, with the thickest quadrant being the inferior, then the superior, followed by the nasal and finally the temporal segments (ISNT rule). The average RNFL thickness, quadrants, and 12 clock hour thickness were not statistically different between the males and females.
Figure 1.
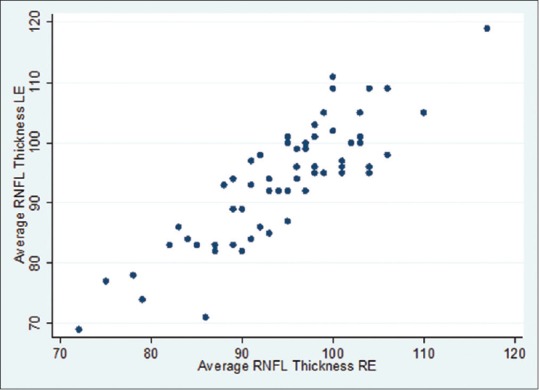
Scatter plot for average retinal nerve fiber layer thickness between right eye and left eye
Table 1.
Retinal nerve fiber layer thickness in four quadrants and for all clock hours and gender wise distribution
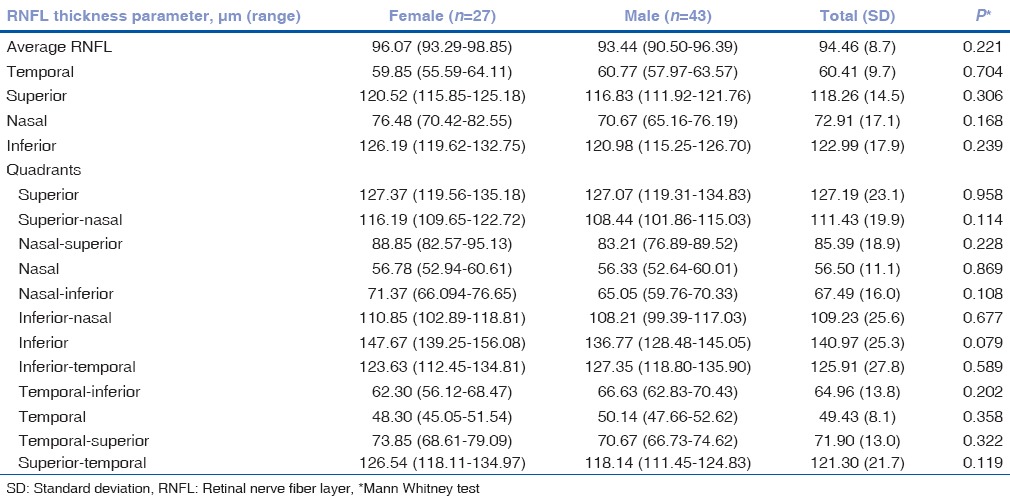
Table 2 shows the mean differences of OCT RNFL and optic nerve head (ONH) parameters between right and left eyes. The RNFL of superior quadrant was thicker in the left eye and temporal quadrant was thicker in the right eye. We found statistically significant interocular differences in superior and temporal RNFL quadrants but not in average RNFL thickness. There were statistically significant differences between superior, superior nasal, and temporal superior quadrants in both eyes.
Table 2.
Interocular differences in retinal nerve fiber layer parameters and optic nerve head parameters between right and left eyes (n=140 eyes)
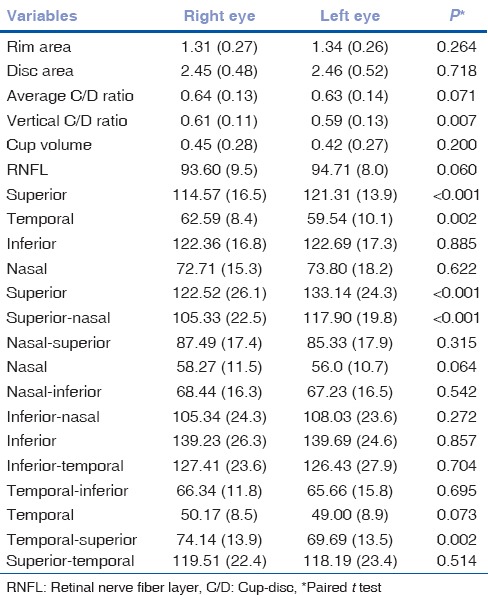
Among ONH parameters, the right eye had a greater vertical CD ratio in our study, and the other ONH parameters did not have statistically significant differences between eyes.
Table 3 lists the data for interocular differences in RNFL parameters and ONH parameters, including mean interocular differences with respective P values, in addition to the 2.5th, 5th, 95th, and 97.5th percentile distribution of the mean differences. The 2.5%–97.5% limits of asymmetry were 9 μm for average RNFL, 0.14 for average CD ratio, and 0.22 for vertical CD ratio. Mean interocular RNFL thickness differences in superior, superior nasal, and temporal superior quadrants were 10.61 (P < 0.001), 12.57 (P < 0.001), 4.46 (P < 0.002) μm, respectively.
Table 3.
Percentile distribution of interocular differences in retinal nerve fiber layer thickness and optic nerve head parameters
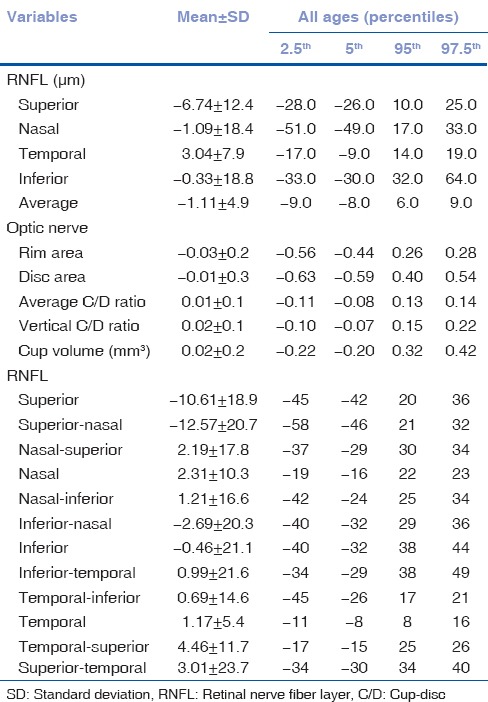
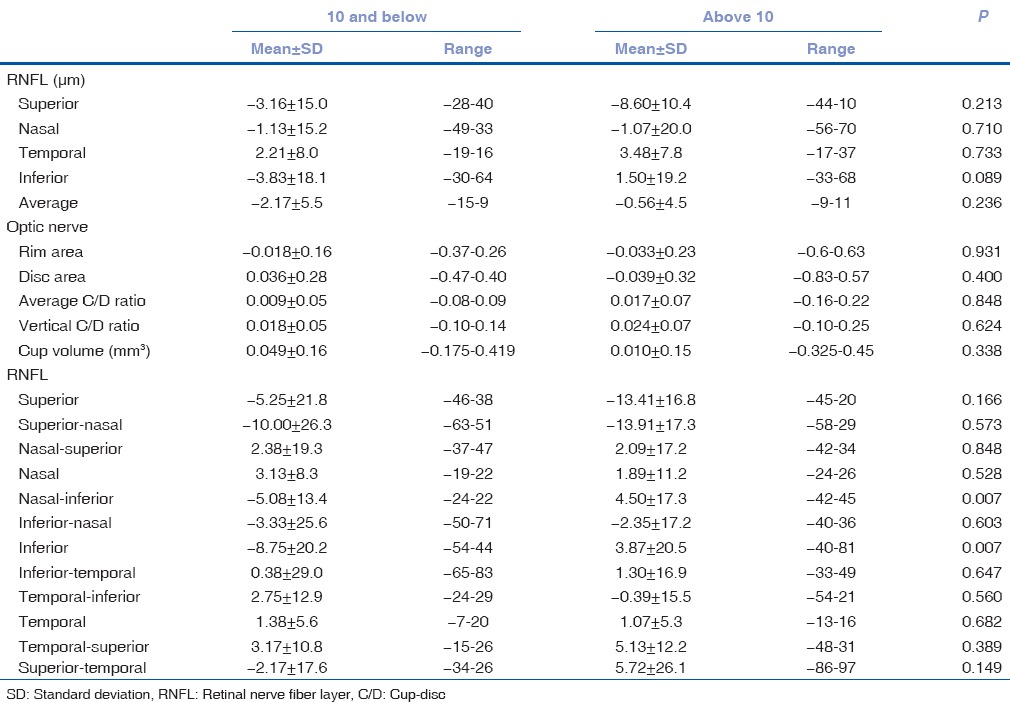
Table 4 shows that there was no correlation with gender in either group in RNFL and ONH parameters, while Table 5 shows interocular symmetry in subjects <10 years and >10 years. It depicts significant differences with respect to age in 12 clock hour sector analysis mainly in nasal inferior and inferior quadrant.
Table 4.
Gender-wise interocular differences in retinal nerve fiber layer and optic nerve head parameters
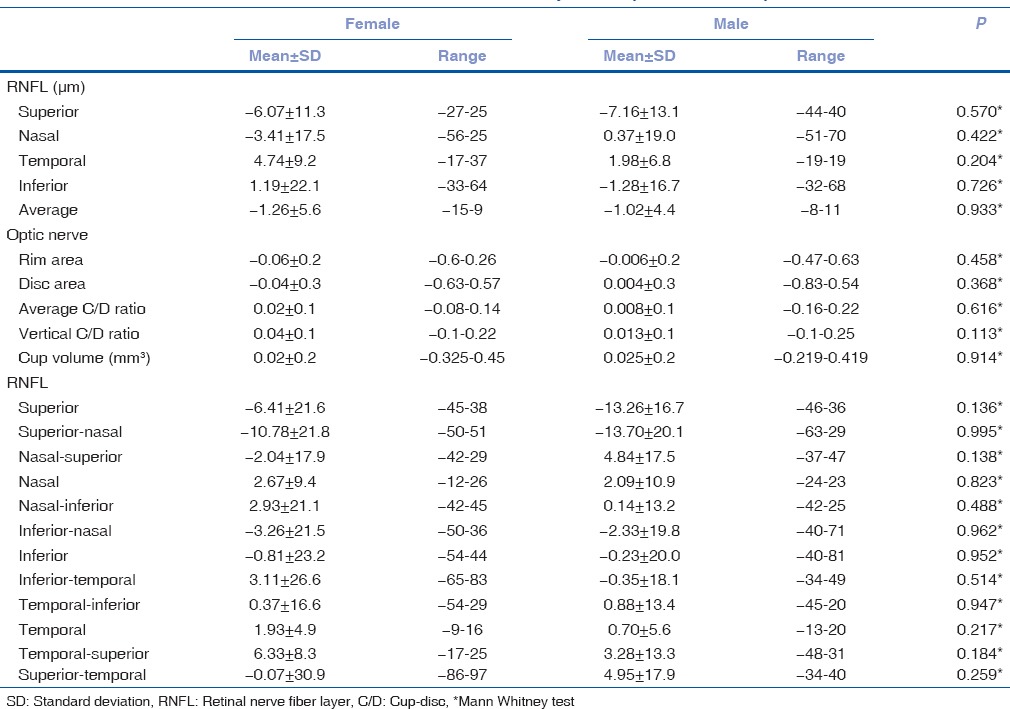
Table 5.
Interocular difference in retinal nerve fiber layer and optic nerve parameters in below 10 and above 10 years of pediatric age group
The Spearman correlation coefficient was 0.8169, 0.6590, 0.6590, 0.8020, 0.8431, 0.8489, 0.8054 for average RNFL, rim area, disc area, average CD ratio, vertical CD ratio, cup volume, respectively (P < 0.001), showing good correlation in these parameters.
Discussion
The structural functional assessment by OCT is currently included in most clinical protocols for diagnosis and follow-up of pediatric glaucoma and optic nerve diseases (glioma, compressive optic neuropathies, idiopathic intracranial hypertension, hereditary neuropathies, and macular and retinal diseases). It is important to determine what the normative data are with spectral OCT for pediatric eyes and which values of asymmetry should be considered an early sign of pathology. The consideration of deviation from normal physiologic values could aid in diagnostic accuracies and modifying treatment modalities in the field of pediatric ophthalmology.[2]
Various studies have agreed on intravisit and intervisit reproducibility of measurements of peripapillary RNFL thickness and ONH parameters in the pediatric population.
This study aimed to examine symmetry of the average RNFL thickness and ONH parameters in a normal pediatric population. The RNFL measurements obtained may vary according to the OCT model used, depending on software algorithms, different models, and display scans.[5,6,7,8,9,10,11,12,13,14,15,16,17] Published literature has evidence-based proof that SD-OCT technology can determine the changes in RNFL thickness much earlier than the time-domain OCT.[18,19,20,21,22,23,24]
The average RNFL thickness in our study was determined 94.46 ± 8.70 μm which is consistent with findings reported in the literature.[2,3,4,5,6,7,8,9,10] Table 6 shows OCT values of the previous studies of pediatric population with Cirrus HD-OCT, interocular symmetry and our present study as well.[21,22,23,24,25,26,27,28,29]
Table 6.
Optical coherence tomography values of previous studies of children with spectral domain optical coherence tomography and interocular symmetry
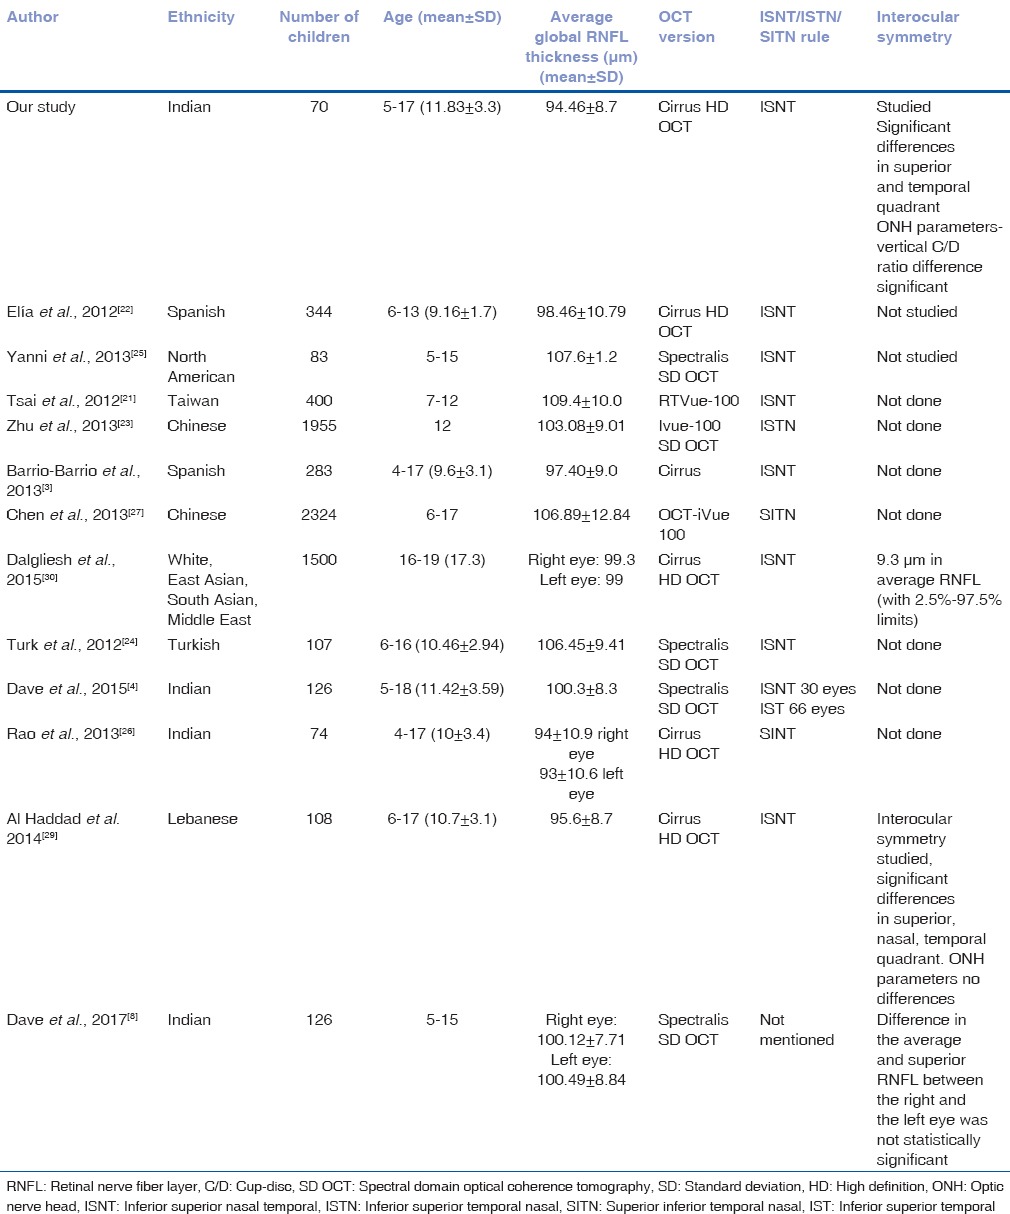
The distribution of RNFL thickness (thickest inferiorly and superiorly, thinner nasally, and thinnest temporally) in our study is in agreement with the normal distribution of RNFL in accordance with ISNT rule.[6] Chen et al. reported the thickest RNFL to be the superior quadrant, followed by the inferior quadrant, temporal quadrant, and nasal quadrant.[27] Zhu et al. found ISTN pattern in their study.[23] Dave et al. found that ISNT rule on the RNFL in an Indian population was followed only by 30 eyes (23.8%), while the IST (inferior thickest followed by superior and temporal) rule was followed by 66 eyes (52.4%) (P < 0.001).[4] Rao et al. found the RNFL to be thickest in the superior, inferior, nasal, and temporal quadrants in an Indian pediatric population.[26] The deviation from ISNT has been reported in other pediatric and adult studies in various ethnic populations.[4,23,24,25,26].
The published data obtained with earlier versions of stratus time-domain OCT show slightly higher values for RNFL thickness compared to our present results, with differences ranging from 19.52 μm to 3.94 μm. The different versions of the software algorithm could be accountable for differences between values.[8,9,10,11,12,13,14,15,16,17,18,19]
Average RNFL thickness values for our study were comparable with those of Noemi et al., Barrio et al., Al-Haddad et al., Altemir et al., Dalgilesh et al., Rao et al. but lower than those of the younger subjects reported by Zhu et al. (population mostly Asian Indian), Chen et al., Turk et al., Tsai et al., Yanni et al., and Dave et al.[4,22,23,24,25,26,27,30]
The few studies carried out with the Cirrus OCT in pediatric population have reported that the mean average RNFL thickness ranged from 92 to 99.44, which would include our result of 94.46 um.[4,21,22,23,24,25,26,27,30]
In accordance with other studies, gender in the present study did not influence RNFL thickness and ONH parameters.[2,7] The mean RNFL thicknesses were similar between boys and girls. Huynh et al. reported significantly thicker average RNFL (P = 0.007) and inferior quadrant RNFL (P = 0.02) in boys than in girls after adjusting for age, height, axial length, ethnicity, and cluster sampling.[7,9] Zhu et al. found that the average RNFL thickness and temporal and inferior quadrants were significantly greater in girls.[23] A study done by Turk et al. showed there was no significant correlation between age, refractive error, axial length values, and RNFL thickness.[24]
The effects of refraction on RNFL thickness have varied results. Huynh et al., Salchow et al., and Qian et al. reported a positive correlation of the average RNFL thickness with refractive error in children.[8,9,10,19] Budenz et al. and Cheung et al. reported thinning RNFL with increasing myopia in White and Asian adults. In a study by Zhu et al., a significant positive correlation of the average RNFL thickness was seen with refractive error in even in low myopia population.[23]
Most studies reported that the RNFL thickness was greater in the right than in the left eye for the temporal quadrant and thicker in the left eye than the right eye for the inferior nasal sector. Studies done with previous versions of OCT showed similar results, and RNFL in the right eyes were thicker than in the left eyes.
In our study, there were no interocular differences between right and left average RNFL. Superior quadrant RNFL was thicker in the left eye and temporal quadrant was thicker in right eye. We found statistically significant interocular differences in RNFL quadrants but not in average RNFL thickness. The average RNFL thickness in the right and left eyes of children differed from those in previous studies. Qian et al. found thicker RNFL in the left eye.[19] Al-Haddad et al. also found thicker nasal and temporal quadrant in the right eyes and a thicker superior quadrant in the left eyes with Cirrus HD-OCT. They found no differences in average RNFL thickness but statistically significant interocular differences in RNFL quadrants. These differences were significant in the older age group (>10 years) while some of the RNFL clock hours depicted significant differences.[29] Similarly, Altemir et al. found RNFL in the right eyes to be thicker in the temporal and nasal quadrants, whereas the left eye showed thicker RNFL in the superior quadrant, while there were no statistically significant differences in the average RNFL between right and left eyes.[2]
Dave et al. reported RNFL and the posterior pole asymmetry analysis (PPAA) macular thickness values were statistically significantly different between the right and the left eyes, except for the average RNFL (P = 0.4) and the superior RNFL (P = 0.09) thickness values in Indian pediatric population by Spectralis OCT. Dalgliesh et al. in their study found that only the inferior quadrant and the corresponding clock hours of 5 o’clock in the right eye and 7 o’clock in the left eye did not have a significant interocular difference.[30]
Al-Haddad et al., Qian et al., and Dalgliesh et al. found no significant differences in any ONH parameters.[19,29,30] Similarly, Huynh et al. and Altemir et al. reported CD area ratio to be most symmetrical parameter of the optic disc.[2,7] Only, Huynh et al. (6 years age group) reported neural rim area, disc area less in the right eye.[7,9] In the present study, among ONH parameters, right eye was having more vertical CD ratio; rest ONH parameters did not have significant differences though the 97.5th outlier value in our study for vertical CD ratio was 0.22, suggesting that asymmetry beyond this should be considered pathologic. Similarly, Altemir et al. also suggested that any asymmetry greater than 0.25 between both eyes represent outlier and should be subjected to further examinations.[2]
In our study, cutoff limit for interocular RNFL normalcy was 9 μm. Dave et al. reported the normal interocular RNFL and PPAA macular thickness asymmetry should not exceed 12.5 μ and 21 μ, respectively, in Indian children by Spectralis OCT.[8] Altemir et al. in their study reported a cutoff limit of 13 μm for average RNFL thickness, similar to 11.7 μm reported by Budenz et al., and 8.8 μm reported by Mwanza et al. in their study of adult patients.[1,31] Budenz et al. and Mwanza et al. included adult patients in their study, suggesting that normal physiological asymmetry is also demonstrated even in adult patients as well though there is some element of ongoing age-related decaying process.[1,31] The Sydney Childhood Eye Study reported RNFL thickness range of 16–17 μm in large population-based series study of school-going children.[7,9] However, Dalgliesh et al. in their study of young adults found cutoff limit of asymmetry to be 9.3 μm in average RNFL (with 2.5% to 97.5% limits).[30]
The data from previous published studies on normal physiologic asymmetry concluded that although ethnic differences in the thickness of RNFL and ONH parameters may exist, the average degree of interocular symmetry is well preserved.[8,30]
Within the 2.5th and 97.5th percentiles lie 95% of the values, and this range is called the 95% central range. Therefore, the values below the 2.5th and above the 97.5th percentiles represent outliers, and pathology should be considered. Most of the studies in the literature of normative age-matched data had RNFL analysis by including randomly selected eyes or including only right eye or left eye, considering the fact that either eye could be assessed while calculating normative data by OCTs.[9,10,11,12,13,14,15,16] The present study illustrates that normal asymmetry should always be taken consideration while assessing average RNFL, quadrant and 12 sector analysis which could be decisive in diagnosing and management, whenever unilateral optic nerve pathology such as unilateral disc edema, optic neuritis, compressive optic neuropathy, and amblyopia is suspected. Diagnosing pediatric glaucoma suspect, periodical follow-up of suspect cases, and established cases of pediatric glaucoma could be monitored if the ophthalmologist is well aware of this asymmetry in RNFL and ONH parameters.
The clinical judgment of CD ratio can differ from OCT machine values, so clinicians should be cautious while interpreting asymmetry.
The limitations of our study include the relatively small number of subjects. Furthermore, we used only Indian pediatric subjects, so the results may not be applicable to other ethnic populations. However, we have not taken axial length measurement into consideration in our study since we have limited our subjects to only mild and moderate refractive errors, thus excluding high refractive errors. Inclusion of high refractive errors could have an impact on measurements of the RNFL. Hence, our conclusions may not be extrapolated to otherwise normal children with higher refractive errors.
In published literature, various studies evaluated normative data <18 years of age for various commercially available OCTs.[3,4,5,6,7,8,9,10,11,12,13,14,15,16,17,18,19,20] All these studies concluded that measurements provided by each of the existing commercial imaging devices differ, and measurements taken with one device cannot be used interchangeably with measurements from another device. Even the same device with upgraded software could also depict some variations, and moreover, ethnic variations do exist. In the same manner, physiological variation can also occur when different OCT imaging devices are used.
As the number of applications of OCT in pediatric ophthalmology is increasing, it is essential that a normative database of physiologic variations is developed for the Cirrus OCT and ophthalmologist should be extremely cautious when diagnosing disorders and management based on the same.
Conclusions
We have provided here a reference to normative data for Cirrus OCT measurements of RNFL in a normal pediatric population. These measurements were not found to be influenced by the gender of the children. Normal variation in interocular symmetry does exist, which should be taken into consideration when diagnosing any pathology of pediatric retinal disorder, glaucoma, or ONH disorder by OCT.
Financial support and sponsorship
Nil.
Conflicts of interest
There are no conflicts of interest.
Acknowledgments
We would like to acknowledge Biostatistician Miss Ramalakshmi I (MSc Biostatistics) whose statistical expertise was invaluable during the analysis and interpretation of the data
References
- 1.Budenz DL, Anderson DR, Varma R, Schuman J, Cantor L, Savell J, et al. Determinants of normal retinal nerve fiber layer thickness measured by stratus OCT. Ophthalmology. 2007;114:1046–52. doi: 10.1016/j.ophtha.2006.08.046. [DOI] [PMC free article] [PubMed] [Google Scholar]
- 2.Altemir I, Oros D, Elía N, Polo V, Larrosa JM, Pueyo V, et al. Retinal asymmetry in children measured with optical coherence tomography. Am J Ophthalmol. 2013;156:1238–430. doi: 10.1016/j.ajo.2013.07.021. [DOI] [PubMed] [Google Scholar]
- 3.Barrio-Barrio J, Noval S, Galdós M, Ruiz-Canela M, Bonet E, Capote M, et al. Multicenter Spanish study of spectral-domain optical coherence tomography in normal children. Acta Ophthalmol. 2013;91:e56–63. doi: 10.1111/j.1755-3768.2012.02562.x. [DOI] [PubMed] [Google Scholar]
- 4.Dave P, Jethani J, Shah J. Applicability of the ISNT and IST rules on retinal nerve fiber layer measurement on spectral-domain optical coherence tomography in normal Indian children. Graefes Arch Clin Exp Ophthalmol. 2015;253:1795–9. doi: 10.1007/s00417-015-2980-8. [DOI] [PubMed] [Google Scholar]
- 5.Kanamori A, Nakamura M, Tomioka M, Kawaka Y, Yamada Y, Negi A, et al. Agreement among three types of spectral-domain optical coherent tomography instruments in measuring parapapillary retinal nerve fibre layer thickness. Br J Ophthalmol. 2012;96:832–7. doi: 10.1136/bjophthalmol-2011-301084. [DOI] [PubMed] [Google Scholar]
- 6.Ramakrishnan R, Mittal S, Ambatkar S, Kader MA. Retinal nerve fibre layer thickness measurements in normal Indian population by optical coherence tomography. Indian J Ophthalmol. 2006;54:11–5. doi: 10.4103/0301-4738.21608. [DOI] [PubMed] [Google Scholar]
- 7.Huynh SC, Wang XY, Burlutsky G, Mitchell P. Symmetry of optical coherence tomography retinal measurements in young children. Am J Ophthalmol. 2007;143:518–20. doi: 10.1016/j.ajo.2006.09.050. [DOI] [PubMed] [Google Scholar]
- 8.Dave P, Jethani J, Shah J. Asymmetry of retinal nerve fiber layer and posterior pole asymmetry analysis parameters of spectral domain optical coherence tomography in children. Semin Ophthalmol. 2017;32:443–8. doi: 10.3109/08820538.2015.1119857. [DOI] [PubMed] [Google Scholar]
- 9.Huynh SC, Wang XY, Rochtchina E, Crowston JG, Mitchell P. Distribution of optic disc parameters measured by OCT: Findings from a population-based study of 6-year-old Australian children. Invest Ophthalmol Vis Sci. 2006;47:3276–85. doi: 10.1167/iovs.06-0072. [DOI] [PubMed] [Google Scholar]
- 10.Salchow DJ, Oleynikov YS, Chiang MF, Kennedy-Salchow SE, Langton K, Tsai JC, et al. Retinal nerve fiber layer thickness in normal children measured with optical coherence tomography. Ophthalmology. 2006;113:786–91. doi: 10.1016/j.ophtha.2006.01.036. [DOI] [PubMed] [Google Scholar]
- 11.Ahn HC, Son HW, Kim JS, Lee JH. Quantitative analysis of retinal nerve fiber layer thickness of normal children and adolescents. Korean J Ophthalmol. 2005;19:195–200. doi: 10.3341/kjo.2005.19.3.195. [DOI] [PubMed] [Google Scholar]
- 12.Hess DB, Asrani SG, Bhide MG, Enyedi LB, Stinnett SS, Freedman SF, et al. Macular and retinal nerve fiber layer analysis of normal and glaucomatous eyes in children using optical coherence tomography. Am J Ophthalmol. 2005;139:509–17. doi: 10.1016/j.ajo.2004.10.047. [DOI] [PubMed] [Google Scholar]
- 13.Gire J, Cornand E, Fogliarini C, Benso C, Haouchine B, Denis D, et al. Retinal nerve fiber layer in OCT 3: Prospective study of 53 normal children. J Fr Ophtalmol. 2010;33:444–9. doi: 10.1016/j.jfo.2010.06.011. [DOI] [PubMed] [Google Scholar]
- 14.Mrugacz M, Bakunowicz-Lazarczyk A. Optical coherence tomography measurement of the retinal nerve fiber layer in normal and juvenile glaucomatous eyes. Ophthalmologica. 2005;219:80–5. doi: 10.1159/000083265. [DOI] [PubMed] [Google Scholar]
- 15.Peng PH, Lin HS. Retinal nerve fiber layer thickness measured by optical coherence tomography in non-glaucomatous Taiwanese. J Formos Med Assoc. 2008;107:627–34. doi: 10.1016/S0929-6646(08)60180-1. [DOI] [PubMed] [Google Scholar]
- 16.El-Dairi MA, Asrani SG, Enyedi LB, Freedman SF. Optical coherence tomography in the eyes of normal children. Arch Ophthalmol. 2009;127:50–8. doi: 10.1001/archophthalmol.2008.553. [DOI] [PubMed] [Google Scholar]
- 17.Leung MM, Huang RY, Lam AK. Retinal nerve fiber layer thickness in normal Hong Kong Chinese children measured with optical coherence tomography. J Glaucoma. 2010;19:95–9. doi: 10.1097/IJG.0b013e3181a98cfa. [DOI] [PubMed] [Google Scholar]
- 18.Samarawickrama C, Wang JJ, Huynh SC, Pai A, Burlutsky G, Rose KA, et al. Ethnic differences in optic nerve head and retinal nerve fibre layer thickness parameters in children. Br J Ophthalmol. 2010;94:871–6. doi: 10.1136/bjo.2009.158279. [DOI] [PubMed] [Google Scholar]
- 19.Qian J, Wang W, Zhang X, Wang F, Jiang Y, Wang W, et al. Optical coherence tomography measurements of retinal nerve fiber layer thickness in Chinese children and teenagers. J Glaucoma. 2011;20:509–13. doi: 10.1097/IJG.0b013e3181f7b16c. [DOI] [PubMed] [Google Scholar]
- 20.Gupta G, Donahue JP, You T. Profile of the retina by optical coherence tomography in the pediatric age group. Am J Ophthalmol. 2007;144:309–10. doi: 10.1016/j.ajo.2007.03.029. [DOI] [PubMed] [Google Scholar]
- 21.Tsai DC, Huang N, Hwu JJ, Jueng RN, Chou P. Estimating retinal nerve fiber layer thickness in normal schoolchildren with spectral-domain optical coherence tomography. Jpn J Ophthalmol. 2012;56:362–70. doi: 10.1007/s10384-012-0142-7. [DOI] [PubMed] [Google Scholar]
- 22.Elía N, Pueyo V, Altemir I, Oros D, Pablo LE. Normal reference ranges of optical coherence tomography parameters in childhood. Br J Ophthalmol. 2012;96:665–70. doi: 10.1136/bjophthalmol-2011-300916. [DOI] [PubMed] [Google Scholar]
- 23.Zhu BD, Li SM, Li H, Liu LR, Wang Y, Yang Z, et al. Retinal nerve fiber layer thickness in a population of 12-year-old children in central china measured by iVue-100 spectral-domain optical coherence tomography: The Anyang childhood eye study. Invest Ophthalmol Vis Sci. 2013;54:8104–11. doi: 10.1167/iovs.13-11958. [DOI] [PubMed] [Google Scholar]
- 24.Turk A, Ceylan OM, Arici C, Keskin S, Erdurman C, Durukan AH, et al. Evaluation of the nerve fiber layer and macula in the eyes of healthy children using spectral-domain optical coherence tomography. Am J Ophthalmol. 2012;153:552–90. doi: 10.1016/j.ajo.2011.08.026. [DOI] [PubMed] [Google Scholar]
- 25.Yanni SE, Wang J, Cheng CS, Locke KI, Wen Y, Birch DG, et al. Normative reference ranges for the retinal nerve fiber layer, macula, and retinal layer thicknesses in children. Am J Ophthalmol. 2013;155:354–600. doi: 10.1016/j.ajo.2012.08.010. [DOI] [PMC free article] [PubMed] [Google Scholar]
- 26.Rao A, Sahoo B, Kumar M, Varshney G, Kumar R. Retinal nerve fiber layer thickness in children and lt; 18 years by spectral-domain optical coherence tomography. Semin Ophthalmol. 2013;28:97–102. doi: 10.3109/08820538.2012.760626. [DOI] [PubMed] [Google Scholar]
- 27.Chen L, Huang J, Zou H, Xue W, Ma Y, He X, et al. Retinal nerve fiber layer thickness in normal Chinese students aged 6 to 17 years. Invest Ophthalmol Vis Sci. 2013;54:7990–7. doi: 10.1167/iovs.12-11252. [DOI] [PubMed] [Google Scholar]
- 28.Pawar N, Maheshwari D, Ravindran M, Ramakrishnan R. Retinal nerve fiber layer thickness in normal Indian pediatric population measured with optical coherence tomography. Indian J Ophthalmol. 2014;62:412–8. doi: 10.4103/0301-4738.121185. [DOI] [PMC free article] [PubMed] [Google Scholar]
- 29.Al-Haddad C, Antonios R, Tamim H, Noureddin B. Interocular symmetry in retinal and optic nerve parameters in children as measured by spectral domain optical coherence tomography. Br J Ophthalmol. 2014;98:502–6. doi: 10.1136/bjophthalmol-2013-304345. [DOI] [PubMed] [Google Scholar]
- 30.Dalgliesh JD, Tariq YM, Burlutsky G, Mitchell P. Symmetry of retinal parameters measured by spectral-domain OCT in normal young adults. J Glaucoma. 2015;24:20–4. doi: 10.1097/IJG.0b013e318287ac2f. [DOI] [PubMed] [Google Scholar]
- 31.Mwanza JC, Durbin MK, Budenz DL. Cirrus OCT Normative Database Study Group. Interocular symmetry in peripapillary retinal nerve fiber layer thickness measured with the Cirrus HD-OCT in healthy eyes. Am J Ophthalmol. 2011;151:514–21. doi: 10.1016/j.ajo.2010.09.015. [DOI] [PMC free article] [PubMed] [Google Scholar]