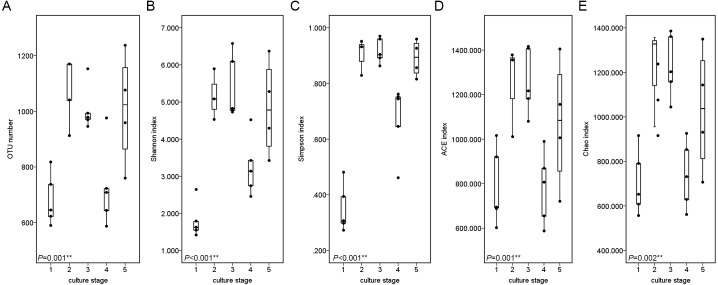
Figure 4. Boxplots figure of shows the range of different alpha diversity index.
The Boxplots figure showed there was significant difference at different culture stages of OTU number (A), Shannon index (B), Simpson index (C), ACE index (D) and Chao index (E). The asterisk represents that there is significant difference in groups by ANOVA (P value < 0.05). The two-asterisk represents that there is extremely significant difference in groups (P value < 0.01).

