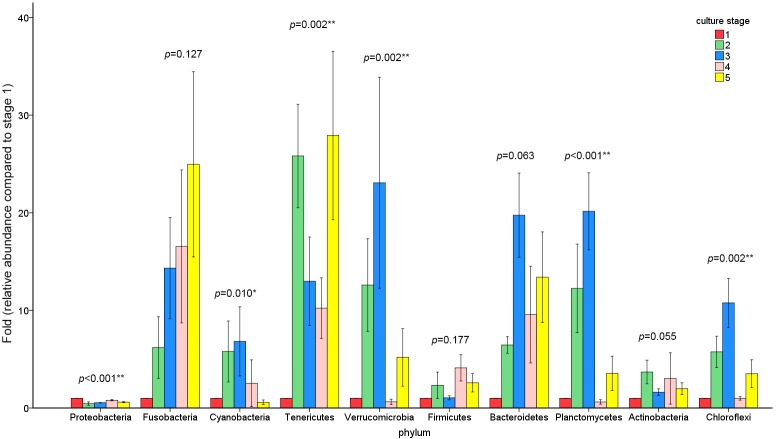
Figure 5. The abundance of the top 10 phyla at different culture stages.
The relative abundance of each phyla at 5 culture stages is shown. The abundance of stage1 was given value 1 and the other stages were given the relative abundance compared to stage 1. The asterisk represents that there is significant difference in groups by PerMANOVA (P value < 0.05). The two-asterisk represents that there is extremely significant difference in groups (P value < 0.01).

