

Abstract
As part of human evolutionary development, many human organ systems have innate mechanisms to adapt to increased “work demand” or stress. This reserve capacity can be informative and is used commonly in cardiology to assess cardiac function (e.g., treadmill test). Similarly, the kidney possesses reserve capacity, which can be demonstrated in at least 2 of the following renal domains: glomerular and tubular. When appropriate stimulants are used, healthy patients with intact kidneys can significantly increase their glomerular filtration rate and their tubular secretion. This approach has been used to develop diagnostics for the assessment of renal function. This article reviews both glomerular and tubular kidney stress tests and their respective diagnostic utility.
Keywords: acute kidney injury, chronic kidney disease, furosemide stress test, glomerular filtration, kidney stress test, maximum GFR
As part of human evolutionary development, many human organ systems have innate mechanisms to adapt to increased “work demand” or stress. At rest, organ systems operate at baseline capacity, and this capacity can be increased to a certain maximum capacity. A familiar example of this concept is cardiac function. In a healthy person at rest, cardiac output is approximately 5.0 liters/min. However, when a healthy person exercises, the cardiac output can double or even triple. Similarly, the kidney has reserve capacity of its multiple physiological functions (Figure 1). The ability to test the reserve of an organ system is often an excellent diagnostic tool to uncover subclinical disease (e.g., treadmill test). Similarly, stress testing of the kidney appears to generate insights into the presence or absence of kidney disease and parenchymal loss due to injury and potentially fibrosis. The 2 main domains of kidney stress testing are glomerular and tubular. In a healthy kidney, these 2 components of the nephron work in concert. However, when the kidney is diseased or injured, the glomerular and tubular function may be affected equally, or their form and functional capacity may diverge. An assessment of both glomerular and tubular function may be more informative than just 1 of these domains. Glomerular reserve testing has been well established but is used infrequently in routine clinical care. Tubular function diagnostic testing is relatively new and in its clinical “infancy.” However, tubular assessment appears to hold significant promise for the assessment of both chronic and acute kidney disease.
Figure 1.
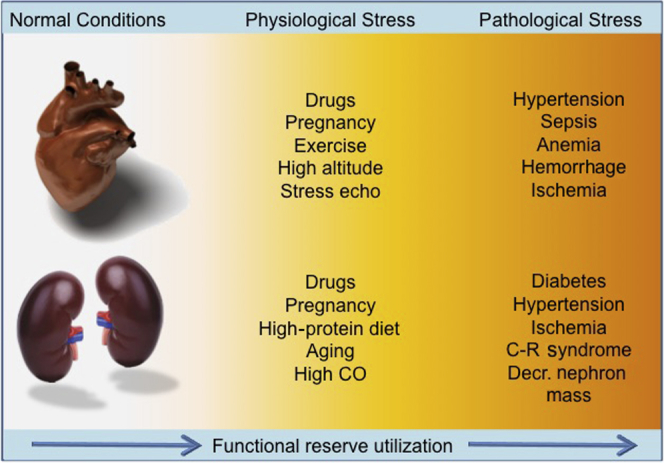
Comparison of stressors in the heart and kidney. C-R, cardiorenal.
Renal Functional Reserve–Glomerular
Because of the common use of estimated glomerular filtration rate (GFR) equations, there is a tendency for non-nephrologists to think that the GFR is a constant. In fact, the actual GFR changes throughout the day, particularly after meals, based on physiological needs.1 One of the kidney’s primary roles is to effectively remove nitrogenous waste, and as a consequence, the consumption and metabolism of protein results in an increase in GFR.2 GFR can also be increased through other mechanisms that work along the protein metabolic pathway. For instance, an i.v. infusion of amino acids will result in an increase in GFR.3 This increase in GFR over baseline GFR is known as renal functional reserve–glomerular (RFR-G).4 Protein ingestion, particularly red meat, is a potent stimulant for increasing GFR, and the teleologic explanation is likely related to an adaptive response to increased protein in the diet.5
Bosch and colleagues first described glomerular functional reserve (RFR-G) in 1983.4 In this seminal paper, Bosch and colleagues demonstrated that the consumption of protein, not carbohydrates or fat, results in a substantial increase in GFR in patients with healthy kidneys. Multiple subsequent studies have confirmed these findings. The clinical implications of RFR-G will be reviewed.
Baseline (Unstressed) GFR
GFR is normally utilized as a surrogate of kidney function in healthy subjects as well as in patients with kidney disease. Studies in healthy subjects under the age of 50 have identified the average baseline normal values of GFR to be between 100 and 130 ml/min per 1.73 m2.6 Evaluation of population-wide “normal” values is useful, but the concept of “normal” GFR in the single individual is more nuanced. It is important to recognize that a person’s GFR at any given point in time will vary in relation to the physiological demands of dietary and hemodynamic conditions. Baseline value for GFR (bGFR) also depends on age, sex, and body size, with considerable variation among healthy individuals. Overall, the average daily GFR is remarkably stable over years, although there is an age-related decline in GFR physiologically by 0.8 ml/min per 1.73 m2 per year, after the age of 30 years.6, 7
In general, serum creatinine tends to remain relatively normal even in the presence of kidney damage, until approximately 50% of nephrons are lost or simply when bGFR approaches 60 ml/min per 1.73 m2 (Figure 2).8 For this reason serum creatinine cannot be considered an accurate marker of renal function when GFR is above 60 ml/min per 1.73 m2. Similarly, GFR estimation (eGFR) by creatinine-derived equations (e.g., MDRD9) cannot be considered a sensitive index for early detection of renal disease during the early phases of parenchymal damage. A good example of this can be seen in patients who donate a kidney; despite a halving of their nephron mass, their serum creatinine and calculated eGFR are “normal.”10 Therefore, when renal disease becomes apparent due to an elevated serum creatinine, this occurs only after the residual nephrons can no longer compensate for the functional loss (Figure 3).8
Figure 2.
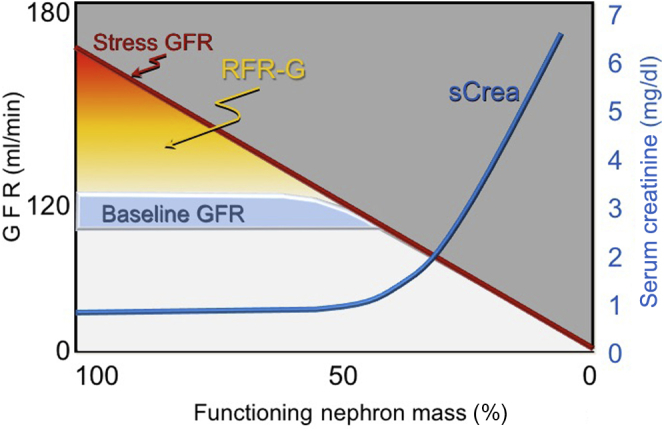
Relationship between glomerular filtration rate (GFR) and serum creatinine changes. RFR-G, renal functional reserve–glomerular.
Figure 3.
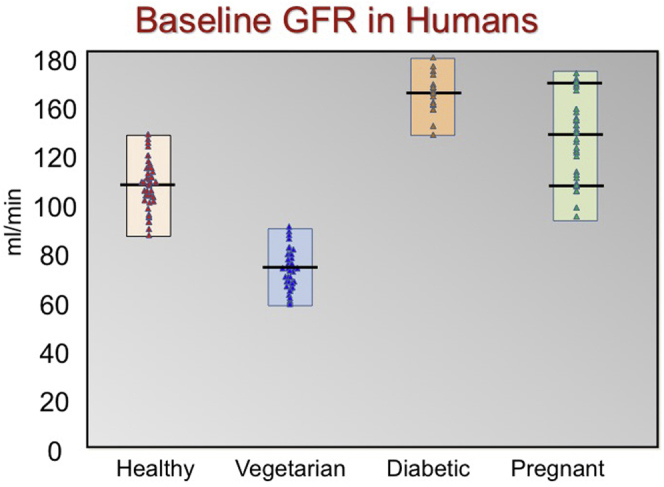
Variation in baseline glomerular filtration rate (GFR).
Renal Functional Reserve (RFR-G)
Normal subjects display a significant increase in GFR 1 or 2 hours after an acute protein load (1–1.2 g/kg) over their baseline GFR. The difference between peak or “maximum” GFR (maxGFR) and baseline GFR describes the renal functional reserve of glomerular function (RFR-G). Fliser and colleagues11 compared the baseline and maxGFR in young and elderly healthy subjects and found that RFR was significantly lower in elderly than in young healthy individuals while virtually all baseline GFR values of elderly were within the reference range. The renal reserve as assessed by RFR-G is a measure of the kidney’s capacity to increase GFR by a combination of nephron recruitment and increases in renal blood flow coupled with hyperfiltration.12, 13, 14, 15
The stimulus to tap into this reserve capacity can arise from adaptive physiological needs like pregnancy or the presence of a solitary kidney. Utilization of RFR in non-disease states is best illustrated by pregnancy. In pregnancy, GFR significantly increases during each trimester, such that there is a significant rise in bGFR from first to last trimester. Studies done on normal pregnant women in each trimester have shown a progressive increase of baseline GFR with a parallel reduction of RFR due to its progressive utilization.13 MaxGFR in normal pregnant women, however, does not change. However, pathological states can also initiate processes that increase GFR above the normal baseline. Primary hyperfiltration in kidney disease has been shown in patients with diabetes mellitus, polycystic kidney disease, secondary focal segmental glomerulosclerosis, sickle cell anemia, high-altitude renal syndrome, obesity, hypertension, nephrotic syndromes, and glomerulonephritis.16 In physiological states of diminished RFR, the observed hyperfiltration is likely due to recruitment of more nephron units, whereas in pathological states, hyperfiltration is probably due to an increase in single nephron filtration fraction. This, in part, is the basis of angiotensin II blockade in chronic kidney disease (CKD), and is often demonstrable by a drop in GFR when angiotensin-converting enzyme inhibitors are given to patients with CKD.
A current limitation on the use of RFR-G assessment is that these assessments have not been conducted in large cross-sectional cohorts, thus the population variability of the RFR response is not known. Several investigators have estimated RFR by measuring the difference between protein-stimulated GFR and baseline GFR after a protein load.4 In a separate study,17 Bosch and colleagues demonstrated the estimation of RFR by a short-term oral protein loading method. De Nicola and colleagues18 demonstrated that the estimation of RFR can be assessed by amino acid infusion.
Numerous mechanisms have been hypothesized for the increase in GFR after protein load. In their study, Woods and colleagues19 hypothesized that protein loading increases GFR because digested protein raises plasma amino acid levels, which are then filtered at the glomerulus, thereby stimulating proximal tubular absorption. In addition, filtered amino acids change the sensitivity of macula densa sensing mechanisms, causing release of nitric oxide and prostaglandins locally resulting in vasodilation, increasing renal blood flow and GFR. In our own laboratory we analyzed the response to acute protein loading, and we detected an increase in GFR proportional to an increase in renal blood flow with a constant of filtration fraction. This observation seems to support the hypothesis that an overall increase in blood flow is the main mechanism rather than a temporary hemodynamic perturbation in the afferent and efferent tone and equilibrium (C. Ronco and colleagues, unpublished data).
Stress testing with a protein load is the definitive way to assess for the loss of RFR-G, but the significance of renal reserve is not just a diagnostic consideration. It is important to recognize that the loss of renal reserve may also manifest as a loss in autoregulation capacity in the kidney. This loss of autoregulation may increase the vulnerability of those patients with CKD to volume depletion and certain nephrotoxins (e.g., nonsteroidal anti-inflammatory drugs). Population studies suggest that increased creatinine variability, which could be due to the loss of autoregulation, predicts progression to end-stage renal disease.20
Kidney Stress Testing of GFR in Clinical Practice and Future Research
Assuming RFR-G represents the difference between maximal filtration capacity of the kidney (maxGFR) and the baseline GFR (bGFR), a protein load is the basis of a kidney stress test forcing the kidneys to utilize the entire filtration capacity. This technique can be used to “reveal” subclinical kidney disease. MaxGFR and bGFR assessment with protein loading has been extensively studied and can be used in the clinic to assess RFR-G in patients with kidney disease.4, 8, 13, 14 Because dietary protein raises GFR, establishing bGFR is important when attempting to assess RFR-G; developing standardized protocols to accomplish this is an important research recommendation. There is another approach that would allow single GFR assessment instead of having to conduct a baseline and a stimulated stress test. In this approach, the maxGFR would be assessed among healthy patients across a wide age range, ethnic range, and in both genders. Once these data were known, then normative values could be determined for maxGFR. These data would be used for diagnostic purposes for patients who underwent a kidney stress test to achieve maxGFR. Those patients who could not achieve the appropriate maxGFR adjusted for age, gender, and race could be referred for further work-up.
As part of a future research plan, the safety of repeated protein loading in patients with CKD should also be assessed. Since protein is a stimulant for GFR, the effects of repeated protein loading in patients with CKD is unknown. The exposure of repeated high levels of protein in patients with CKD might be deleterious, but might also “condition” the kidney as well and stimulate restorative or protective effects—this concept should be studied further.
The idea of assessing renal reserve has been present for decades, but is infrequently used in clinical practice, whereas the cardiac stress test is used routinely. Why is this the case? In our view, the simple reason is that cardiologists perceive that they can intervene on patients with diminished cardiac reserve (e.g., heart failure treatment), whereas the nephrology community may not feel that an intervention is available, and therefore may be unwilling to perform an extra test. We hypothesize that patients with loss of renal reserve are at risk for CKD. Future trials should assess whether early identification of diminished renal reserve can reliably predict the risk of progression to CKD. If this can be shown, early screening of renal reserve may prompt early intervention and forestall the development of CKD.
Tubular Function Assessment in Kidney Disease
The renal tubule portion of the nephron is tasked with an enormous portfolio of responsibilities. Chief among those chores are the handling of electrolytes, water, and amino acids, catabolism of various proteins, and the active secretion of endogenous and exogenous acids. Tubular function assessment may be more informative than glomerular reserve in patients who already have advanced kidney disease. When patients do not have obvious kidney disease, the loss of glomerular reserve (RFR-G) can be an indicator of loss of nephron mass.8 However, once a patient has kidney injury or disease, glomerular reserve is already substantially reduced and therefore is less informative.
In patients with decreased GFR, tubular function appears to be more variable. One reason for this observation may be due to renal fibrosis. During the assessment of kidney disease by tissue biopsy, the level of interstitial fibrosis is one of the strongest predictors of renal survival.21, 22 Interstitial fibrosis can represent scarred tubules that are fibrosed, or the secretion of matrix that fills in between the nephrons, or both of these. However, because CKD is generally marked by a reduction of kidney size, this makes the possibility of “extra” matrix an unlikely sole explanation for fibrosis (an exception to this would be multiple myeloma). In most forms of kidney disease, the kidneys shrink and become more echogenic over time. Based on this observation, we believe that it is more likely that diseased tubules are replaced by matrix and fibrosis. In order to test the notion that tubular function may identify patients who are at increased risk for worse outcomes, various studies in patients with both acute and chronic kidney disease have been conducted to determine the utility of tubular secretion capacity to predict outcomes.23, 24
Different aspects of tubular function can be interrogated in various ways depending on what feature of tubular function is being assessed. For instance, the tubule’s capacity to secrete acid or sodium can be assessed via acid or salt loading. The tubule’s concentrating capacity can be assessed via water deprivation or exogenous administration of desmopressin (DDAVP). Among these different techniques, thus far the primary methodology to assess tubular functional capacity in patients with kidney disease has been via tubular secretion of either creatinine or an exogenous drug (e.g., furosemide).
Tubular Function Assessment in CKD
The first studies of tubular functional capacity in patients with CKD utilized the difference between creatinine clearance and inulin clearance as an assessment of tubular function. Herrera and colleagues24 developed an elegant study to demonstrate the potential use of tubular secretion. In this study, the investigators took the following 3 cohorts of patients: normal, renal allograft donors (uni-nephrectomized), and CKD. In these subjects, baseline creatinine clearance and inulin-based GFR were measured and then reassessed after a protein meal. They found that both healthy patients and patients with CKD were able to increase their inulin-measured GFR in response to a protein meal; as expected, healthy patients could increase their GFR after stimulation much more than CKD patients. Similarly, healthy patients were able to increase their tubular secretion of creatinine (TScr), but CKD patients were unable to increase their TScr. When all 3 groups of patients were compared, uni-nephrectomized patients were able to increase their TScr (but to a lesser degree than normal healthy subjects), while CKD patients were unable to increase their TScr. These data are consistent with previous studies that show that patients with CKD maintain some glomerular renal reserve at all levels of baseline GFR.8 In addition, this study demonstrated that CKD patients likely operate at near their maximum TScr, and thus are less able to increase their TScr when challenged with a protein meal.
In a second trial, this same group of investigators assessed TScr by infusing i.v. creatinine into normal subjects and kidney transplant recipients.25 They found that creatinine infusion did not increase GFR, and that an infusion of i.v. creatinine resulted in an increased TScr in healthy patients, but not in kidney transplant recipients. Thus, a tubular functional assessment with a challenge of i.v. creatinine had the capacity to reveal the subjects with decreased nephron mass who otherwise had normal serum creatinine levels.
In aggregate, preliminary studies suggest that tubular stress tests that measure the secretory capacity of the renal tubule are informative and predictive of outcomes.23, 24, 25, 26 However, it should be noted that tubular stress tests remain research tools and have not yet been deployed into the clinic for CKD.
Tubular Assessment in Acute Kidney Injury
The aforementioned studies in CKD used creatinine secretion to assess tubular functional assessment. In patients with acute kidney injury (AKI), many factors, including lack of steady state, increased catabolism, and concurrent medications that interfere with creatinine secretion, preclude the use of TScr as a reliable measure of tubular secretion. One approach uses i.v. furosemide to assess tubular function. Furosemide, a loop diuretic, has pharmacokinetic properties that make it an appealing functional tool. In contrast to other drugs cleared by the kidney, furosemide is not effectively filtered by the glomerulus. As an organic acid, furosemide is tightly bound to albumin and gains access to the tubular lumen by active secretion via the human organic anion transporter system in the proximal convoluted tubule.27, 28 Once in the tubular lumen, furosemide blocks luminal cation–chloride cotransport throughout the thick ascending limb of Henle, thereby preventing sodium reabsorption and resulting in natriuresis and increased urine flow.29, 30, 31 Based on these properties, furosemide-induced increases in urine output represent a methodology to assess the integrity of the renal tubular function in the setting of AKI. This methodology was developed by Chawla and colleagues23 and is referred to as the furosemide stress test (FST).
The FST has been prospectively assessed in a single cohort study of critically ill patients with AKI and was found to have good diagnostic performance. In that study, Chawla and colleagues23 administered a standard dose of i.v. furosemide (1.0–1.5 mg/kg) to critically ill patients with Kidney Disease: Improving Global Outcomes (KDIGO) stage I or stage II AKI and then assessed the urine output response. This study showed that the 2-hour urine output response to a furosemide challenge was able to predict progression to KDIGO stage III within 14 days with a receiver operating characteristic area under the curve of 0.87 (SE, 0.05). At a cutoff of 200 cm3 at 2 hours, the sensitivity and specificity of the FST were 87.1% and 84.1%, respectively.23 In a follow-up study of the same cohort, the same research group showed that FST performed better than known AKI biomarkers. Importantly, the follow-up study demonstrated that the FST performance improves when utilized in patients with increased levels of AKI biomarkers.32 These data suggest that the combination of AKI biomarkers with tubular functional assessment is informative, and can be used at the bedside to assist clinicians in assessing the severity of AKI. It remains unclear whether the FST reveals the severity of AKI, or the loss of tubular functional capacity. An important caveat to the FST is that the subject must be euvolemic for the test to be safe and valid, and any volume losses induced by the diuresis should be replaced.
A version of the FST has also been analyzed in patients with advanced-stage AKI requiring renal replacement therapy to determine whether a standardized furosemide challenge can predict renal recovery. van der Voort and colleagues reported that a standardized 4-hour infusion of furosemide was also an excellent predictor of renal recovery.26, 33 This analysis was a post hoc assessment of a randomized clinical trial, which compared a 4-hour infusion of furosemide to placebo as an intervention to promote renal recovery in patients who are on continuous renal replacement therapy. In this post hoc analysis, the authors assessed the intervention arm of the trial (i.e., the patients randomized to furosemide) and found that the mean urine output was much higher in patients destined to recover (654 ml vs. 48 ml, P = 0.007) and had a diagnostic performance receiver operating characteristic area under the curve of 0.84. These 2 studies demonstrate that the urine output response to furosemide is informative about renal tubular function throughout the phases of AKI (progression and recovery). Another advantage of the FST is that it does not just measure the tubule’s secretion capacity, but is actually an assessment of integrated renal function34 (Figure 4). In order for furosemide to increase urine output, furosemide must be actively secreted into the proximal lumen, and the thick ascending limb, luminal patency, and collecting duct function must all be intact.35 Because the FST requires an intact nephron for full function, the FST does not readily identify the location of the defect in cases in which the FST response is poor.
Figure 4.
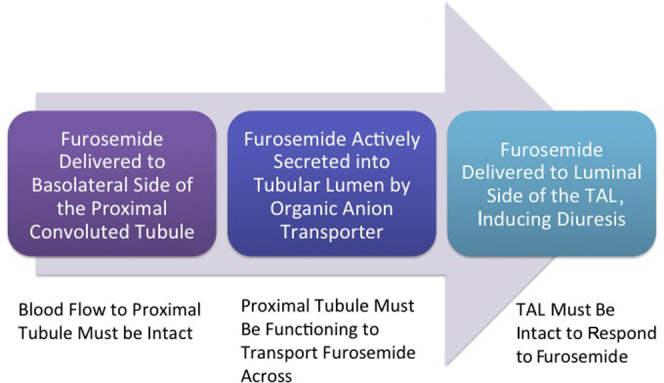
Furosemide urinary response tests tubular integrity. TAL, thick ascending limb.
The aforementioned studies of FST are of modest size and are currently undergoing larger-scale validation (NCT 01275729). However, the FST is based on the bedside practice of many clinicians, which involves challenging patients with a loop diuretic and assessing the clinical response. The FST, as currently devised, is simply a framework around this common bedside practice. The FST is also being assessed by the 0 by 25 initiative spearheaded by the International Society of Nephrology. In an austere medical environment, simple diagnostic tools like serum urea and creatinine are not readily available. Thus, the use of FST in euvolemic patients with oliguria may allow a thoughtful way to triage patients who may need more advanced care. Because furosemide is inexpensive and available worldwide, this physiological assessment may allow for broader use of this diagnostic approach.
Summary
Kidney stress testing can be accomplished by assessing glomerular and tubular domains. These assessments are safe and relatively inexpensive and can be done at the bedside or in the clinic. Importantly, these assessments have been shown to be informative in both acute and chronic kidney disease. However, neither of these stress tests is currently used routinely at the bedside or the clinic. Assessment of RFR-G can and, in the opinion of these authors, should be used to reveal the loss of RFR in patients at risk for kidney disease. Tubular functional testing has been less developed; early studies demonstrate good diagnostic performance, but large validation studies are still needed. Because tubular testing may have the capacity to assess multiple anatomic domains of the nephron, we believe that noninvasive kidney stress testing may allow clinicians to phenotype, prognosticate, and better follow patients with kidney disease. Further research into the appropriate use of these diagnostic techniques is warranted.
Disclosure
LSC has received consulting fees from Astute Medical. The other author declared no competing interests.
References
- 1.Koopman M.G., Koomen G.C., Krediet R.T. Circadian rhythm of glomerular filtration rate in normal individuals. Clin Sci. 1989;77:105–111. doi: 10.1042/cs0770105. [DOI] [PubMed] [Google Scholar]
- 2.Brenner B.M., Meyer T.W., Hostetter T.H. Dietary protein intake and the progressive nature of kidney disease: the role of hemodynamically mediated glomerular injury in the pathogenesis of progressive glomerular sclerosis in aging, renal ablation, and intrinsic renal disease. N Engl J Med. 1982;307:652–659. doi: 10.1056/NEJM198209093071104. [DOI] [PubMed] [Google Scholar]
- 3.Graf H., Stummvoll H.K., Luger A., Prager R. Effect of amino acid infusion on glomerular filtration rate. N Engl J Med. 1983;308:159–160. doi: 10.1056/NEJM198301203080318. [DOI] [PubMed] [Google Scholar]
- 4.Bosch J.P., Saccaggi A., Lauer A. Renal functional reserve in humans. Effect of protein intake on glomerular filtration rate. Am J Med. 1983;75:943–950. doi: 10.1016/0002-9343(83)90873-2. [DOI] [PubMed] [Google Scholar]
- 5.Hostetter T.H. Human renal response to meat meal. Am J Physiol. 1986;250:F613–F618. doi: 10.1152/ajprenal.1986.250.4.F613. [DOI] [PubMed] [Google Scholar]
- 6.Delanaye P., Schaeffner E., Ebert N. Normal reference values for glomerular filtration rate: what do we really know? Nephrol Dial Transplant. 2012;27:2664–2672. doi: 10.1093/ndt/gfs265. [DOI] [PubMed] [Google Scholar]
- 7.Davies D.F., Shock N.W. Age changes in glomerular filtration rate, effective renal plasma flow, and tubular excretory capacity in adult males. J Clin Invest. 1950;29:496–507. doi: 10.1172/JCI102286. [DOI] [PMC free article] [PubMed] [Google Scholar]
- 8.Barai S., Gambhir S., Prasad N. Functional renal reserve capacity in different stages of chronic kidney disease. Nephrology. 2010;15:350–353. doi: 10.1111/j.1440-1797.2010.01291.x. [DOI] [PubMed] [Google Scholar]
- 9.Levey A.S., Bosch J.P., Lewis J.B. A more accurate method to estimate glomerular filtration rate from serum creatinine: a new prediction equation. Modification of Diet in Renal Disease Study Group. Ann Intern Med. 1999;130:461–470. doi: 10.7326/0003-4819-130-6-199903160-00002. [DOI] [PubMed] [Google Scholar]
- 10.Tsuda A., Ishimura E., Uedono H. Comparison of the estimated glomerular filtration rate (eGFR) in diabetic patients, non-diabetic patients and living kidney donors. Kidney Blood Press Res. 2016;41:40–47. doi: 10.1159/000368545. [DOI] [PubMed] [Google Scholar]
- 11.Fliser D., Zeier M., Nowack R., Ritz E. Renal functional reserve in healthy elderly subjects. J Am Soc Nephrol. 1993;3:1371–1377. doi: 10.1681/ASN.V371371. [DOI] [PubMed] [Google Scholar]
- 12.Bosch J.P., Lew S., Glabman S., Lauer A. Renal hemodynamic changes in humans. Response to protein loading in normal and diseased kidneys. Am J Med. 1986;81:809–815. doi: 10.1016/0002-9343(86)90350-5. [DOI] [PubMed] [Google Scholar]
- 13.Ronco C., Brendolan A., Bragantini L. Renal functional reserve in pregnancy. Nephrol Dial Transplant. 1988;3:157–161. [PubMed] [Google Scholar]
- 14.Pecly I.M., Genelhu V., Francischetti E.A. Renal functional reserve in obesity hypertension. Int J Clin Pract. 2006;60:1198–1203. doi: 10.1111/j.1742-1241.2006.01037.x. [DOI] [PubMed] [Google Scholar]
- 15.Zitta S., Stoschitzky K., Zweiker R. Dynamic renal function testing by compartmental analysis: assessment of renal functional reserve in essential hypertension. Nephrol Dial Transplant. 2000;15:1162–1169. doi: 10.1093/ndt/15.8.1162. [DOI] [PubMed] [Google Scholar]
- 16.Cachat F., Combescure C., Cauderay M. A systematic review of glomerular hyperfiltration assessment and definition in the medical literature. Clin J Am Soc Nephrol. 2015;10:382–389. doi: 10.2215/CJN.03080314. [DOI] [PMC free article] [PubMed] [Google Scholar]
- 17.Bosch J.P., Lauer A., Glabman S. Short-term protein loading in assessment of patients with renal disease. Am J Med. 1984;77:873–879. doi: 10.1016/0002-9343(84)90529-1. [DOI] [PubMed] [Google Scholar]
- 18.De Nicola L., Blantz R.C., Gabbai F.B. Renal functional reserve in treated and untreated hypertensive rats. Kidney Int. 1991;40:406–412. doi: 10.1038/ki.1991.226. [DOI] [PubMed] [Google Scholar]
- 19.Woods L.L. Mechanisms of renal hemodynamic regulation in response to protein feeding. Kidney Int. 1993;44:659–675. doi: 10.1038/ki.1993.299. [DOI] [PubMed] [Google Scholar]
- 20.O'Hare A.M., Batten A., Burrows N.R. Trajectories of kidney function decline in the 2 years before initiation of long-term dialysis. Am J Kidney Dis. 2012;59:513–522. doi: 10.1053/j.ajkd.2011.11.044. [DOI] [PMC free article] [PubMed] [Google Scholar]
- 21.Bohle A., Grund K.E., Mackensen S., Tolon M. Correlations between renal interstitium and level of serum creatinine. Morphometric investigations of biopsies in perimembranous glomerulonephritis. Virchows Arch A Pathol Anat Histol. 1977;373:15–22. doi: 10.1007/BF00432465. [DOI] [PubMed] [Google Scholar]
- 22.Mackensen-Haen S., Bader R., Grund K.E., Bohle A. Correlations between renal cortical interstitial fibrosis, atrophy of the proximal tubules and impairment of the glomerular filtration rate. Clin Nephrol. 1981;15:167–171. [PubMed] [Google Scholar]
- 23.Chawla L.S., Davison D.L., Brasha-Mitchell E. Development and standardization of a furosemide stress test to predict the severity of acute kidney injury. Crit Care. 2013;17:R207. doi: 10.1186/cc13015. [DOI] [PMC free article] [PubMed] [Google Scholar]
- 24.Herrera J., Rodriguez-Iturbe B. Stimulation of tubular secretion of creatinine in health and in conditions associated with reduced nephron mass. Evidence for a tubular functional reserve. Nephrol Dial Transplant. 1998;13:623–629. doi: 10.1093/ndt/13.3.623. [DOI] [PubMed] [Google Scholar]
- 25.Rodriguez-Iturbe B., Herrera J., Marin C., Manalich R. Tubular stress test detects subclinical reduction in renal functioning mass. Kidney Int. 2001;59:1094–1102. doi: 10.1046/j.1523-1755.2001.0590031094.x. [DOI] [PubMed] [Google Scholar]
- 26.van der Voort P.H., Boerma E.C., Pickkers P. The furosemide stress test to predict renal function after continuous renal replacement therapy. Crit Care. 2014;18:429. doi: 10.1186/cc13871. [DOI] [PMC free article] [PubMed] [Google Scholar]
- 27.Hasannejad H., Takeda M., Taki K. Interactions of human organic anion transporters with diuretics. J Pharmacol Exp Ther. 2004;308:1021–1029. doi: 10.1124/jpet.103.059139. [DOI] [PubMed] [Google Scholar]
- 28.Bowman R.H. Renal secretion of [35-S]furosemide and depression by albumin binding. Am J Physiol. 1975;229:93–98. doi: 10.1152/ajplegacy.1975.229.1.93. [DOI] [PubMed] [Google Scholar]
- 29.Burg M., Stoner L., Cardinal J., Green N. Furosemide effect on isolated perfused tubules. Am J Physiol. 1973;225:119–124. doi: 10.1152/ajplegacy.1973.225.1.119. [DOI] [PubMed] [Google Scholar]
- 30.Dirks J.H., Seely J.F. Effect of saline infusions and furosemide on the dog distal nephron. Am J Physiol. 1970;219:114–121. doi: 10.1152/ajplegacy.1970.219.1.114. [DOI] [PubMed] [Google Scholar]
- 31.Brater D.C., Anderson S.A., Strowig S. Azosemide, a “loop” diuretic, and furosemide. Clin Pharmacol Ther. 1979;25:435–439. doi: 10.1002/cpt1979254435. [DOI] [PubMed] [Google Scholar]
- 32.Koyner J.L., Davison D.L., Brasha-Mitchell E. Furosemide stress test and biomarkers for the prediction of AKI severity. J Am Soc Nephrol. 2015;26:2023–2031. doi: 10.1681/ASN.2014060535. [DOI] [PMC free article] [PubMed] [Google Scholar]
- 33.van der Voort P.H., Boerma E.C., Koopmans M. Furosemide does not improve renal recovery after hemofiltration for acute renal failure in critically ill patients: a double blind randomized controlled trial. Crit Care Med. 2009;37:533–538. doi: 10.1097/CCM.0b013e318195424d. [DOI] [PubMed] [Google Scholar]
- 34.Powell T.C., Warnock D.G. The furosemide stress test and predicting AKI outcomes. J Am Soc Nephrol. 2015;26:1762–1764. doi: 10.1681/ASN.2014121160. [DOI] [PMC free article] [PubMed] [Google Scholar]
- 35.Berger B.E., Warnock D.G. Mechanisms of action and clinical uses of diuretics. In: Brenner BM, editor. The Kidney. 3rd ed. W.B. Saunders; Philadelphia: 1986. pp. 433–456. [Google Scholar]