

Abstract
Purpose
Tumor mutational burden detected by tissue next generation sequencing (NGS) correlates with checkpoint inhibitor response. However, tissue biopsy may be costly and invasive. We sought to investigate the association between hyper-mutated blood-derived circulating tumor DNA (ctDNA) and checkpoint inhibitor response.
Experimental Design
We assessed 69 patients with diverse malignancies who received checkpoint inhibitor-based immunotherapy and blood-derived circulating tumor DNA (ctDNA) NGS testing (54–70 genes). Rates of stable disease (SD) ≥6 months, partial and complete response (PR, CR), as well as progression-free survival (PFS) and overall survival (OS) were assessed based on total and VUS alterations.
Results
Statistically significant improvement in PFS was associated with high versus low alteration number in variants of unknown significance (VUS, >3 alterations versus VUS ≤3 alterations), SD≥6 months/PR/CR 45% versus 15%, respectively; p = 0.014. Similar results were seen with high versus low total alteration number (characterized plus VUS, ≥6 versus <6). Statistically significant OS improvement was also associated with high VUS alteration status. Two-month landmark analysis showed that responders versus non-responders with VUS>3 had a median PFS of 23 versus 2.3 months (p = 0.0004).
Conclusion
Given the association of alteration number on liquid biopsy and checkpoint inhibitor-based immunotherapy outcomes, further investigation of hyper-mutated ctDNA as a predictive biomarker is warranted.
Keywords: Circulating tumor DNA, liquid biopsy, immunotherapy, checkpoint inhibitor, mutations
INTRODUCTION
Checkpoint inhibitor-based immunotherapy has revolutionized treatment for malignancies across several histologies. For example, the PD-1 inhibitor pembrolizumab demonstrated a response rate of about 45% in a biomarker-selected population (defined as tumor immunohistochemical (IHC) PD-L1 staining >50%) in non-small cell lung cancer (NSCLC).(1) Pembrolizumab is now approved in the first-line setting for biomarker-selected advanced NSCLC without sensitizing EGFR or ALK alterations. Other checkpoint inhibitors, such as the anti-CTLA-4 antibody ipilimumab and anti-PD-1 antibody nivolumab, as well as the anti-PDL1 antibody atezolizumab, have demonstrated clinically significant efficacy for malignancies ranging from advanced melanoma to head and neck cancers, renal cell cancer, urothelial cancer, non-small cell lung cancer, and colorectal cancer.(2) Additionally, checkpoint blockade has demonstrated impressive response rates in hematologic malignancies, such as B-cell lymphomas.(3)
Despite the undoubted efficacy of many of these immunotherapies, immune-related adverse effects are not negligible. For example, in a retrospective review of 14 phase I to III ipilimumab trials involving 1500 patients, 64.2% of patients experienced some degree of toxicity, with 20–30% experiencing grade 3–4 immune related side effects (including gastrointestinal, dermatologic, hepatic, endocrine, or pulmonary adverse events).(4) Anti-PD1 use has also been found to result in a rate of severe toxicity of approximately 6%.(5) Furthermore, the majority of patients do not respond to therapy, and a subset of patients may experience hyper-progression.(6,7) For these reasons, it has become evident that predictive biomarkers of response are needed for these novel agents.
Recently, tumor mutational burden, as detected by tissue next generation sequencing, has been shown to correlate with response to checkpoint inhibitors in several malignancies.(8) This is not unexpected, since the immune system, once reactivated by checkpoint inhibitors, recognizes tumor cells because they present neoantigens derived from the mutanome. Presumably, the more neoantigens presented, the better the chances that the immune T-cell machinery will be triggered to eradicate the presenting cancer cell. Unfortunately, obtaining tissue biopsies in order to determine tumor mutational burden is at times difficult. We therefore investigated the utility of blood-derived circulating tumor DNA (ctDNA) in determining a hyper-mutated state and response to immunotherapy.
MATERIALS AND METHODS
Patient Data
Overall, 1262 patients who had next generation sequencing (NGS, 54 to 70 genes: Guardant Health) performed on cell-free, circulating tumor DNA (ctDNA) derived from liquid (blood) biopsies were analyzed. Those who had solid malignancies and had received checkpoint inhibitor-based immunotherapy from December 2011 to December 2016 (N = 69 patients) were the subjects of this study. Of those 69 individuals, three were not evaluable for response (one whose baseline imaging was not traceable and two who were lost to follow up before first restaging). The remaining 66 patients were evaluated for overall rate of SD ≥6 months, PR, or CR. All 69 patients were considered evaluable for PFS and OS. In those situations where patients received multiple lines of immunotherapy, SD ≥6 months/PR/CR was assessed based on the first immunotherapy. Similarly, PFS and OS were assessed from cycle 1, day 1 of the first immunotherapy. In those situations where patients received multiple ctDNA analyses, data was used from the analysis closest to the date of initiation of first immunotherapy. Survival analyses were performed on variants of unknown significance and total ctDNA alterations using cutoffs of 3 and 6 alterations (the mean values for numbers of these alterations across patients), respectively. All studies and analyses were performed in accordance with the ethical guidelines of the Declaration of Helsinki and the Belmont Report per a University of California San Diego, Internal Review Board-approved protocol (NCT02478931) and the investigational treatment protocols for which the patients gave written consent.
ctDNA Next Generation Sequencing
Sequencing was performed by a Clinical Laboratory Improvement Amendments (CLIA)-certified and College of American Pathologists (CAP)-accredited clinical laboratory, Guardant Health, Inc. (http://www.guardanthealth.com). The Guardant360 (54 to 70 gene) test identifies characterized and variants of unknown significance (VUS) tumor-related genomic alterations within cancer-related genes. The data is analyzed from circulating tumor DNA (ctDNA) extracted from plasma (two 10-mL blood tubes). This ctDNA assay has a sensitivity and specificity of 85%+ and >99.9999%, respectively, for detection of single-nucleotide variants in tumor tissue of advanced cancer patients.(9)
Statistical analysis
For comparing rates of SD ≥6 months/PR/CR, Fisher’s exact test was used to calculate p-values with a 95% confidence interval (CI). For PFS and OS, Kaplan-Meier analysis was used with the log-rank (Mantel-Cox) test to generate p-values. Hazard ratios and confidence intervals using log-rank analysis were also calculated. Those patients whose status was known and who had not progressed (for PFS) or died (for OS) at the time of last follow up or the cut-off date for analysis (January 12, 2017) were censored at that date. Kaplan-Meier analyses for PFS and OS were also performed based on status at a 2-month landmark.
RESULTS
Patient Demographics (Table 1)
Table 1.
Demographics and Baseline Characteristics of Patients Who Received Circulating Tumor DNA Testing and Checkpoint-Inhibitor Based Therapy (N = 69 patients)
| Variable | All patients N (%, if applies) |
20 patients with VUS > 3 N (%, if applies) |
49 patients with VUS ≤ 3 N (%, if applies) |
P valuec | |
|---|---|---|---|---|---|
|
| |||||
| Age at diagnosis, years | |||||
| Median (Range) | 56.38 (21.89–85.32) | 55.51 (33.63–75.05) | 59.48 (21.89–85.33) | P = 0.41 | |
| Mean +/− SD | 56.38 +/− 14.15 | 54.21 +/− 13.28 | 57.27 +/− 14.25 | (Mann-whitney) | |
| Gender, M (%) F (%) | 43 (62.3%): 26 (37.7%) | 8 (40%); 12 (60%) | 18 (36.7%); 31 (63.3%) | ||
|
| |||||
| Diagnoses, number (%) | |||||
| Skin Cancer | 15 (21.7%) | 6 (30%) | 9 (18.4%) | P = 0.34 | |
| Melanoma | 10 (14.5%) | 3 (15%) | 7 (14.3%) | P = 1.0 | |
| Squamous Cell | 3 (4.3%) | 2 (10%) | 1 (2%) | ||
| Basal Cell | 2 (2.9%) | 1 (5%) | 1 (2%) | ||
| Non-small Cell Lung Cancer | 19 (27.5%) | 1 (5%) | 18 (36.7%) | P= 0.0073 | |
| Head and Neck Cancer | 9 (13.0%) | 3 (15%) | 6 (12.2%) | P =0.71 | |
| Renal Cell Cancer | 3 (4.3%) | 0 (0%) | 3 (6.1%) | ||
| Gastrointestinal Cancer | 6 (8.7%) | 2 (10%) | 4 (8.2%) | ||
| Colorectal | 4 (5.8%) | 2 (10%) | 2 (4.1%) | ||
| Appendix | 1 (1.4%) | 0 (0%) | 1 (2%) | ||
| Gastroesophageal | 1 (1.4%) | 0 (0%) | 1 (2%) | ||
| Bladder Cancer (TCC) | 2 (2.9%) | 1 (5%) | 1 (2%) | ||
| Liver Cancer (HCC) | 3 (4.3%) | 0 (0%) | 3 (6.1%) | ||
| Thyroid Cancer | 2 (2.9%) | 1 (5%) | 1 (2%) | ||
| Breast Cancer | 3 (4.3%) | 3 (15%) | 0 (0%) | ||
| Neuroendocrine Cervical Cancer | 1 (1.4%) | 1 (5%) | 0 (0%) | ||
| Unknown Primary | 3 (4.3%) | 2 (10%) | 1 (2%) | ||
| Brain Cancer (GBM) | 1 (1.4%) | 0 (0%) | 1 (2%) | ||
| Adrenal Cancer | 1 (1.4%) | 0 (0%) | 1 (2%) | ||
| Uterine Cancer | 1 (1.4%) | 0 (0%) | 1 (2%) | ||
|
| |||||
| Type of Immunotherapya, N (%) | |||||
| Anti-CTLA4 alone | 3 (4.3%) | 0 (0%) | 3 (6.1%) | ||
| Anti-CTLA4/Anti-PD1 Combination | 4 (5.7%) | 2 (10%) | 2 (4.1%) | ||
| Anti-PD1 or Anti-PD-L1 Alone | 54 (79.7%) | 16 (80%) | 38 (77.6%) | P = 1.0 | |
| Other Anti-PDL1-Containing Combinations | 8 (11.6%) | 2 (10%) | 6 (12.2%) | ||
|
| |||||
| Patients with ≥6 Total (Characterized + VUS) ctDNA Alterations, number (%) | 23 (33.3%) | 19 (95%) | 4 (8.2%) | P = 0.0001 | |
|
| |||||
| SD ≥6 months/CR/PR (N (%))b | 16/66 (24%) | 9/20 (45%) | 7/46 (15%) | P = 0.014 | |
|
| |||||
| Median PFS, monthsb | 2.30 (95% CI = 0.7 to 5.0) | 3.84 | 2.07 | P = 0.019 (HR 0.52; 95% CI 0.31–0.87) | |
|
| |||||
| Median OS, monthsb | 15.34 (95% CI = 6.80 to 15.68) | Not Reached | 10.72 | P = 0.042 (HR 0.39; 95% CI 0.18–0.83) | |
|
| |||||
| 23 patients with ≥6 total ctDNA alterations N (%) | 46 patients with <6 total ctDNA alterations N (%) | ||||
|
| |||||
| SD ≥6 months/CR/PR, N (%)b | 16/66 (24%) | 9/22 (40.9%) | 7/44 (15.9%) | P = 0.025 | |
|
| |||||
| Median PFS, monthsb | 2.30 (95% CI = 0.7 to 5.0) | 2.85 | 2.19 | P = 0.046 (HR 0.59; 95% CI 0.35–0.99) | |
|
| |||||
| Median OS, monthsb | 15.34 (95% CI = 10.6 to 23.9) | Not reached | 10.79 | P = 0.37 (HR 0.69; 95% CI 0.32–1.5) | |
Initial immunotherapy regimen received by patient
N = 66 patients evaluable for SD ≥6 months/PR/CR; N=69 patients evaluable for PFS and OS
p-values calculated only when at least 10 patients were assessable in a category
Abbreviations ctDNA, circulating tumor deoxyribonucleic acid; CI = Confidence interval; GBM, glioblastoma multiforme; HCC, hepatocellular carcinoma; P = probability; SD, standard deviation; TCC, transitional cell carcinoma; VUS, variant of undetermined significance
Overall, 66 patients were evaluable for stable disease (SD) ≥6 months/partial response (PR)/complete response (CR); 69 patients were evaluable for progression-free survival (PFS) and overall survival (OS) (N = 18 tumor types). Median patient age was 56 years (range, 22 to 85 years). 43 patients (62.3%) were men. The most common tumor types were melanoma, lung cancer and head and neck cancer. The most common type of immunotherapy used was anti-PD1 or PD-L1 monotherapy, which was administered to 54 patients (79.7%).
ctDNA findings
Overall, 63 patients (91%) had at least one ctDNA alteration. The median number of variants of unknown significance (VUSs) per patient was 2 (range 0 to 20) (mean = 3). The median number of characterized alterations per patient was 1 (range, 0 to 25; mean = 3). The median number of total alterations per patient (which include characterized and total VUSs) was 3 (range, 0 to 37; mean = 6).
Of 69 patients, 20 (29%) had >3 VUSs in their circulating-tumor DNA (ctDNA) versus 71% with ≤3 VUS ctDNA alterations. 23 patients (33.3%) had ≥6 total ctDNA alterations (characterized alterations plus total VUS alterations) and 66.7% had <6 total ctDNA alterations.
Relationship of Immunotherapy Outcome and Number of ctDNA Alterations
Response (SD ≥6 months/PR/CR)
Overall, 16 of 66 patients (24%) achieved SD ≥6 months/PR/CR. Rates of SD ≥6 months/PR/CR differed significantly in those with >3 VUS alterations versus those with ≤3 VUS alterations (45% versus 15%, respectively; p=0.014). Similarly, SD ≥6 months/PR/CR rates were 40.9% versus 15.9% (p=0.025) (≥6 versus <6 total ctDNA alterations, respectively) (Table 1).
PFS
The median PFS for 69 patients in the study was 2.3 months (95% CI = 0.7 to 5.0 months). (Table 1) The median PFS for patients with >3 versus <3 VUS was 3.84 versus 2.07 months (p=0.019) (HR 0.52; 95% CI = 0.31 to 0.87). (Figure 1A) The median PFS for patients with ≥6 versus <6 total ctDNA alterations was also significantly different: 2.85 versus 2.19 months (p=0.025) (HR 0.59; 95% CI = 0.35 to 0.99). (Supplemental Figure 1A)
FIGURE 1. PFS and OS for VUS >3 versus ≤3 Groups.
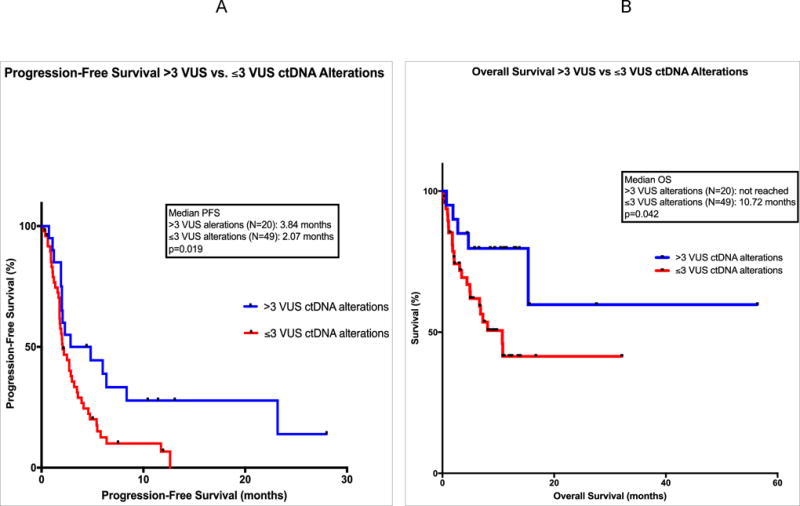
Panel A: Progression-free survival (PFS) is shown for 69 patients treated with checkpoint inhibitor-based immunotherapy. Comparison groups are those with >3 variants of unknown significance (VUS) circulating tumor DNA (ctDNA) alterations (in blue) versus ≤3 VUS ctDNA alterations (in red). Data is calculated by method of Kaplan Meier, with log-rank p values. Course 1, day 1 of first immunotherapy represents starting point. Tick marks represent patients who are still progression free at the designated time; they were censored at that point.
Panel B: Overall survival (OS) is shown for 69 patients treated with checkpoint inhibitor-based immunotherapy. Comparison groups are those with >3 VUS ctDNA alterations (in blue) versus ≤3 VUS ctDNA alterations (in red). Data is calculated by method of Kaplan Meier, with log-rank p values. Course 1, day 1 of first immunotherapy represents starting point. Tick marks represent patients still alive at the designated time; they were censored at that point.
Two-Month Landmark Analysis for PFS
Those patients achieving ≥2 months PFS from start of immunotherapy were included in this analysis (N=41). These patients were further subdivided into responders (those achieving CR or PR; N=15) and non-responders (SD, or progressive disease, PD; N=26). A landmark comparing responders to non-responders in the VUS >3 alterations group showed median PFS 23.2 months versus 2.3 months (p=0.0004) (HR 0.15; 95% CI 0.035 to 0.61). (Figure 2A) Similarly, 2-month landmark analysis (responders versus non-responders) in the ≥6 total ctDNA alterations group showed median PFS 23.2 versus 2.3 months (p=0.0006) (HR 0.15; 95% CI 0.038 to 0.63). (Supplemental Figure 2A)
FIGURE 2. Landmark Analyses of PFS at 2 Months for Responders and Non-Responders, VUS >3 versus ≤3 Groups.
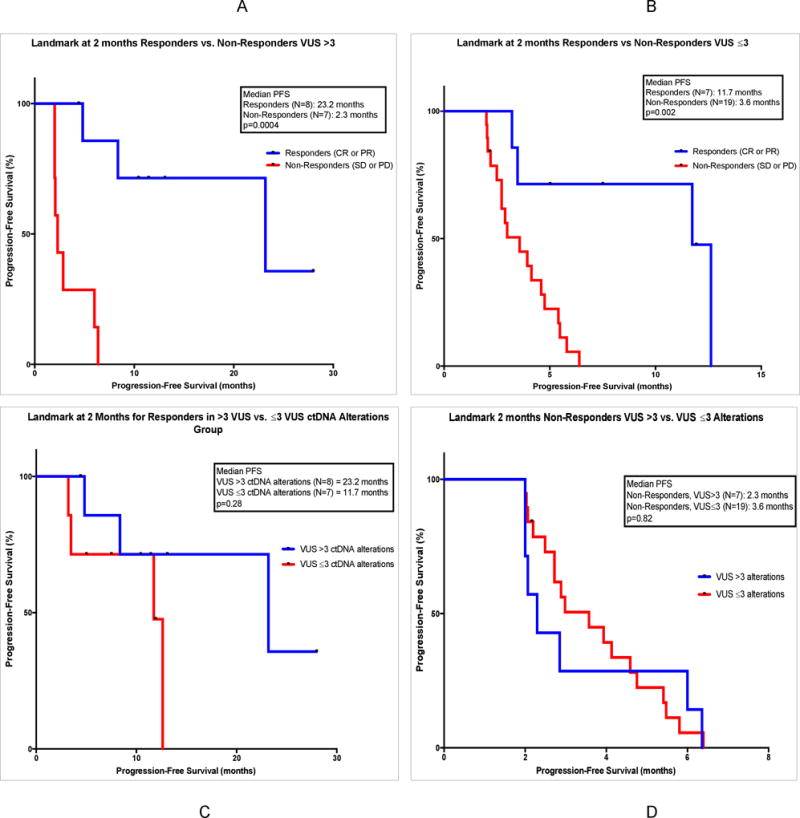
Panel A: A 2-month landmark study for PFS is shown for 15 patients treated with checkpoint inhibitor-based immunotherapy who had >3 VUS ctDNA alterations. Comparison groups are those who achieved response (CR or PR) (in blue) versus those who did not achieve response (SD or PD) (in red). Data is calculated by method of Kaplan Meier, with log-rank p values. Course 1, day 1 of first immunotherapy represents starting point. Tick marks represent patients who are still progression free at the designated time; they were censored at that point.
Panel B: A 2-month landmark study for PFS is shown for 26 patients treated with checkpoint inhibitor-based immunotherapy who had ≤3 VUS ctDNA alterations. Comparison groups are those who achieved response (CR or PR) (in blue) versus those who did not achieve response (SD or PD) (in red). Data is calculated by method of Kaplan Meier, with log-rank p values. Course 1, day 1 of first immunotherapy represents starting point. Tick marks represent patients who are still progression free at the designated time; they were censored at that point.
Panel C: A 2-month landmark study for PFS is shown for 15 patients treated with checkpoint inhibitor-based immunotherapy who had achieved response (CR or PR). Comparison groups are those with >3 VUS ctDNA alterations (in blue) versus ≤3 VUS ctDNA alterations (in red). Data is calculated by method of Kaplan Meier, with log-rank p values. Course 1, day 1 of first immunotherapy represents starting point. Tick marks represent patients who are still progression free at the designated time; they were censored at that point.
Panel D: A 2-month landmark study for PFS is shown for 26 patients treated with checkpoint inhibitor-based immunotherapy who had not achieved response (SD or PD). Comparison groups are those with >3 VUS ctDNA alterations (in blue) versus ≤3 VUS ctDNA alterations (in red). Data is calculated by method of Kaplan Meier, with log-rank p values. Course 1, day 1 of first immunotherapy represents starting point. Tick marks represent patients who are still progression free at the designated time; they were censored at that point.
Landmark analyses were also performed for responders vs. non-responders in the ≤3 VUS alterations group and <6 total alterations group. Median PFS was significantly improved for responders in both groups. (Figure 2B; Supplemental Figure 2B)
Landmark analyses for responders in the >3 versus ≤3 VUS alterations groups showed a PFS of 23.2 versus 11.7 months, but this was not statistically significant. However, there were only 8 and 7 patients in each group, respectively (Figure 2C). Analogous results were found for the ≥6 versus <6 total ctDNA alterations groups. (Supplemental Figure 2C)
Similar landmark analyses were done for non-responders in the >3 VUS versus ≤3 VUS alterations groups (N=7 vs. N=19 patients, respectively), which showed a median PFS of 2.3 versus 3.6 months (P = 0.82) (Figure 2D); analogous results were found for the ≥6 versus <6 total ctDNA alterations groups. (Supplemental Figure 2D)
Overall Survival
The median OS for 69 patients in the study was 15.3 months (95% CI = 10.6 to 23.9 months) from the start of immunotherapy. (Table 1) The median OS for patients with >3 VUS alterations was not reached versus 10.72 months for patients with ≤3 VUS (p=0.042) (HR 0.39; 95% CI 0.18 to 0.83). (Figure 1B) The median OS for patients with ≥6 total ctDNA alterations was not reached versus 10.79 months for those with <6 total ctDNA (p=0.37) (HR 0.69; 95% CI 0.32 to 1.5). (Supplemental Figure 1B)
Two-Month Landmark Analysis for OS
Those patients achieving ≥2 months OS from start of immunotherapy were included in this analysis (N=54). These patients were also subdivided into responders (CR/PR, N=15) and non-responders (SD/PD, N=39). The 2-month landmark comparing responders to non-responders in the >3 VUS alterations group showed median OS was not reached for responders versus 15.34 months for non-responders (p=0.11) (log-rank HR could not be calculated). (Figure 3A) Analysis at the 2-month landmark for responders versus non-responders in the ≥6 total ctDNA alterations group showed median OS of not reached versus 15.34 months (p=0.02) (log-rank HR could not be calculated). (Supplemental Figure 3A)
FIGURE 3. Landmark Analyses at 2 Months for OS in Responders and Non-Responders, VUS >3 versus ≤3 Groups.
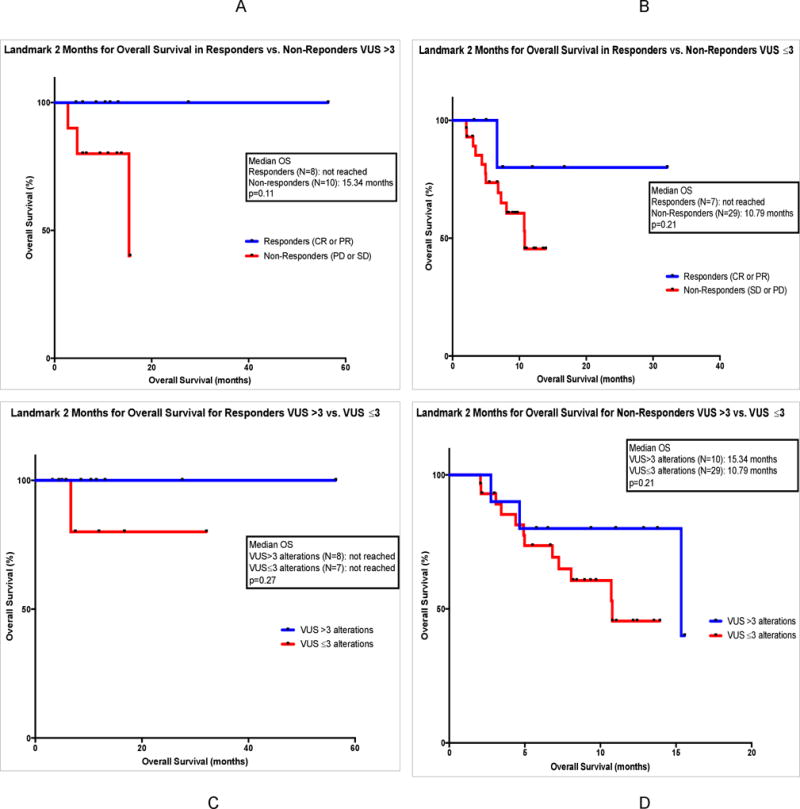
Panel A: A 2-month landmark study for OS is shown for 18 patients treated with checkpoint inhibitor-based immunotherapy who had >3 VUS ctDNA alterations. Comparison groups are those who achieved response (CR or PR) (in blue) versus those who did not achieve response (SD or PD) (in red). Data is calculated by method of Kaplan Meier, with log-rank p values. Course 1, day 1 of first immunotherapy represents starting point. Tick marks represent patients still alive at the designated time; they were censored at that point.
Panel B: A 2-month landmark study for OS is shown for 36 patients treated with checkpoint inhibitor-based immunotherapy who had ≤3 VUS ctDNA alterations. Comparison groups are those who achieved response (CR or PR) (in blue) versus those who did not achieve response (SD or PD) (in red). Data is calculated by method of Kaplan Meier, with log-rank p values. Course 1, day 1 of first immunotherapy represents starting point. Tick marks represent patients still alive at the designated time; they were censored at that point.
Panel C: A 2-month landmark study for OS is shown for 15 patients treated with checkpoint inhibitor-based immunotherapy who had achieved response (CR or PR). Comparison groups are those with >3 VUS ctDNA alterations (in blue) versus ≤3 VUS ctDNA alterations (in red). Data is calculated by method of Kaplan Meier, with log-rank p values. Course 1, day 1 of first immunotherapy represents starting point. Tick marks represent patients still alive at the designated time; they were censored at that point.
Panel D: A 2-month landmark study for OS is shown for 39 patients treated with checkpoint inhibitor-based immunotherapy who had not achieved response (SD or PD). Comparison groups are those with >3 VUS ctDNA alterations (in blue) versus ≤3 VUS ctDNA alterations (in red). Data is calculated by method of Kaplan Meier, with log-rank p values. Course 1, day 1 of first immunotherapy represents starting point. Tick marks represent patients still alive at the designated time; they were censored at that point.
Landmark analyses were also performed for responders versus non-responders in the ≤3 VUS alterations group (not reached versus 10.79 months; p=0.21) and <6 total alterations group (p=not significant). (Figure 3B; Supplemental Figure 3B)
2-month landmark analyses for responders in the >3 versus ≤3 VUS alterations groups (N=8 vs. N=7, respectively) and also ≥6 versus <6 total alterations groups (N=8 vs. N=7, respectively) were also performed. Median OS was not reached in any cohort and was not statistically different between cohorts. (Figure 3C; Supplemental Figure 3C) Similar analyses were done for non-responders in the >3 versus ≤3 VUS alterations groups (N=10 vs. N=29, respectively) and also ≥6 versus <6 total alterations groups (N=11 vs. N=28, respectively), without statistically significant differences. (Figure 3D; Supplemental Figure 3D)
DISCUSSION
To our knowledge, this is the first study to demonstrate that increased mutational burden, as reflected by the number of blood-derived ctDNA alterations, correlates with response to checkpoint inhibitor-based treatments. Previous studies have shown a correlation between tumor mutational burden, as measured in tissue, and response to immunotherapy in diseases such as lung cancer, melanoma and urothelial cancer.(8,10–12) Because ctDNA can be obtained by a blood test without need for an invasive tissue biopsy, our current results may be clinically exploitable.
Biomarkers predicting response to immunotherapy have been investigated at the tissue DNA, RNA, and protein level. For example, at the DNA level, polymerase chain reaction (PCR) detection of altered microsatellite foci in colorectal cancer has been predictive of response to anti-PD1-directed therapy.(13) Microsatellite instability is associated with defects in mismatch repair (MMR) genes that result in a hypermutated state, which presumably enhances the chance of response by increasing immunogenic neoantigen production by a hypermutated genome.(8,14–16) At the transcript level, mRNA sequences reflecting CD8-positive T cell and expanded immune signatures within the tumor microenvironment also predict response to checkpoint inhibitor therapy. (17,18) And, at the protein level, PD-L1 expression (IHC) in tumor and/or stromal cells is associated with higher response rates to checkpoint inhibitors, though IHC variability limits the precision of this assay.(3,19,20) Specific mutational signatures, such as kataegis, a pattern of base mutations associated with APOBEC (apolipoprotein B mRNA editing enzyme, catalytic polypeptide) family overexpression (correlating with viral presence) are also linked to PD-L1 overexpression.(21)
As mentioned above, the role of hypermutated genomes in response to checkpoint inhibitors is illustrated by several studies. For instance, when comparing MMR-deficient versus MMR-proficient colorectal cancer, the overall response rate to pembrolizumab was about 60% versus 0%.(22) Other factors contributing to hypermutation include dysfunction of DNA polymerase via germline mutations and molecular “smoking signatures” in NSCLC tumors that lead to differential mutational landscapes and up-regulation of PD-L1 expression.(16,20,23,24) As mentioned, other publications show a correlation between high tissue tumor mutational burden and checkpoint inhibitor response in several different tumor types.(8,10–12)
It therefore appears that tissue tumor mutational burden is a useful test for predicting response to immunotherapy. Still, presumably, mutational burden may change with time, and repeat biopsies may be difficult to obtain. Additionally, obtaining tissue may be time consuming and invasive. Liquid biopsies that assess blood-derived ctDNA are non-invasive, easily acquired, and inexpensive. It is therefore of interest that, in our study, we demonstrate that overall response rates for patients in the high alteration groups (VUS>3 or total alterations ≥6) is significantly higher than in those in low alteration groups (VUS ≤3 or total alterations <6) (45% versus 15%, respectively, for the VUS group, p=0.014). Similarly, overall PFS and OS were significantly improved in patients with high VUS compared to low VUS alteration number. Analogous results for response rate and PFS were found when all alterations (not just VUS) were examined and dichotomized at ≥6 versus <6 alterations. (Figure 1A and 1B) In the 2-month landmark analysis, PFS was best in those who had a response to checkpoint inhibitor-based therapy and also fell into the high alteration groups (PFS ~23 months versus ~2 months; responders versus non-responders; p<0.0006). (Figure 2A and Supplemental Figure 2A) In contrast, 2-month landmark PFS for responders versus non-responders in the low alteration group (VUS <3) was 11.7 versus 3.6 months (p= 0.002). (Figure 2B) Similarly, 2-month landmark for overall survival showed longer survival in the responders versus non-responders in the high alteration group (though not in the low alteration group). The small numbers of patients in each of the latter subgroups may have, however, precluded reaching statistical significance. Taken together, these data suggest that the hypermutated state, as assessed by ctDNA, correlates with better outcomes after checkpoint inhibitor-based immunotherapy, and that responders with hypermutated ctDNA had a median PFS that was close to two years.
There are several limitations to this study, including the fact that it is retrospective and the sample size is small. It will be important to perform larger prospective studies in the future. Furthermore, the number of genes assayed in our ctDNA analysis was only between 54 and 70. Unlike targeted NGS of tumor tissue, which often tests for hundreds of genes and allows a relatively accurate estimate of total mutational burden, targeted NGS of plasma cfDNA provides only a limited snapshot of the cancer genome. More extensive ctDNA gene panels merit investigation to determine if they increase the correlative value of our findings. Interestingly, Weiss et al recently reported that chromosomal instability as reflected by copy number variation in cell-free DNA correlated with response to immunotherapy, consistent with our observations with number of alterations. (25). Future studies should also compare cfDNA and tissue NGS mutational burden, preferably with biopsies and blood tests obtained on the same day. Yet another limitation is that, while the majority of cfDNA analysis was done prior to initiation on checkpoint inhibitor-based immunotherapy (56 of 66 evaluable patients), 10 patients began immunotherapy prior to cfDNA collection (median, 0.4 months). In the 56 patients who had cfDNA testing prior to or on the day of initiation of immunotherapy, the median time between cfDNA testing and start of immunotherapy was 1.6 months, (range 0–12 months). It is unknown at this time how treatment initiation may have influenced cfDNA results in these situations. Finally, we studied diverse tumor types and therefore the impact of hypermutated DNA in individual histologies was not assessable. Even so, the results may suggest generalizability across malignancies.
In summary, liquid biopsies provide several advantages in that they are easily obtained and less expensive than tissue biopsies. The ctDNA derived from blood may also represent shed DNA from multiple metastatic sites, whereas tissue genomics reflects only the piece of tissue removed. Our data suggests that ctDNA-determined hypermutated states predict improved response, PFS and OS after checkpoint inhibitor therapy across histologies. Larger prospective studies are warranted to corroborate these findings.
Supplementary Material
STATEMENT OF TRANSLATIONAL RELEVANCE.
This is the first analysis demonstrating a correlation between high alteration number detected in blood-derived circulating tumor DNA and favorable outcome, including overall response, progression-free and overall survival with checkpoint inhibitor-based immunotherapy. This data provides the impetus to further investigate liquid biopsy as a viable, non-invasive, predictive biomarker for checkpoint inhibitor response across various histologies.
Acknowledgments
Funded in part by the Joan and Irwin Jacobs fund and by National Cancer Institute grant P30 CA016672 (RK)
References
- 1.Garon EB, Rizvi NA, Hui R, Leighl N, Balmanoukian AS, Eder JP, et al. Pembrolizumab for the Treatment of Non–Small-Cell Lung Cancer. N Engl J Med. 2015;372:2018–28. doi: 10.1056/NEJMoa1501824. [DOI] [PubMed] [Google Scholar]
- 2.Blumenthal GM, Pazdur R. Approvals in 2016: the march of the checkpoint inhibitors. Nat Rev Clin Oncol. 2017;14:131–2. doi: 10.1038/nrclinonc.2017.15. [DOI] [PubMed] [Google Scholar]
- 3.Goodman A, Patel SP, Kurzrock R. PD-1-PD-L1 immune-checkpoint blockade in B-cell lymphomas. Nat Rev Clin Oncol. 2017;14:203–20. doi: 10.1038/nrclinonc.2016.168. [DOI] [PubMed] [Google Scholar]
- 4.Downey SG, Klapper JA, Smith FO, Yang JC, Sherry RM, Royal RE, et al. Prognostic Factors Related to Clinical Response in Patients with Metastatic Melanoma Treated by CTL-Associated Antigen-4 Blockade. Clin Cancer Res. 2007;13:6681–8. doi: 10.1158/1078-0432.CCR-07-0187. [DOI] [PMC free article] [PubMed] [Google Scholar]
- 5.Topalian SL, Hodi FS, Brahmer JR, Gettinger SN, Smith DC, McDermott DF, et al. Safety, activity, and immune correlates of anti-PD-1 antibody in cancer. N Engl J Med. 2012;366:2443–54. doi: 10.1056/NEJMoa1200690. [DOI] [PMC free article] [PubMed] [Google Scholar]
- 6.Champiat S, Dercle L, Ammari S, Massard C, Hollebecque A, Postel-Vinay S, et al. Hyperprogressive Disease Is a New Pattern of Progression in Cancer Patients Treated by Anti-PD-1/PD-L1. [cited 2017 Mar 22];Clinical Cancer Research [Internet] 2016 doi: 10.1158/1078-0432.CCR-16-1741. Available from: http://clincancerres.aacrjournals.org/lookup/doi/10.1158/1078-0432.CCR-16-1741. [DOI] [PubMed]
- 7.Kato S, Goodman AM, Walavalkar V, Barkauskas DA, Sharabi A, Kurzrock R. Hyper-progressors after Immunotherapy: Analysis of Genomic Alterations Associated with Accelerated Growth Rate. Clin Cancer Res. 2017 doi: 10.1158/1078-0432.CCR-16-3133. clincanres.3133.2016. [DOI] [PMC free article] [PubMed] [Google Scholar]
- 8.Campesato LF, Barroso-Sousa R, Jimenez L, Correa BR, Sabbaga J, Hoff PM, et al. Comprehensive cancer-gene panels can be used to estimate mutational load and predict clinical benefit to PD-1 blockade in clinical practice. Oncotarget. 2015;6:34221–7. doi: 10.18632/oncotarget.5950. [DOI] [PMC free article] [PubMed] [Google Scholar]
- 9.Lanman RB, Mortimer SA, Zill OA, Sebisanovic D, Lopez R, Blau S, et al. Analytical and Clinical Validation of a Digital Sequencing Panel for Quantitative, Highly Accurate Evaluation of Cell-Free Circulating Tumor DNA. PLoS ONE. 2015;10:e0140712. doi: 10.1371/journal.pone.0140712. [DOI] [PMC free article] [PubMed] [Google Scholar]
- 10.Snyder A, Makarov V, Merghoub T, Yuan J, Zaretsky JM, Desrichard A, et al. Genetic basis for clinical response to CTLA-4 blockade in melanoma. N Engl J Med. 2014;371:2189–99. doi: 10.1056/NEJMoa1406498. [DOI] [PMC free article] [PubMed] [Google Scholar]
- 11.Kowanetz M, Zou W, Shames DS, Cummings C, Rizvi N, Spira AI, et al. Tumor mutation load assessed by FoundationOne (FM1) is associated with improved efficacy of atezolizumab (atezo) in patients with advanced NSCLC. Ann of Oncol. 2016;27 [online] [Google Scholar]
- 12.Rosenberg JE, Petrylak DP, Heijden MSVD, Necchi A, O’Donnell PH, Loriot Y, et al. PD-L1 expression, Cancer Genome Atlas (TCGA) subtype, and mutational load as independent predictors of response to atezolizumab (atezo) in metastatic urothelial carcinoma (mUC; IMvigor210) [cited 2016 Nov 1];J Clin Oncol. 2016 34 [Internet]. Available from: http://meetinglibrary.asco.org/content/165087-176. [Google Scholar]
- 13.Popat S, Hubner R, Houlston RS. Systematic review of microsatellite instability and colorectal cancer prognosis. J Clin Oncol. 2005;23:609–18. doi: 10.1200/JCO.2005.01.086. [DOI] [PubMed] [Google Scholar]
- 14.Lyford-Pike S, Peng S, Young GD, Taube JM, Westra WH, Akpeng B, et al. Evidence for a role of the PD-1:PD-L1 pathway in immune resistance of HPV-associated head and neck squamous cell carcinoma. Cancer Res. 2013;73:1733–41. doi: 10.1158/0008-5472.CAN-12-2384. [DOI] [PMC free article] [PubMed] [Google Scholar]
- 15.Schumacher TN, Schreiber RD. Neoantigens in cancer immunotherapy. Science. 2015;348:69–74. doi: 10.1126/science.aaa4971. [DOI] [PubMed] [Google Scholar]
- 16.Rizvi NA, Hellmann MD, Snyder A, Kvistborg P, Makarov V, Havel JJ, et al. Cancer immunology. Mutational landscape determines sensitivity to PD-1 blockade in non-small cell lung cancer. Science. 2015;348:124–8. doi: 10.1126/science.aaa1348. [DOI] [PMC free article] [PubMed] [Google Scholar]
- 17.Iglesia MD, Parker JS, Hoadley KA, Serody JS, Perou CM, Vincent BG. Genomic Analysis of Immune Cell Infiltrates Across 11 Tumor Types. J Natl Cancer Inst. 2016;108 doi: 10.1093/jnci/djw144. djw144. [DOI] [PMC free article] [PubMed] [Google Scholar]
- 18.Partlová S, Bouček J, Kloudová K, Lukešová E, Zábrodský M, Grega M, et al. Distinct patterns of intratumoral immune cell infiltrates in patients with HPV-associated compared to non-virally induced head and neck squamous cell carcinoma. Oncoimmunology. 2015;4:e965570. doi: 10.4161/21624011.2014.965570. [DOI] [PMC free article] [PubMed] [Google Scholar]
- 19.Patel SP, Kurzrock R. PD-L1 Expression as a Predictive Biomarker in Cancer Immunotherapy. Mol Cancer Ther. 2015;14:847–56. doi: 10.1158/1535-7163.MCT-14-0983. [DOI] [PubMed] [Google Scholar]
- 20.Khagi Y, Kurzrock R, Patel SP. Next generation predictive biomarkers for immune checkpoint inhibition. Cancer and Metastasis Reviews. 2017;36:179–90. doi: 10.1007/s10555-016-9652-y. [DOI] [PMC free article] [PubMed] [Google Scholar]
- 21.Boichard A, Tsigelny IF, Kurzrock R. High expression of PD-1 ligands is associated with kataegis mutational signature and APOBEC3 alterations. Oncoimmunology. 2017:e1284719. doi: 10.1080/2162402X.2017.1284719. [DOI] [PMC free article] [PubMed] [Google Scholar]
- 22.Le DT, Uram JN, Wang H, Bartlett BR, Kemberling H, Eyring AD, et al. PD-1 Blockade in Tumors with Mismatch-Repair Deficiency. N Engl J Med. 2015;372:2509–20. doi: 10.1056/NEJMoa1500596. [DOI] [PMC free article] [PubMed] [Google Scholar]
- 23.Palles C, Cazier J-B, Howarth KM, Domingo E, Jones AM, Broderick P, et al. Germline mutations affecting the proofreading domains of POLE and POLD1 predispose to colorectal adenomas and carcinomas. Nature Genet. 2012;45:136–44. doi: 10.1038/ng.2503. [DOI] [PMC free article] [PubMed] [Google Scholar]
- 24.van Gool IC, Eggink FA, Freeman-Mills L, Stelloo E, Marchi E, de Bruyn M, et al. POLE Proofreading Mutations Elicit an Antitumor Immune Response in Endometrial Cancer. Clin Cancer Res. 2015;21:3347–55. doi: 10.1158/1078-0432.CCR-15-0057. [DOI] [PMC free article] [PubMed] [Google Scholar]
- 25.Weiss GJ, Beck J, Braun DP, Bornemann-Kolatzki K, Barilla H, Cubello R, et al. Tumor Cell-Free DNA Copy Number Instability Predicts Therapeutic Response to Immunotherapy. Clin Cancer Res. 2017 doi: 10.1158/1078-0432.CCR-17-0231. [DOI] [PubMed] [Google Scholar]
Associated Data
This section collects any data citations, data availability statements, or supplementary materials included in this article.