

Abstract
Pericyclic reactions are among the most powerful synthetic transformations to make multiple regioselective and stereoselective carbon-carbon bonds1. These reactions have been widely applied for the synthesis of biologically active complex natural products containing contiguous stereogenic carbon centers2–6. Despite the prominence of pericyclic reactions in total synthesis, only three naturally existing enzymatic examples, intramolecular Diels-Alder (IMDA) reaction7, Cope8 and Claisen rearrangements9, have been characterized. Here, we report the discovery of a S-adenosyl-L-methionine (SAM) dependent enzyme LepI that can catalyse stereoselective dehydration, bifurcating IMDA/hetero-DA (HDA) reactions via an ambimodal transition state, and a [3,3]-sigmatropic retro-Claisen rearrangement leading to the formation of dihydopyran core in the fungal natural product leporin10. Combined in vitro enzymatic characterization and computational studies provide evidence and mechanistic insight about how the O-methyltransferase-like protein LepI regulates the bifurcating biosynthetic reaction pathways (“direct” HDA and “byproduct recycle” IMDA/retro-Claisen reaction pathways) by utilizing SAM as the cofactor in order to converge to the desired biosynthetic end product. This work highlights that LepI is the first example of an enzyme catalysing a (SAM-dependent) retro-Claisen rearrangement. We suggest that more pericyclic biosynthetic enzymatic transformations are yet to be discovered in the intriguing enzyme toolboxes in Nature11, and propose an ever expanding role of the versatile cofactor SAM in enzyme catalysis.
Naturally existing enzymatic pericyclic reactions are rare12–14. Indeed, only a handful of enzymes that can catalyse these reactions have been characterized over past five decades (Fig. 1a)7–9,12–14, even though pericyclic reactions have been proposed as key transformations in the biosynthesis of many polycyclic natural products12, 15–16. We sought an inverse electron demand hetero-DA (HDA) reaction17 that constructs heterocycles in natural products (Fig. 1a). The HDA reaction has been proposed as a key biotransformation yielding dihydropyran cores, which are prevalent structural features in natural products, including the cytotoxic leporin B (1) from Aspergillus species (Fig. 1b)10,15–16,18. The biomimetic synthesis of the pyran core in leporin using the E/Z geometric mixture of the unstable o-quinone methide19 intermediate 5 generated from the dehydration of the alcohol 4, was found to give a mixture of the minor desired HDA adduct leporin C (2) and major other regio- and stereoisomeric IMDA and HDA adducts (Fig. 1c)20. It was therefore proposed that an enzyme must be encoded in the biosynthetic pathway of leporins to catalyse the HDA cycloaddition in a stereoselective fashion and to suppress the IMDA reaction to afford the pyran core in 2 (Fig. 1c)14.
Figure 1.
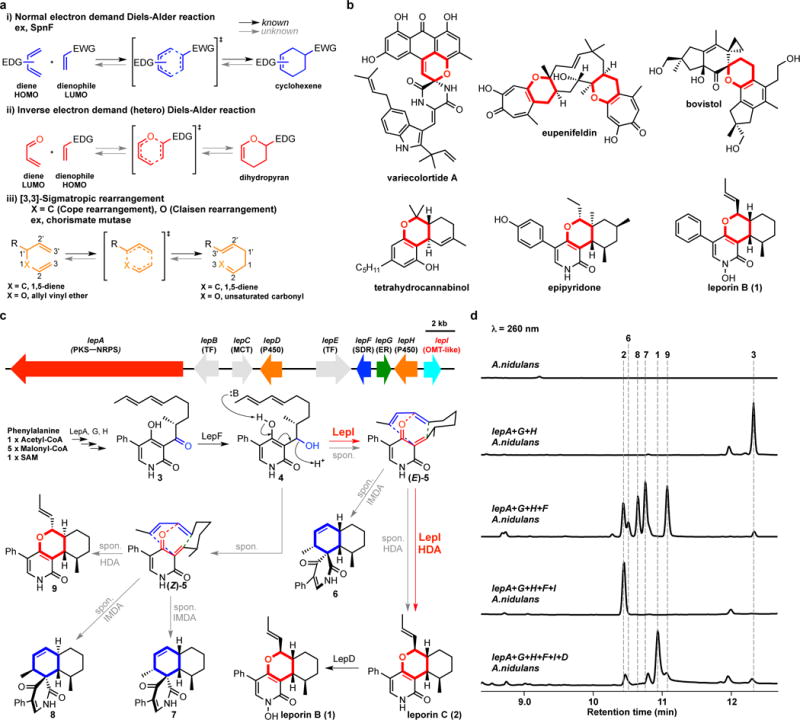
Enzyme-catalysed pericyclic reactions and the proposed inverse electron demand hetero-Diels-Alder (HDA) reactions in Nature. (a) Examples of enzymatic pericyclic reactions. (b) The structures of natural products containing dihydropyran, which would be biosynthesized by HDA reaction. Variecolortide A is naturally racemic; the relative stereochemistry of epipyridone and leporin B are shown. (c) The putative leporin biosynthetic gene cluster in A. flavus and assignment of encoded genes and biosynthetic pathway of leporins. PKS–NRPS, polyketide synthase–nonribosomal peptide synthetase; TF, transcription factor; MCT, monocarboxylate transporter; SDR, short-chain dehydrogenase/reductase; ER, enoylreductase; OMT, O-methyltransferase. The structures show the relative stereochemistry. (d) Analysis of metabolites from the transformants of A. nidulans. The peak at 12 min correspond to the tetramic acid product that is biosynthesized by LepA (PKS-NRPS) and LepG (ER).
The biosynthetic gene cluster of leporin B (1) in Aspergillus flavus was reported and genetically verified (Fig. 1c)10. However, no clear enzyme candidate that can catalyse the pericyclic reaction was apparent in the cluster. To identify the enzyme responsible for this biotransformation, we heterologously reconstituted leporin B (1) biosynthetic pathway in Aspergillus nidulans (Fig. 1c–d)21. As shown in Fig. 1d, coexpression of the polyketide synthase−nonribosomal peptide synthetase (PKS−NRPS) LepA, the partnering enoyl reductase (ER) LepG, the ring-expansion P45022 LepH led to the biosynthesis of the ketone 3. Additional coexpression with the short chain dehydrogenase/reductase (SDR) LepF, which is hypothesized to reduce 3 into the alcohol 4, led to a mixture of HDA products including the desired pyran 2 as a minor product and the diastereomer 9; as well as the spirocyclic IMDA products 6–8 (Fig. 1c-d). Among these products, 2 and 6 are proposed to be derived from the quinone methide (E)-5, while 7–9 are from (Z)-5 (Fig. 1c). These results are consistent with biomimetic synthetic observations, and indicate that in order to biosynthesize 2 as the desired pericyclic reaction product, enzymatic stereocontrol of dehydration of 4 to (E)-5, as well as control of the subsequent pericyclic reaction is required.
The only remaining annotated enzyme in the gene cluster is LepI, which is predicted to be an O-methyltransferase (OMT) with a well-conserved S-adenosyl-L-methionine (SAM) binding site even though no O-methylation step is required for leporin B (1) biosynthesis. When lepI was introduced into the A. nidulans strain that produced the various pericyclic products derived from reduction of 3, we were surprised to observe the exclusive production of 2 without any other products (Fig. 1d). Further addition of the P450 lepD yielded the final product 1, thereby completing heterologous pathway reconstitution (Fig. 1c-d). To first verify the function of SDR LepF, recombinant protein was expressed from Saccharomyces cerevisiae and assayed in the presence of 3 and NADPH, which yielded a single product 4 corresponding to the reduced compound (Extended Data Fig. 1). To obtain sufficient 4 for assay with LepI, we reduced 3 with NaBH4 which gave both 4 and diastereomer 4′ in a ~1:1 ratio (Extended Data Figs. 1–2). Each isomer was isolated and immediately added to assay with LepI expressed and purified from Escherichia coli. Both 4 and 4′ dehydrated spontaneously in the absence of LepI and afforded the mixture of the IMDA (6–8) and HDA (2 and 9) products, with 2 being a very minor product (Fig. 2a). However, when LepI was added to 4, complete conversion to 2 was accomplished in the absence of any added cofactors (Fig. 2a). In contrast, addition of LepI to 4′ had only a small effect on product profile. The collective in vivo and in vitro data therefore points to LepI being solely responsible for formation of 2 starting from 4, which requires stereoselective dehydration to yield (E)-5 and subsequent HDA reaction to 2.
Figure 2.
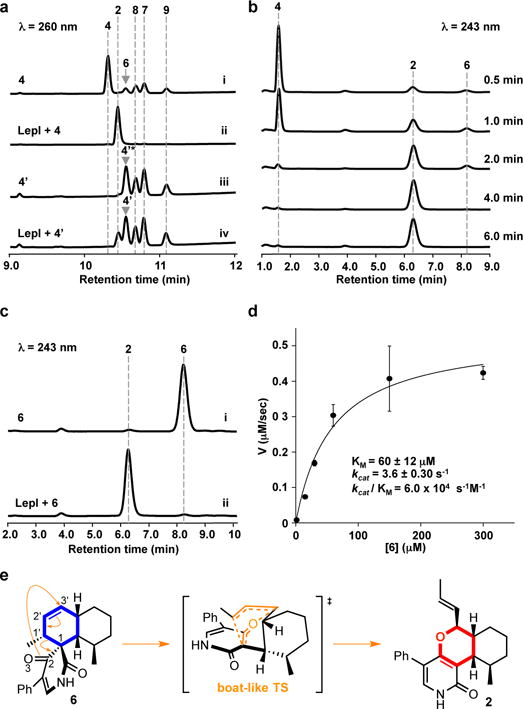
HPLC analysis showing the reactions catalysed by LepI. (a) in vitro reaction analysis of 4 and 4′ with 3 μM LepI for 0.5 h. (i) 4 in buffer, (ii) 4 with 3 μM LepI, (iii) 4′ in buffer, (iv) 4′ with 3 μM LepI. *6 is overlapped with 4′. (b) Time-course analysis of the conversion of 240 μM 4 to 2 in the presence of 300 nM LepI. (c) in vitro reaction analysis of 6 with 300 nM LepI for 3 min. (i) 6 in buffer, (ii) 6 with LepI. (d) Kinetic analysis of LepI-catalysed retro-Claisen rearrangement. (e) Scheme for putative LepI-catalysed retro-Claisen rearrangement. The structures show the relative stereochemistry.
We performed a reaction time-course analysis using LepI with 4 to capture any possible reaction intermediates. We observed the (E)-5 derived IMDA product 6 at early time points, which subsequently converted to 2 when all 4 was consumed (Fig. 2b-c). This result demonstrates that even in the presence of LepI, after the dehydration of 4 to (E)-5, both IMDA and HDA reactions could take place simultaneously to give 6 and 2, respectively, hence enzymatic control of the HDA reaction is not absolute. More surprisingly, it suggests that LepI may further catalyse the retro-Claisen rearrangement of 6 to 2 (Fig. 2e, Extended Data Fig. 3), a pericyclic transformation that has not been observed in the enzymatic realm12,14. To confirm this activity, we incubated LepI directly with 6. While we observed very slow spontaneous conversion of 6 to 2 (knon = 2.0 × 10⁻⁵ s−1), rapid conversion of 6 to 2 was observed in the presence of LepI with a rate enhancement (kcat, LepI versus knon) of approximately 1.8 × 10⁵-fold (Fig. 2c-d, Extended Data Fig. 5). LepI also displayed stereoselectivity towards 6 as other DA products such as 7 and 8 were not converted to the corresponding pyran products (Extended Data Fig. 4a), although 7 inhibited the conversion of 6 to 2 (Extended Data Fig. 4b). These results indicate that LepI catalyses the retro-Claisen rearrangement, in addition to the dehydration and the IMDA/HDA reactions (Fig. 2e).
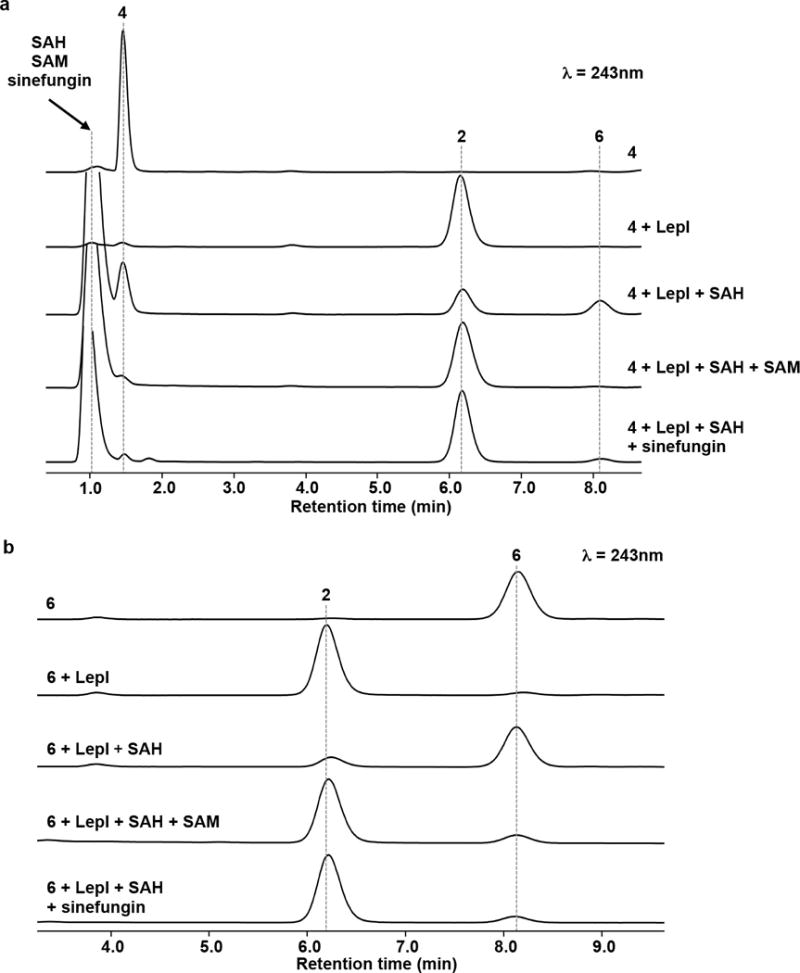
Given that the SAM-binding motif (GXGXG) of LepI is strictly conserved with other methyltransferases, we next probed the involvement of SAM in the LepI-catalysed reactions7, 23–24. Since no exogenous SAM was added in the assays, we investigated if SAM copurified with LepI and remained bound. SAM was detected in the supernatant of denatured LepI by LC-MS and estimated to be retained by ~ 90% of purified LepI (Extended Data Fig. 6)25. We then performed the LepI enzymatic assays in the presence of the SAM competitive inhibitor, S-adenosyl-L-homocysteine (SAH)26. SAH (250 μM) showed significant inhibition of both the dehydration of 4 and the retro-Claisen rearrangement of 6 (Fig. 3a–b, Extended Data Figs. 7–8). Inhibition of both reactions can be nearly completely rescued by adding SAM (100 μM) to the reaction (Fig. 3a-b, Extended Data Figs. 7–8). These observations demonstrate that SAM is an essential component of LepI catalytic activities, and led us to hypothesize that the positive charge of SAM that is absent in SAH may be required for these reactions (Fig. 3e). We then tested sinefungin27, a positively-charged (ammonium) analogue of SAM (sulfonium) in the competition assays. Sinefungin (100 μM) can similarly rescue inhibition of dehydration and retro-Claisen rearrangement by SAH (250 μM) in a comparable manner to that of SAM (Fig. 3a–b, Extended Data Figs. 7–8).
Figure 3.

LepI-catalysed reactions are SAM-dependent. (a) Time-course analysis of the consumption of 240 μM 4 in the presence of 300 nM LepI with or without cofactors; SAM (100 μM), SAH (250 μM), sinefungin (100 μM). (b) Time-course analysis of the conversion of 140 μM 6 to 2 in the presence of 300 nM LepI with or without cofactors; SAM (100 μM), SAH (250 μM), sinefungin (100 μM). (c) Time-course analysis of the production of 2 and 6 from 240 μM 4 in the presence of 300 nM LepI with or without 250 μM SAH. (d) Analysis of the relative production ratio of HDA adduct 2 and IMDA adduct 6 from 240 μM 4. In the case of nonenzymatic reaction, the reaction time is 10 min. In the case of LepI (300 nM)-catalysed reactions with or without SAH (250 μM), the reaction time is 4.0 min. Cont. means LepI without cofactors. (e) Structures of SAM, SAH, and sinefungin.
In the presence of 250 μM SAH, at least 90% of retro-Claisen rearrangement activity of LepI is inhibited at shorter time points (Fig. 3b), which provides a quantitative measure of the product distribution result from IMDA vs HDA reactions in the presence of LepI (~ 1:1 periselectivity) (Fig. 3c-d, Extended Data Fig. 9a). In contrast, in the absence of LepI, we have shown that the periselectivity between IMDA and HDA is ~ 94:6 (Fig. 3d, Extended Data Fig. 9b). Therefore, while LepI exerts significant influence towards formation of the HDA product 2, it cannot completely suppress the formation of the IMDA product 6 (Fig. 3c-d, Extended Data Fig. 9a). To understand the mechanism of the LepI-catalysed reactions, we performed density functional theory (DFT) calculations28. As expected, the activation barrier for conversion of (E)-5 to 2 via endo-transition state (TS) is much lower than conversion of (Z)-5 to 2 via the exo-TS, supporting the surmise that enzymatic dehydration of 4 leads to (E)-5 (Fig. 4a and 4c). Our calculations showed that the transition states of the endo-mode IMDA and HDA reactions to form 6 and 2 from (E)-5 are one and the same (TS-1); this is a novel biosynthetic example of an ambimodal TS29 (Fig. 4a). An ambimodal TS is a normal saddle point with partially formed bonds that can lead to either of two different pericyclic reaction products. Such an ambimodal TS is followed by a bifurcation occurring after the TS on the potential energy surface (PES). This accounts for the simultaneous production of IMDA and HDA adducts from (E)-5 (Fig. 4b). The preference for the IMDA adduct under non-enzymatic conditions is consistent with the shorter C-C bond (2.91Å) compared to the C-O (3.34Å) in TS-1 (Fig. 4b). We confirmed this conclusion by performing quasi-classical molecular dynamics (MD) simulations following the procedure described previously28 (see Supplementary Information); 50 trajectories gave the DA adduct (39 trajectories) plus 11 recrossing trajectories for the transition state in the gas phase. Water catalysis should shift this more towards the HDA adduct as found experimentally (Fig. 3d). To change the outcome of this reaction, LepI must control the post-ambimodal TS bifurcation dynamics while accelerating the reaction by lowering the activation barrier of TS-130. The electrostatic catalysis by either sulfonium or ammonium ions with the amide carbonyl in TS-1 decreases the C-O bond length (3.05–3.07Å range) and increases C-C bond length (3.07–3.21Å range), resulting in an increased preference for the HDA reaction (Fig. 4b, Extended Data Fig. 10)29. Therefore, LepI shifts the post-ambimodal TS bifurcation toward the HDA adduct more effectively in the active site as compared with spontaneous reaction in water (Fig. 4b). Indeed, MD with the trimethylsulfonium catalyst gave a 34:7 ratio of HDA:DA adducts, along with 9 recrossing trajectories. The role of the sulfonium and ammonium interactions with 6 were also predicted to substantially lower the barrier (TS-2) of the retro-Claisen rearrangement of the IMDA adduct 6 to the final HDA product 2 by 2.4 or 3.4 kcal/mol (100–1000-fold acceleration), which supports the catalytic role of the positively charged SAM (Fig. 4c, Extended Data Fig. 10).
Figure 4.

Energetics and transition states of the ambimodal IMDA/HDA, and retro-Claisen pericyclic reactions leading to formation of 2 from 4. (a) Free energy diagram for the non-enzymatic formation of 2 from (E)-5 and (Z)-5 calculated with B3LYP-D3/6-31G(d), gas phase. Gibbs free energies in kcal/mol. The ambimodal TS-1 gives both 6 and 2. (b) (i) Asymmetrical bifurcating PES for the formation of HDA adduct 2 and IMDA adduct 6 from (E)-5. (ii) Catalysed ambimodal TS (TS-1) structure with coordination of a trimethylsulfonium ion model. The same shift towards preference for HDA occurs with ammonium ion catalysis. (c) Summary of LepI-catalysed reactions cascade leading to 2 from 4 via the formation of (E)-5: dehydration and the subsequent reactions, 1) “direct” path (HDA reaction), 2) “byproduct recycle” path (IMDA reaction/retro-Claisen rearrangement). Gibbs free energies (kcal/mol) of TS-1 and TS-2 are calculated with B3LYP-D3/6-311+G(d,p)//6-31G(d), CPCM water. The structures show the relative stereochemistry.
Our results showed that LepI is a multifunctional SAM-dependent enzyme that catalyses the stereoselective dehydration of 4 to (E)-5; an ambimodal IMDA and HDA reaction of (E)-5 to 6 and 2, respectively; and the first enzymatic example of retro-Claisen rearrangement of 6 to 2 (Fig. 4c). The enzyme can control the post-TS bifurcation dynamics by altering the energy surface such that the steepest downhill path from the transition state leads to the catalysed product(s) (Fig. 4b). While formation of the undesirable IMDA product cannot be completely suppressed due to the ambimodal nature of the TS, LepI relies on the additional retro-Claisen activity to convert 6 to the desired product 2. This represents a kinetic “byproduct recycle” process to overcome thermodynamic limitations and fully arrive at the desired biosynthetic end product. Lastly, the discovery of a SAM-dependent enzyme provides additional evidence of the versatility and importance of SAM in metabolism.
Online Content
Methods, along with any additional Extended Data display items and Source Data, are available in the online version of the paper; references unique to these sections appear only in the online paper.
Methods
Material, fungal strains and culture condition
A. flavus NRRL3357 was obtained from Agricultural Research Service Culture Collection (NRRL). A. nidulans FGSC A1145 was obtained from the Fungal Genetics Stock Center (http://www.fgsc.net/). A. flavus was maintained on PDA (potato dextrose agar, BD) for 3 days for sporulation or in liquid PDB medium (PDA medium without agar) for isolation of genomic DNA. A. nidulans was maintained on Czapek-Dox (CD) agar for sporulation or in liquid CD–ST medium for gene overexpression, compound production and RNA extraction (http://www.fgsc.net/).
General DNA manipulation technique
E. coli TOP10 and E. coli XL-1 were used for cloning, following standard recombinant DNA techniques. DNA restriction enzymes were used as recommended by the manufacturer (New England Biolabs, NEB). PCR was performed using Phusion High-Fidelity DNA Polymerase (NEB). The gene-specific primers are listed in Supplementary Information. PCR products were confirmed by DNA sequencing. E. coli BL21(DE3) (Novagen) was used as the E. coli host for protein expression. Saccharomyces cerevisiae strain BJ5464-NpgA (MATα ura3-52 his3-Δ200 leu2-Δ1 trp1 pep4::HIS3 prb1 Δ1.6R can1 GAL) was used as the yeast host for protein expression31 and in vivo homologous recombination to construct the A. nidulans overexpression plasmids.
Heterologous expression of lep in A. nidulans21
A. nidulans A1145 was initially grown on CD agar plates containing 10 mM uracil, 0.5 μg/mL pyridoxine HCl and 2.5 μg/mL riboflavin at 30 °C for 5 days. Fresh spores of A. nidulans were inoculated into 25 mL liquid CD media (1 L: 10 g Glucose, 50 mL 20× Nitrate salts, 1 mL Trace elements, pH 6.5) in 250-mL Erlenmeyer flask and germinated at 30 °C and 250 rpm for approximately 16 h. For the preparation of 20 × Nitrate salts, 120 g NaNO3, 10.4 g KCl, 10.4 g MgSO4 · 7H2O, 30.4 g KH2PO4 were dissolved in 1 L double distilled water. The 100 mL trace elements with pH 6.5 contains 2.20 g ZnSO4 · 7H2O, 1.10 g H3BO3, 0.50 g, MnCl2 · 4H2O, 0.16 g FeSO4 · 7H2O, 0.16 g CoCl2 · 5H2O, 0.16 g CuSO4•5H2O, and 0.11 g (NH4)6Mo7O24 · 4H2O. Mycelia were harvested by centrifugation at 3,500 rpm for 10 min, and washed with 10 mL Osmotic buffer (1.2 M MgSO4, 10 mM sodium phosphate, pH 5.8). Then the mycelia were transferred into 10 mL of Osmotic buffer containing 30 mg lysing enzymes from Trichoderma and 20 mg Yatalase in a 125-mL flask. The flask was kept in shaker at 80 rpm for overnight at 30 °C. Cells were collected in a 30 mL Corex tube and overlaid gently by 10 mL of Trapping buffer (0.6 M sorbitol, 0.1 M Tris-HCI, pH 7.0). After centrifugation at 3,500 rpm for 15 min at 4 °C, protoplasts were collected in the interface of the two buffers. The protoplasts were then transferred to a sterile 15-mL falcon tube and washed by 10 mL STC buffer (1.2 M sorbitol, 10 mM CaCl2, 10 mM Tris-HCI, pH 7.5). The protoplasts were resuspended in 1 mL STC buffer for transformation. Then, the plasmids (see Supplementary Information) were added to 100 μL protoplast suspension and the mixture incubated 60 min on ice. Then 600 μL of PEG solution at pH 7.5 (60% PEG, 50 mM calcium chloride and 50 mM Tris-HCl) was added to the protoplast mixture, and the mixture was incubated at room temperature for additional 20 min. The mixture was spread on the regeneration dropout solid medium (CD solid medium with 1.2 M sorbitol and appropriate supplements) and incubated at 30 °C for 2 to 3 days. The transformants were grown in liquid CD-ST (1 L: 20 g starch, 20 g casamino acids, 50 mL 20 × nitrate salts, 1 mL trace elements) medium for 3 to 4 days before extraction.
Analysis of metabolites and isolation of compounds
For small scale analysis, the transformants of A. nidulans strains were grown for 3 to 4 days in 20 mL liquid CD-ST and then extracted with 10 mL ethyl acetate. The organic phase was dried by speed vacuum and dissolved in methanol for analysis. LC–MS analyses were performed on a Shimadzu 2020 EV LC–MS (Kinetex 1.7 μm C18 100 Å, LC Column 100 × 2.1 mm) using positive-and negative-mode electrospray ionization with a linear gradient of 5–95% acetonitrile MeCN–H2O with 0.5% formic acid in 15 min followed by 95% MeCN for 3 min with a flow rate of 0.3 ml/min. The results are shown in Fig. 1d.
For isolation of compounds, the transformants of A. nidulans strains were grown for 84 h in 4 × 1 L liquid CD-ST and then filtered to collect the cells from liquid culture. The cells were extracted with 1 L acetone and the extracts were evaporated to dryness and partitioned between ethyl acetate/H2O two times. After evaporation of the organic phase, the crude extracts were separated by silicagel chromatography. Fractions containing the target compounds were combined and used for further purification by HPLC with a semi-preparative C18 column of Kinetics New column, 5μm, 10 × 250 mm. For elucidation of chemical structures, 1D and 2D NMR spectra were obtained on Bruker AV500 spectrometer at the UCLA Molecular Instrumentation Center. High resolution mass spectra were obtained from Thermo Fisher Scientific Exactive Plus with IonSense ID-CUBE DART source at the UCLA Molecular Instrumentation Center.
Protein expression and purification of LepI from E. coli. BL21 (DE3)
The open reading frame of lepI was amplified using cDNA from the transformant of A. nidulans as a template by PCR with primers of pMO0048-f1/r1 and ligated with linear pet28b expression vector which is amplified using it by PCR with pMO0048-f2/r2 to generate pMO0048 using GeneArt Seamless Cloning and Assembly kit (Thermo Fisher Scientific). The identity of the resulting vector pMO0048 was confirmed by DNA sequencing. This plasmid was used to express LepI for preparing purified samples of recombinant LepI to be used in in vitro assays.
Overexpression and subsequent protein purification of LepI was performed as follows: BL21 (DE3) harboring plasmid pMO0048 was grown overnight in 2 × 5 ml of LB medium with 50 μg/ml kanamycin at 37 °C. Each 2 × 1 L of fresh LB medium with 50 μg/ml kanamycin was inoculated with 5 ml of the overnight culture and incubated at 37 °C until the optical density at 600 nm (OD600) reached 0.6. Then expression of the gene was induced with 50 μM isopropylthio-β-D-galactoside (IPTG) at 16 °C. Incubation was continued for another 20 h, after which pellets were collected by using centrifuge and resuspended in lysis buffer (10 mM imidazole, 50 mM Tris-HCl, 500 mM NaCl, pH 8.0) and lysed on ice by sonication. The lysate was centrifuged at 15,000 × g for 30 min at 4 °C to remove the cellular debris. One-step purification of the recombinant His6-tagged fusion LepI from soluble protein by affinity chromatography with Ni-NTA agarose resin (Qiagen) was carried out according to the manufacturer’s instructions. Purified LepI were concentrated and exchanged into storage buffer (50 mM Tris-HCl, 100 mM NaCl, 10% glycerol, pH8.0) with Centriprep filters (Amicon). The purified LepI was checked by SDS-PAGE. Bradford Protein Assay (Bio-Rad) was used to calculate protein concentration. Protein expression and purification of LepF from BJ5464-NpgA was described in Supplementary Information.
Activity of LepF-catalysed reaction using the ketone 3 as the substrate
Assays for LepF activity with 100 μM 3 in Tris-HCl buffer (50 mM Tris-HCl, 100 mM NaCl, 10% glycerol, 10 mM NADPH, pH 8.0) were performed at 100 μL scale with 100 μM LepF, at 30 °C for 1 h. Then the reaction was quenched with the equal volume of cold acetonitrile. Protein was precipitated and removed by centrifugation and the supernatant analyzed by LC–MS. LC–MS analyses were performed on a Shimadzu 2020 EV LC–MS (Kinetex 1.7 μm C18 100 Å, LC Column 100 × 2.1 mm) using positive- and negative-mode electrospray ionization with a linear gradient of 5–95% acetonitrile MeCN–H2O with 0.5% formic acid in 15 min followed by 95% MeCN for 3 min with a flow rate of 0.3 ml/min. The result is shown in Extended Data Fig.1.
Activity assay of LepI using the alcohol 4 and 4′ as the substrate
Preparation of compound 4 and 4′ was performed as follows. To the solution of compound 3 (3.5 mg, 10 μmol) in 0.5 mL EtOH was added NaBH4 (4.0 mg, 100 μmol) at 0 °C and the mixture was stirred at room temperature for 15 min. The reaction mixture was quenched with 0.5 mL 1 M HCl, and the whole was extracted with 0.5 mL ethyl acetate twice. The extract was concentrated and the residue was purified with a semi-preparative C18 column of Kinetics New column, 5 μm, 10 × 250 mm. The using separation conditions was a linear gradient of 40–95% acetonitrile MeCN–H2O in 15 min followed by 95% MeCN for 3 min with a flow rate of 3.0 ml/min. The fractions containing 4 and 4′ were not concentrated and immediately used as the substrate solution, because the dehydration takes place during concentration.
Assays for LepI activity with 4 and 4′ in phosphate buffer (20 mM Na2HPO4, 50 mM NaCl, pH 8.0) were performed at 50 μL scale with 3.0 μM LepI, at 30 °C for 0.5 h. Then the reaction was quenched with the equal volume of cold acetonitrile. Protein was precipitated and removed by centrifugation, and then the supernatant was analyzed by LC–MS as described above. These results are shown in Fig. 2a.
Time-course analysis of LepI-catalysed reactions using the alcohol 4 as the substrate
To a solution containing 300 nM LepI in phosphate buffer (20 mM Na2HPO4, 50 mM NaCl, pH 8.0) at 30 °C was added 240 μM 4 in order to initiate the enzymatic reaction (total volume was 500 μL). The concentration of 4 was estimated by product concentration based on the standard curves of 2 and 6. In the case of cofactors (SAM, SAH, and sinefungin) adding assay, the reaction mixture containing 300 nM LepI and 250 μM SAH with or without 100 μM SAM or 100 μM sinefungin was incubated at room temperature for 10 min. Then, 240 μM 4 was added to the reaction mixture to initiate the enzymatic reaction (total volume was 500 μL). At each given time point (0.5, 1.0, 2.0, 3.0, 4.0, 5.0, 6.0, 8.0, and 10 min), a 50 μL aliquot of the reaction mixture was taken and quenched by mixing with 50 μL of cold acetonitrile. After centrifugation, the supernatant was subjected to HPLC analysis using a C18 column (Phenomenex Luna C18 (2) 5 μm, 2.0 × 100 mm) with isoclatic conditions (45% of H2O in CH3CN). The standard curves of 2 and 6 was generated based on peak areas at 243 nm by HPLC. The products concentarations of 2 and 6 were estimated based upon the standard curves of 2 and 6, respectively. The error bars represent standard deviation (s.d.) of three independent replicates. These results are shown in Figs. 2b, 3a, 3c-d and Extended Data Figs. 7a, 9a.
In vitro reaction of LepI using 7–9 as the substrates
50 μL reaction mixture containing the desired compound (7–9) in phosphate buffer (20 mM Na2HPO4, 50 mM NaCl, pH 8.0) was incubated with 30 μM LepI at 30 °C for 12 h. Then reaction was quenched with 50 μL acetonitrile. Protein was precipitated and removed by centrifugation and the supernatant analyzed by HPLC using a C18 column (Kinetex 1.7 μm C18 100 Å, LC Column 100 × 2.1 mm) with a linear gradient of 5–95% acetonitrile MeCN–H2O with 0.5% formic acid in 15 min followed by 95% MeCN for 3 min with a flow rate of 0.3 ml/min. The results are shown in Extended Data Fig 4a.
Evaluation of inhibitory activity of 7 against LepI-catalysed retro-Claisen rearrangement
To 50 μL solution containing 300 nM LepI in phosphate buffer (20 mM Na2HPO4, 50 mM NaCl, pH 8.0) was added DMSO or 7 (1–500 μM) dissolved in DMSO. Then reactions were initiated by the addition of 100 μM 6. After 10 min at 30 °C, reactions were quenched by the addition of 50 μL of cold acetonitrile. Protein was precipitated and removed by centrifugation and the supernatant analyzed by HPLC using a C18 column (Phenomenex Luna C18 (2) 5 μm, 2.0 × 100 mm) with isoclatic conditions (50% of H2O in CH3CN). Results were quantified by a standard curve of product 2. Final results were calculated as percent of DMSO treated controls. Data fitting was performed using GraphPad Prism 6 and IC50 value represents mean ± standard deviation (s.d.) of three independent replicates. This result is shown in Extended Data Fig. 4b.
Activity assay and kinetic analysis of LepI using compound 6 as a substrate
Assays for LepI activity with 6 in phosphate buffer (20 mM Na2HPO4, 50 mM NaCl, pH 8.0) were performed at 50 μL scale with 300 nM LepI, 30 °C for 3 min. Then the reaction was quenched with the equal volume of cold acetonitrile. Protein was precipitated and removed by centrifugation and the supernatant analyzed by HPLC using a C18 column (Phenomenex Luna C18 (2) 5 μm, 2.0 × 100 mm) with isoclatic conditions (50% of H2O in CH3CN). These results are shown in Fig. 2c. To determine the kinetics of LepI, the assays were performed at 50 μL scale with 150 nM LepI and 3.0–300 μM 6 in phosphate buffer (20 mM Na2HPO4, 50 mM NaCl, pH 8.0) at 30 °C for 3 min. The reactions were quenched by adding 50 μL acetonitrile. After centrifugation, supernatant was analyzed by HPLC as mentioned above. Data fitting was performed using GraphPad Prism 6, and KM and kcat values represent mean ± standard deviation (s.d.) of three independent replicates. The result is shown in Fig. 2d.
The confirmation of SAM presence in LepI and quantification of the efficiency of SAM presence in LepI
300 μM LepI in 20 μL storage buffer (50 mM Tris-HCl, 100 mM NaCl, 10% glycerol, pH8.0) was denatured by adding 60 μL acetonitrile. 300 μM LepI in 50 μL storage buffer (50 mM Tris-HCl, 100 mM NaCl, 10% glycerol, pH8.0) and 100 μM SAM in water was boiled at 95 °C for 10min. Then, the solutions were centrifuged and the supernatants analyzed by LC–MS. The standards of SAM and MTA were also analyzed by HPLC using a C18 column (Kinetex 1.7 μm C18 100 Å, LC Column 100 × 2.1 mm) with a linear gradient of 5–95% acetonitrile MeCN–H2O with 0.5% formic acid in 15 min followed by 95% MeCN for 3 min with a flow rate of 0.3 ml/min. UV detection was performed at 258 nm. To estimate the efficiency of SAM presence in LepI, the concentration of MTA from boiled LepI was quantified by the standard curve of MTA that was generated based on peak areas at 258 nm by HPLC. The concentration of MTA was estimated to more than 250 μM in 300 μM LepI. These results are shown in Extended Data Fig. 6 and Supplementary Fig. 8.
Time-course analysis of LepI-catalysed reactions using 6 as a substrate
To a solution containing 300 nM LepI in phosphate buffer (20 mM Na2HPO4, 50 mM NaCl, pH 8.0) at 30 °C was added 140 μM 6 in order to initiate the enzymatic reaction (total volume was 500 μL). In the case of cofactors (SAM, SAH, and sinefungin) adding assay, the reaction mixture containing 300 nM LepI and 250 μM SAH with or without 100 μM SAM or 100 μM sinefungin was incubated at room temperature for 10 min. Then, 140 μM 6 was added to the reaction mixture to initiate the enzymatic reaction (total volume was 500 μL). At each given time point (0.5, 1.0, 1.5, 2.0, 2.5, 3.0, 4.0, 6.0, and 10 min), a 50 μL aliquot of the reaction mixture was taken and quenched by mixing with 50 μL of cold acetonitrile. After centrifugation, the supernatant was subjected to HPLC analysis using a C18 column (Phenomenex Luna C18 (2) 5 μm, 2.0 × 100 mm) with isoclatic conditions (45% of H2O in CH3CN). The products concentaration of 2 was estimated based upon the standard curve of 2. The error bars represent standard deviation (s.d.) of three independent replicates. These results are shown in Fig. 3b and Extended Data Figs. 5, 7b.
Evaluation of dose-dependency of SAH-inhibited and SAM-rescued activities against LepI-catalysed retro-Claisen rearrangement
To 50 μL solution containing 300 nM LepI in phosphate buffer (20 mM Na2HPO4, 50 mM NaCl, pH 8.0) was added diffferent concentration of SAH (0–500 μM) or 250 μM SAH with different concentration of SAM (0–100 μM) and incubated at r.t. for 10 min. Then 100 μM 6 was added to the reaction mixture to initiate the enzymatic reaction. After 5 min at 30 °C, reactions were quenched by the addition of 50 μL of acetonitrile. Protein was precipitated and removed by centrifugation and the supernatant analyzed by HPLC using a C18 column (Phenomenex Luna C18 (2) 5 μm, 2.0 × 100 mm) with isoclatic conditions (45% of H2O in CH3CN). Results were quantified by the standard curve of product 2. Final results were calculated as percent of controls. The error bars represent standard deviation (s.d.) of three independent replicates. Data fitting was performed using GraphPad Prism 6. The results are shown in Extended Data Fig. 8.
Computational calculations
The DFT calculations were performed with Gaussian 0932. Geometry optimizations of all the minima and transition state structures were carried out at the B3LYP-D3 level of theory with the 6–31G(d) basis set. Vibrational frequencies were computed at the same level to verify that optimized structures are energy minima or transition states and to evaluate zero-point vibrational energies (ZPVE) and thermal corrections at 298 K. A quasi-harmonic correction was applied during the entropy calculation by setting all positive frequencies that are less than 100 cm−1 to 100 cm−1. Solvation energies were evaluated by a self-consistent reaction field (SCRF) using the CPCM model with a larger basis set, 6–311+G(d,p). Single point energy calculations were carried out at other levels of theory, such as M06-2X and wB97XD; systematic shifts in energies were observed, while the relative energetics remaining the same. The results are shown in Fig. 4, Extended Data Fig. 10 and Supplementary Figs. 11–17.
Extended Data
Extended Data Figure 1.

LC–MS analysis of in vitro reaction of 3 with LepF. The extracted ion chromatograms (EICs) under positive ionization are shown. The molecular weight of alcohol 4 and 4′ is m/z 354 under positive ionization. Because the enzymatic activity of LepF is low and the alcohol 4 is very unstable, we were not able to obtain sufficient amount of 4 as the substrate for in vitro reaction of LepI. Thus, we obtained the alcohol 4 by using the chemical reduction of the ketone 3 with NaBH4. Since NaBH4 reduces the ketone 3 non-stereoselectively, 4 and diastereomer 4′ were formed. After the isolation of 4 and 4′ by HPLC, the fractions containing 4 and 4′ were not concentrated and were immediately used as the substrate. The stereochemistry of the secondary alcohol in 4 and 4′ is not determined.
Extended Data Figure 2.
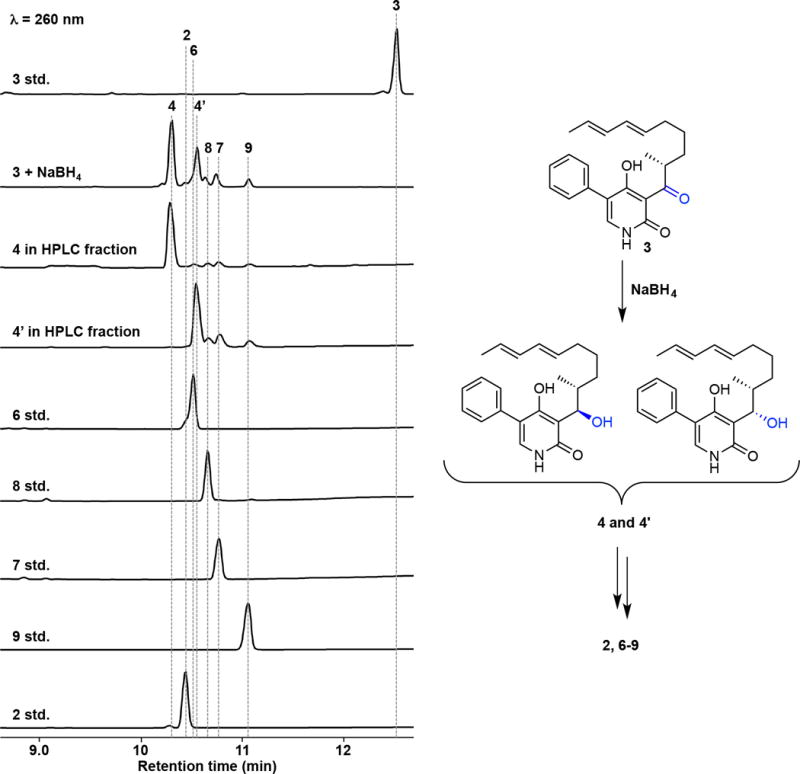
HPLC analysis of chemical reduction of 3 with NaBH4. The reaction mixture containing 1 mM 3 and 10 mM NaBH4 with EtOH (50 μL) was incubated at 0 °C for 1 min. Then, the reaction was quenched with water. After centrifugation, the supernatant was analyzed by HPLC. The reduction of 3 gave the alcohol 4 and diastereomer 4′. The spontaneous dehydration of both alcohols resulted in the formation of HDA and IMDA products via the E/Z mixture of quinone methide 5. The isolated 4 and 4′ also readily dehydrated and converted to the mixture of the desired HDA and the undesired HDA and IMDA products, showing the instability of these compounds. The structures show the relative stereochemistry.
Extended Data Figure 3.

Reaction analysis of 6–9 under heating condition. 6 (dissolved in 5% DMSO with H2O) was boiled at 95 °C for 1 h. 7–9 (dissolved in 5% DMSO with H2O) were boiled 95 °C for 10 h. 6 was completely converted to 2 via [3,3]-sigmatropic retro-Claisen rearrangement. This reaction is irreversible under the conditions. It should be noted that the conversion of 6 to 2 via cycloreversion can be ruled out, since 6 was completely converted to 2 without any other IMDA/HDA side products. No reactions occurred in the case of 7. 8 and 9 can be interconvertible via Claisen rearrangement. In this case, retro-Claisen rearrangement (8 to 9) is more preferable than forward Claisen rearrangement (9 to 8). The structures show the relative stereochemistry.
Extended Data Figure 4.

Analysis of the substrate specificity of LepI. (a) In vitro reactions of other IMDA products 7–9 with 30 μM LepI for 12 h. (i) 8 in buffer, (ii) 8 with LepI, (iii) 7 in buffer, (iv) 7 with LepI, (v) 9 in buffer, (vi) 9 with LepI. The experimental details are described in Methods. (b) Elucidation of inhibitory activity for retro-Claisen rearrangement of 7 against LepI. The experimental details are described in Methods. IC50 value is mean ± standard deviation (s.d.) of three independent experiments. The structures show the relative stereochemistry.
Extended Data Figure 5.

Time-course analysis of LepI-catalysed retro-Claisen rearrangement of 6 to 2. The experimental details are described in Methods. The data represent one representative experiment from at least three independent replicates.
Extended Data Figure 6.

HPLC analysis showing that purified LepI retains SAM. SAM was detected from the supernatant of denatured LepI by acetonitrile. When LepI was denatured by heating the sample at 95 °C for 10 min, a single peak corresponding to 5′-deoxy-5′-(methylthio)adenosine (MTA), a major degradation product of SAM25, was also detected from the supernatant of boiled LepI. Since SAM to MTA conversion is nearly quantitative and an MTA standard curve can be readily constructed, we quantified that ~90% of LepI still retains SAM after purification. HPLC profiles of (i) denatured LepI by acetonitrile, (ii) boiled LepI at 95 °C for 10 min, (iii) the authentic reference of SAM, (iv) boiled SAM at 95 °C for 10 min, and (v) the authentic reference of MTA. The experimental details are described in Methods.
Extended Data Figure 7.
HPLC analysis of SAM-dependent LepI-catalysed reactions (a) Analysis of in vitro reaction of 240 μM 4 with 300 nM LepI at 30 °C for 5 min in the presence and absence of cofactors. The concentrations of SAH, SAM, and sinefungin used in this experiment are 250 μM, 100 μM, and 100 μM, respectively. The data represent one representative experiment from at least three independent replicates. (b) Analysis of in vitro reaction of 140 μM 6 with 300 nM LepI at 30 °C for 4 min in the presence and absence of cofactors. The concentrations of SAH, SAM, and sinefungin used in this experiment are 250 μM, 100 μM, and 100 μM, respectively. The data represent one representative experiment from at least three independent replicates.
Extended Data Figure 8.

SAH is a competitive inhibitor of LepI retro-Claisen rearrangement. (a) Dose-dependent inhibition of retro-Claisen rearrangement by SAH. (b) Dose-dependent recovery of retro-Claisen rearrangement by SAM in the presence of 250 μM SAH. The experimental details are described in Methods. Error bars represent standard deviation of three independent experiments.
Extended Data Figure 9.

Time-course analysis of relative production ratio of 2 over sum of 2 and 6. The substrate used in this study is alcohol 4. (a) LepI-catalysed reaction with or without SAH (250 μM). (b) non-enzymatic reaction. The initial production ratio between LepI-catalysed and non-catalysed reaction are clearly different. This data supported that LepI catalysed the competitive IMDA/HDA reactions by changing the preference of the outcome.
Extended Data Figure 10.
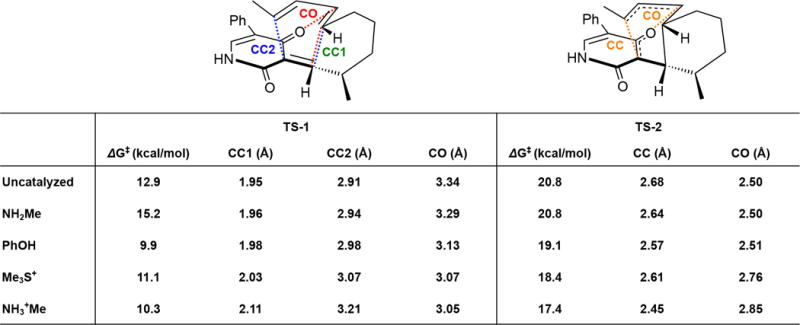
Calculated free energies and bond distances of ambimodal TS (TS-1) and the retro-Claisen rearrangement TS (TS-2), uncatalysed and with various catalysts, calculated with B3LYP-D3/6-311+G(d,p)//6-31G(d), CPCM water.
Supplementary Material
Acknowledgments
This work was supported by the NIH (1DP1GM106413 and 1R35GM118056), the NSF (CHE-1361104 to K.N.H.), and the JSPS Program for Advancing Strategic International Networks to Accelerate the Circulation of Talented Researchers (G2604 to K.W.).
Footnotes
Author contributions M.O., F. L., Y.H., K.N.H. and Y.T. developed the hypothesis and designed the study. M.O. performed all in vivo and in vitro experiments, as well as compound isolation and characterization. M.O., Y.H. and M.C. performed protein purification. M.S. and M.-C.T. performed compound characterization. F.L., Z.Y. and K.N.H. performed the computational experiments. All authors analyzed and discussed the results. M.O., F.L., K.W., K.N.H. and Y.T. prepared the manuscript.
Competing financial interests The authors declare no competing financial interests.
Data Availability The data that support the findings of this study are available within the paper and its Supplementary Information, or are available from the corresponding author upon reasonable request.
References
- 1.Hoffmann R, Woodward RB. The conservation of orbital symmetry. Acc Chem Res. 1968;1:17–22. [Google Scholar]
- 2.Takao K, Munakata R, Tadano K. Recent advances in natural product synthesis by using intramolecular Diels-Alder reactions. Chem Rev. 2005;105:4779–4807. doi: 10.1021/cr040632u. [DOI] [PubMed] [Google Scholar]
- 3.Nicolaou KC, Snyder SA, Montagnon T, Vassilikogiannakis G. The Diels-Alder reaction in total synthesis. Angew Chem Intl Ed. 2002;41:1668–1698. doi: 10.1002/1521-3773(20020517)41:10<1668::aid-anie1668>3.0.co;2-z. [DOI] [PubMed] [Google Scholar]
- 4.Ilardi EA, Stivala CE, Zakarian A. [3,3]-Sigmatropic rearrangements: recent applications in the total synthesis of natural products. Chem Soc Rev. 2009;38:3133–3148. doi: 10.1039/b901177n. [DOI] [PMC free article] [PubMed] [Google Scholar]
- 5.Ardkhean R, et al. Cascade polycyclizations in natural product synthesis. Chem Soc Rev. 2016;45:1557–1569. doi: 10.1039/c5cs00105f. [DOI] [PubMed] [Google Scholar]
- 6.Nicolaou KC, Vourloumis D, Winssinger N, Baran PS. The art and science of total synthesis at the dawn of the twenty-first century. Angew Chem Intl Ed. 2000;39:44–122. [PubMed] [Google Scholar]
- 7.Kim HJ, et al. Enzyme-catalysed [4+2] cycloaddition is a key step in the biosynthesis of spinosyn A. Nature. 2011;473:109–112. doi: 10.1038/nature09981. [DOI] [PMC free article] [PubMed] [Google Scholar]
- 8.Li S, et al. Hapalindole/ambiguine biogenesis is mediated by a Cope rearrangement, C-C bond-forming cascade. J Am Chem Soc. 2015;16:15366–15369. doi: 10.1021/jacs.5b10136. [DOI] [PMC free article] [PubMed] [Google Scholar]
- 9.Andrews PR, Smith GD, Young IG. Transition-state stabilization and enzymic catalysis. Kinetic and molecular orbital studies of the rearrangement of chorismate to prephenate. Biochemistry. 1973;12:3492–3498. doi: 10.1021/bi00742a022. [DOI] [PubMed] [Google Scholar]
- 10.Cary JW, et al. An Aspergillus flavus secondary metabolic gene cluster containing a hybrid PKS–NRPS is necessary for synthesis of the 2-pyridones, leporins. Fungal Genet Biol. 2015;81:88–97. doi: 10.1016/j.fgb.2015.05.010. [DOI] [PubMed] [Google Scholar]
- 11.Walsh CT. A chemocentric view of the natural product inventory. Nat Chem Biol. 2015;11:620–624. doi: 10.1038/nchembio.1894. [DOI] [PubMed] [Google Scholar]
- 12.Lin CI, McCarty RM, Liu HW. The enzymology of organic transformations: A survey of name reactions in biological systems. Angew Chem Intl Ed. 2017;44:3446–3489. doi: 10.1002/anie.201603291. [DOI] [PMC free article] [PubMed] [Google Scholar]
- 13.Minami A, Oikawa H. Recent advances of Diels-Alderases involved in natural product biosynthesis. J Antibiot (Tokyo) 2016;69:500–506. doi: 10.1038/ja.2016.67. [DOI] [PubMed] [Google Scholar]
- 14.Tang MC, et al. Oxidative cyclization in natural product biosynthesis. Chem Rev. 2017;117:5226–5333. doi: 10.1021/acs.chemrev.6b00478. [DOI] [PMC free article] [PubMed] [Google Scholar]
- 15.Stocking EM, Williams RM. Chemistry and biology of biosynthetic Diels-Alder reactions. Angew Chem Intl Ed. 2003;42:3078–3115. doi: 10.1002/anie.200200534. [DOI] [PubMed] [Google Scholar]
- 16.Oikawa H, Tokiwano T. Enzymatic catalysis of the Diels-Alder reaction in the biosynthesis of natural products. Nat Prod Rep. 2004;21:321–352. doi: 10.1039/b305068h. [DOI] [PubMed] [Google Scholar]
- 17.Desimoni G, Tacconi G. Heterodiene syntheses with α,β-unsaturated carbonyl compounds. Chem Rev. 1975;75:651–692. doi: 10.1021/acs.chemrev.7b00322. [DOI] [PubMed] [Google Scholar]
- 18.Jessen HJ, Gademann K. 4-Hydroxy-2-pyridone alkaloids: structures and synthetic approaches. Nat Prod Rep. 2010;27:1168–1185. doi: 10.1039/b911516c. [DOI] [PubMed] [Google Scholar]
- 19.Van De Water RW, Pettus TRR. o-Quinone methides: intermediates underdeveloped and underutilized in organic synthesis. Tetrahedron. 2002;58:5367–5405. [Google Scholar]
- 20.Snider BB, Lu Q. Total synthesis of (±)-leporin A. J Org Chem. 1996;61:2839–2844. doi: 10.1021/jo952053i. [DOI] [PubMed] [Google Scholar]
- 21.Li L, et al. Biochemical characterization of a eukaryotic decalin-forming Diels–Alderase. J Am Chem Soc. 2016;138:15837–15840. doi: 10.1021/jacs.6b10452. [DOI] [PMC free article] [PubMed] [Google Scholar]
- 22.Halo LM, et al. Late stage oxidations during the biosynthesis of the 2-pyridone tenellin in the entomopathogenic fungus Beauveria bassiana. J Am Chem Soc. 2008;130:17988–17996. doi: 10.1021/ja807052c. [DOI] [PubMed] [Google Scholar]
- 23.Jansson A, et al. Aclacinomycin 10-hydroxylase is a novel substrate-assisted hydroxylase requiring S-adenosyl-L-methionine as cofactor. J Biol Chem. 2005;280:3636–3644. doi: 10.1074/jbc.M412095200. [DOI] [PubMed] [Google Scholar]
- 24.Jiang C, et al. Formation of the Δ18,19 double bond and bis(spiroacetal) in salinomycin is atypically catalyzed by SlnM, a methyltransferase-like enzyme. Angew Chem Intl Ed. 2015;54:9097–9100. doi: 10.1002/anie.201503561. [DOI] [PMC free article] [PubMed] [Google Scholar]
- 25.Iwig DF, Booker SJ. Insight into the polar reactivity of the onium chalcogen analogues of S-adenosyl-L-methionine. Biochemistry. 2004;43:13496–13509. doi: 10.1021/bi048693+. [DOI] [PubMed] [Google Scholar]
- 26.Coward JK, Slisz EP. Analogs of S-adenosylhomocysteine as potential inhibitors of biological transmethylation. Specificity of the S-adenosylhomocysteine binding site. J Med Chem. 1973;16:460–463. doi: 10.1021/jm00263a008. [DOI] [PubMed] [Google Scholar]
- 27.Bauer NJ, Kreuzman AJ, Dotzlaf JE, Yeh WK. Purification, characterization, and kinetic mechanism of S-adenosyl-L-methionine:macrocin O-methyltransferase from Streptomyces fradiae. J Biol Chem. 1988;263:15619–15625. [PubMed] [Google Scholar]
- 28.Patel A, et al. Dynamically complex [6+4] and [4+2] cycloadditions in the biosynthesis of spinosyn A. J Am Chem Soc. 2016;138:3631–3634. doi: 10.1021/jacs.6b00017. [DOI] [PMC free article] [PubMed] [Google Scholar]
- 29.Ess DH, et al. Bifurcations on potential energy surfaces of organic reactions. Angew Chem Intl Ed. 2008;47:7592–7601. doi: 10.1002/anie.200800918. [DOI] [PMC free article] [PubMed] [Google Scholar]
- 30.Hong YJ, Tantillo DJ. Biosynthetic consequences of multiple sequential post-transition-state bifurcations. Nat Chem. 2014;6:104–111. doi: 10.1038/nchem.1843. [DOI] [PubMed] [Google Scholar]
- 31.Xu W, Cai X, Jung ME, Tang Y. Analysis of intact and dissected fungal polyketide synthase-nonribosomal peptide synthetase in vitro and in Saccharomyces cerevisiae. J Am Chem Soc. 2010;132:13604–13607. doi: 10.1021/ja107084d. [DOI] [PMC free article] [PubMed] [Google Scholar]
- 32.Frisch MJ, et al. Gaussian 09, Revision C.01. Gaussian Inc; Wallingford CT: 2010. [Google Scholar]
Associated Data
This section collects any data citations, data availability statements, or supplementary materials included in this article.