

Abstract
INTRODUCTION
The overall organization of budding yeast chromosomes is driven and regulated by four factors: (i) the tethering and clustering of centromeres at the spindle pole body; (ii) the loose tethering of telomeres at the nuclear envelope, where they form small, dynamic clusters; (iii) a single nucleolus in which the ribosomal DNA (rDNA) cluster is sequestered from other chromosomes; and (iv) chromosomal arm lengths. Hi-C, a genomic derivative of the chromosome conformation capture approach, quantifies the proximity of all DNA segments present in the nuclei of a cell population, unveiling the average multiscale organization of chromosomes in the nuclear space. We exploited Hi-C to investigate the trajectories of synthetic chromosomes within the Saccharomyces cerevisiae nucleus and compare them with their native counterparts.
RATIONALE
The Sc2.0 genome design specifies strong conservation of gene content and arrangement with respect to the native chromosomal sequence. However, synthetic chromosomes incorporate thousands of designer changes, notably the removal of transfer RNA genes and repeated sequences such as transposons and subtelomeric repeats to enhance stability. They also carry loxPsym sites, allowing for inducible genome SCRaMbLE (synthetic chromosome rearrangement and modification by loxP-mediated evolution) aimed at accelerating genomic plasticity. Whether these changes affect chromosome organization, DNA metabolism, and fitness is a critical question for completion of the Sc2.0 project. To address these questions, we used Hi-C to characterize the organization of synthetic chromosomes.
RESULTS
Comparison of synthetic chromosomes with native counterparts revealed no substantial changes, showing that the redesigned sequences, and especially the removal of repeated sequences, had little or no effect on average chromosome trajectories. Sc2.0 synthetic chromosomes have Hi-C contact maps with much smoother contact patterns than those of native chromosomes, especially in subtelomeric regions. This improved “mappability” results directly from the removal of repeated elements all along the length of the synthetic chromosomes. These observations highlight a conceptual advance enabled by bottom-up chromosome synthesis, which allows refinement of experimental systems to make complex questions easier to address. Despite the overall similarity, differences were observed in two instances. First, deletion of the HML and HMR silent mating-type cassettes on chromosome III led to a loss of their specific interaction. Second, repositioning the large array of rDNA repeats nearer to the centromere cluster forced substantial genome-wide conformational changes—for instance, inserting the array in the middle of the small right arm of chromosome III split the arm into two noninteracting regions. The nucleolus structure was then trapped in the middle between small and large chromosome arms, imposing a physical barrier between them.
In addition to describing the Sc2.0 chromosome organization, we also used Hi-C to identify chromosomal rearrangements resulting from SCRaMbLE experiments. Inducible recombination between the hundreds of loxPsym sites introduced into Sc2.0 chromosomes enables combinatorial rearrangements of the genome structure. Hi-C contact maps of two SCRaMbLE strains carrying synIII and synIXR chromosomes revealed a variety of cis events, including simple deletions, inversions, and duplications, as well as translocations, the latter event representing a class of trans SCRaMbLE rearrangements not previously observed.
CONCLUSION
This large data set is a resource that will be exploited in future studies exploring the power of the SCRaMbLE system. By investigating the trajectories of Sc2.0 chromosomes in the nuclear space, this work paves the way for future studies addressing the influence of genome-wide engineering approaches on essential features of living systems.
Graphical abstract
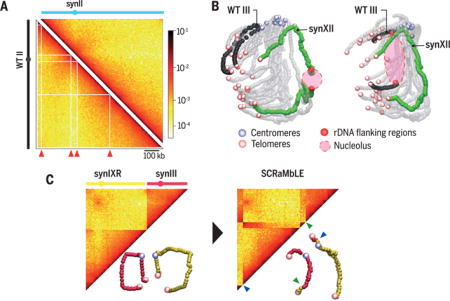
Synthetic chromosome organization. (A) Hi-C contact maps of synII and native (wild-type, WT) chromosome II. Red arrowheads point to filtered bins (white vectors) that are only present in the native chromosome map. kb, kilobases. (B) Three-dimensional (3D) representations of Hi-C maps of strains carrying rDNA either on synXII or native chromosome III. (C) Contact maps and 3D representations of synIXR (yellow) and synIII (pink) before (left) and after (right) SCRaMbLE. Translocation breakpoints are indicated by green and blue arrowheads.
Genes in the genome of the budding yeast Saccharomyces cerevisiae are nonrandomly distributed along its 16 chromosomes. For instance, centromere- and telomere-proximal regions are enriched in families of co-regulated genes (1–4). Chromosome three-dimensional (3D) organization in this species has been studied through imaging and genetic studies (5–8), revealing a characteristic Rabl organization (9). Four main factors drive the overall organization: (i) 16 centromeres tethered and clustered at the spindle pole body (SPB, the yeast microtubule organizing center); (ii) telomeres forming smaller groups tethered at the nuclear envelope; (iii) a single nucleolus across the nucleus from the SPB, where the ribosomal DNA (rDNA) is sequestered from other chromosomes; and (iv) chromosomal arm lengths. In addition to these factors, several sequences have been shown or suggested to influence the organization. For instance, transfer RNA (tRNA) genes have been proposed to influence chromosome folding through repositioning in the vicinity of either the SPB or the nucleolus (10, 11). Telomeric repeats may also play a role in telomere clustering and anchoring to the nuclear envelope (8, 12). Sc2.0 genome design specifies strong conservation of gene content and arrangement with respect to the native yeast genome (13). However, synthetic chromosomes encode thousands of designer changes intended to improve genetic stability and increase genetic flexibility (13). For example, tRNA genes were deleted during the design of Sc2.0 chromosomes, to be relocated to a separate “neochromosome” (13), and subtelomeric regions were substantially altered as well, with large repeated sequences corresponding either to Y′ or gene families deleted. Further, loxPsym sites encoded by Sc2.0 chromosomes enable inducible evolution by SCRaMbLE (synthetic chromosome rearrangement and modification by loxP-mediated evolution) (14, 15) to generate combinatorial genomic diversity through rearrangements (16). Several synthetic chromosomes are now built (14, 17–22); it is thus possible to experimentally address whether or not Sc2.0 modifications affect the overall chromosome organization in strains carrying synthetic chromosomes.
Genomic chromosome conformation capture approaches [e.g., Hi-C (23, 24)], which provide access to the average 3D chromosome organization from a population of cells, have highlighted the Rabl organization of the S. cerevisiae and other fungal genomes (Fig. 1A) (25, 26). In a Hi-C experiment, ligation frequencies between DNA restriction fragments are quantified through deep sequencing, reflecting contacts within the nuclear space and presumably their average respective positions in populations of cells. These frequencies are usually represented as 2D heat maps (fig. S1) and can be processed and visualized as 3D representations to facilitate their interpretation (Fig. 1A) (27). To investigate Sc2.0 chromosome organization, Hi-C contact maps (bin size, 5 kb) and 3D representations (see the Materials and methods section for interpretation of such structures) of synII, synIII, synV, synVI, synIXR, synX, and synXII were generated from daughter cells synchronized through elutriation (Fig. 1, B to D; figs. S2 to S10; tables S1 to S2; and movies S1 to S10) (28).
Fig. 1. 3D genome organization of native and synthetic chromosomes.
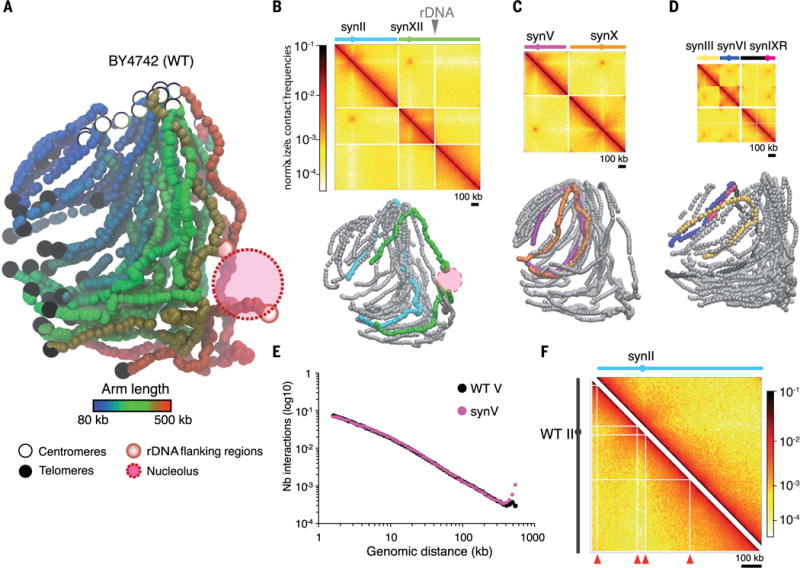
(A) 3D representation of the native (wild-type, WT) yeast chromosomes, inferred from the Hi-C contact map displayed in fig. S1 (27). Each bead represents a 5-kb chromosome segment. Centromeres, telomeres, and rDNA-flanking regions are indicated with white, black, and red beads, respectively. Each chromosomal arm has been colored according to its length. (B to D) Contact maps and corresponding 3D representations of synthetic chromosomes in three different strains: JDY512 (synII and synXII) (B), yXZX573 (synV and synX) (C), and yLM896 (synIII, synVI, and synIXR) (D). The top panels are normalized contact maps of the seven synthetic chromosomes (bin size, 5 kb). Normalized contact frequencies (27) are indicated in a log10 scale ranging from white (few contacts) to dark red (many contacts). Filtered bins are set to zero (white vectors). The solid gray triangle points to the position of the rDNA cluster. The bottom panels show whole-genome 3D representations of the contact maps displayed above, with synthetic and native chromosomes represented with colored and gray beads, respectively. (E) Distribution of the number of contacts as a function of the genomic distance for synV (pink) and native chromosome V (black). (F) Side-by-side comparison of synII (strain YS031) and native chromosome II (strain BY4742) normalized contact maps. Nonmappable, repeated regions are highlighted with red arrowheads on the native map.
Trajectories of synthetic chromosomes in the nuclear space
To determine whether individual or combinations of Sc2.0 chromosomes influence the overall genome organization, the contact map of the subset of invariant (native) chromosomes was generated for each strain. Euclidean distances between these maps were then computed, which revealed that the presence of one or more Sc2.0 chromosomes did not dramatically affect the overall structure of the remaining genome (fig. S11). The 3D representations also allowed for the qualitative comparison of native and synthetic sequences, showing that the average trajectories of individual Sc2.0 chromosomes did not appear to be substantively altered compared with those of their native counterparts, with synthetic chromosomes neighboring the same chromosomes as the native ones (Fig. 1 and figs. S2 to S10 for side-by-side comparisons). To quantitatively compare the internal folding of Sc2.0 chromosomes with that of their native counterparts, we computed the contact frequency decay as a function of the increasing genomic distance for all pairs of loci. No substantial differences between synthetic and native chromatin were detected (Fig. 1E), suggesting that the redesigned sequence has little or no effect on the internal folding of the chromosome beyond a ~5 to 10% shortening through the removal of repeats.
Sc2.0 design improves mappability
A comparison of Sc2.0 maps with those of their native counterparts nevertheless revealed much smoother contact patterns in the designer chromosomes, as shown by the quasi-absence of white lines in synthetic contact maps. This stems from the intentional deletion of repeated elements, which leads to improved “mappability,” relative to the native sequence, along the length of the synthetic chromosome (Fig. 1, E and F, and figs. S2 to S10). For instance, for chromosome II, eight bins (5% of the chromosome) appeared insufficiently covered in the native (wild-type, WT) counterpart, whereas the synthetic counterpart (synII) had no bins that were insufficiently covered (figs. S2 and S12). In addition, the normalized contact frequencies between synVI subtelomeres appeared to be much higher than in the native counterpart (fig. S13). This variation results directly from the improved mappability of subtelomeric regions after the removal of subtelomeric repeats. On the other hand, subtelomeric contacts are underestimated in native chromosomes because of these repetitive sequences. These observations highlight the conceptual advance enabled by bottom-up chromosome design and synthesis to investigate fundamental questions; scientists can now design experimental systems at unprecedented levels of refinement, making complex questions easier to address experimentally. For instance, investigating the elusive regulatory influences of repeated sequences in mammalian genomes could benefit from similar techniques.
SynIII conformation is modified by the design
Specific contacts between the duplicated HML and HMR silent mating-type loci that bridge the two arms of chromosome III have been identified (23, 29). The deletion of these cassettes led to a loss of contacts on synIII (Fig. 2, A and B). Moreover, chromosome III shows a mating-type–specific conformation that depends on the integrity of a recombination enhancer sequence (30). Despite the presence of the recombination enhancer sequence in synIII, the mating-type–specific conformation was lost (fig. S14). We speculate that the deletion of the silent loci in synIII underlies this result, but additional experiments are required to discriminate this possibility from the potential influence of other changes in the sequences. synIII still exhibited enriched contacts between its subtelomeres, a feature characteristic of the small metacentric chromosomes I, III, and VI (12, 31).
Fig. 2. Loss of subtelomeric contacts in synIII.
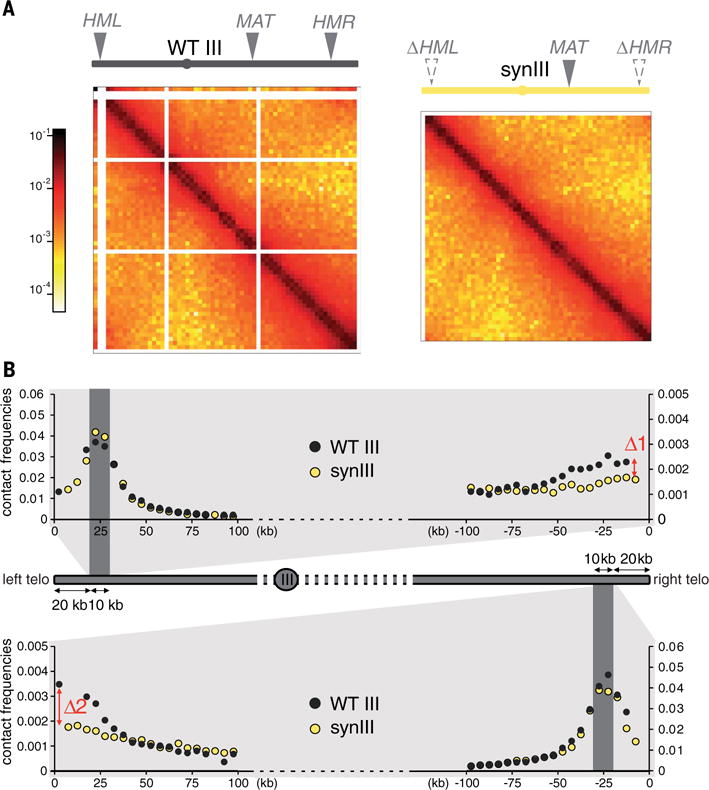
(A) Normalized contact maps (bin size, 5 kb) of native (WT) chromosome III (left; strain BY4742) and synIII (right; strain yLM896). The color scale is as in Fig. 1. Mating-type sequences are indicated along the top x axis with solid gray triangles (MAT, mating-type locus; HML and HMR, left and right silent mating cassettes). The positions of deleted loci are indicated with gray dashed triangles. (B) Quantitative analysis of subtelomeric contacts in native chromosome III (black dots) and synIII (yellow dots) by means of a bait chromosome capture approach. Contacts of 10-kb subtelomeric regions positioned at 20 kb from the left (top) or right (bottom) telomeres (dark gray areas) are shown. The y axis shows normalized contact frequencies; the x axis shows the distance (in kilobases) from the left and right telomeres. Each point represents the mean contact frequency for the bait region, computed for each chromosome from three independent experiments (on strains BY4742, YS031, and JDY512 for native chromosome III and yLM896, yLM539, and JDY452 for synIII). Δ1 and Δ2 mark the normalized contacts discrepancies between both ends of synIII relative to native chromosome III.
Repositioning the rDNA locus affects the global 3D structure of the genome
The rDNA locus on the right arm of chromosome XII consists of a cluster (100 to 200) of ~9-kb rDNA units, each containing two ribosomal precursor genes. This cluster assembles in the nucleolus, a discrete, crescent-shaped nuclear compartment that occupies ~one-third of the total nuclear space and is positioned opposite to the SPB. Two versions of the synXII chromosome were designed, with and without the rDNA cluster. When not located on synXII, the rDNA was positioned either on the multicopy 2μ plasmid (one unit per plasmid) or reintegrated as an array within the right arm of the small chromosome III (22). Chromosome organization was investigated in these strains. Because of their repetitive nature, rDNA unit reads cannot be uniquely mapped, and the rDNA cluster on the 3D reconstruction thus appears as an empty space flanked by the closest regions that can be mapped unambiguously (Figs. 1A and 3, A to C). In strains without the rDNA locus on synXII (JDY446, JDY448, and JDY449), the continuity of the two regions flanking the original insertion site was clearly visible on the contact map and 3D representations of the right arm (Fig. 3, A to C, and figs. S5 and S6). The presence of 2μ plasmids carrying a rDNA unit (strain JDY446) did not result in a large reorganization of the genome (fig. S5), suggesting that the plasmids do not form large discrete heterochromatic structures, in agreement with the studies reporting the formation of multiple small clusters (22, 32). On the other hand, the insertion of the rDNA array in the middle of the right arm of chromosome III (strains JDY448 and JDY449) resulted in substantial reorganization of the genome (Fig. 3C and fig. S6). The right arm of chromosome III appeared to be split into two noninteracting regions by the rDNA cluster, an arrangement similar to the native chromosome XII structure (25). Relocating the rDNA to a short chromosomal arm imposed new constraints on the genome: The nucleolus became trapped between short and long chromosome arms, forming a physical barrier between them, as shown by reduced contacts between these arms (Fig. 3C). In addition, contacts between the rDNA and subtelomeric regions were increased overall (Fig. 3D) as a result of the greater proximity of the nucleolus to the entire set of chromosomal extremities. Also, the IIIR subtelomere in this strain contacted long arm subtelomeres (blue arrow on Fig. 3C). No growth rate defects were detected in these strains, suggesting that the position of the rDNA locus has little effect on fitness in the laboratory growth conditions tested in our study. However, given the observed constraints, it would be informative to run long-term cultures to see whether the rDNA locus spontaneously relocalizes, and if so, where.
Fig. 3. Repositioning of rDNA affects the overall genomic organization.
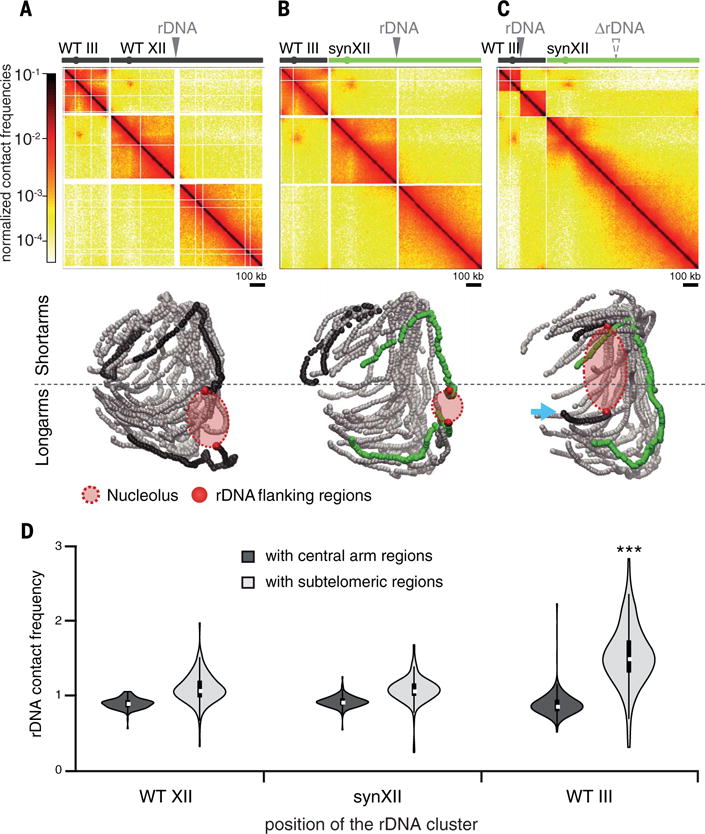
(A to C) The top panels are normalized contact maps of strains BY4742 (A), JDY465 (B), and JDY449 (C) carrying the rDNA cluster at different positions. Solid gray triangles point to the position of the rDNA cluster in each strain. The position of the deleted rDNA cluster is indicated with a gray dashed triangle. The bottom panels show the 3D representations of the corresponding contact maps. The nucleolus and the rDNA cluster–flanking regions are represented on each structure. Chromosome coloring is the same as in Fig. 1. The blue arrow points to the chromosome III right arm that is displaced after rDNA insertion. (D) Violin plot of the contact frequencies between the rDNA cluster and either subtelomeric (light gray) or intra-arm (dark gray) chromosomal regions. ***P < 0.001.
Hi-C analysis of SCRaMbLE chromosomes
All synthetic chromosomes carry the SCRaMbLE system, a chromosome-wide expansion of the Cre/lox site-specific recombination assay used to measure local DNA concentrations in genomes (5, 33). The Sc2.0 design includes the integration of hundreds of loxPsym sites all along chromosomes, at the end of every nonessential gene and at specific landmarks. Upon activation of the Cre recombinase, two loxPsym will recombine if they encounter each other in the nuclear space, leading to a structural variant. The hundreds of sites therefore hold a large combinatory potential, leading to rapid and complex structural changes of synthetic chromosomes. Previous analysis of synIXR SCRaMbLE strains has revealed a large variety of cis events, ranging from simple duplications, inversions, and deletions to highly reorganized structures (14, 16). We took the opportunity offered by strains carrying two Sc2.0 chromosomes to further explore the power of the SCRaMbLE recombination assay in trans (14, 15). The Cre recombinase was induced for 48 hours in strain yLM539 carrying synIII and synIXR (Fig. 4A and fig. S15). Independent clones were sampled during the time course experiment, and two clones, HMSY029 (time T2 = 2 hours) and HMSY030 (T8 = 8 hours), were retained for in-depth analysis. Genome-wide Hi-C contact data have recently been shown to provide a convenient way to identify and solve chromosomal rearrangements (fig. S16) (34–37). We therefore applied Hi-C to investigate the consequences of genome structural alterations in these two isolates. The contact maps identify gross chromosomal rearrangements in both SCRaMbLE strains, with each strain exhibiting deletion and translocation events, the latter representing a class of trans SCRaMbLE events not previously observed (Fig. 4B). The resolution of the contact map (~2 to 5 kb) allowed identification of relatively large-scale rearrangements, but loxPsym sites are often more closely spaced. To address this, a refined analysis of the reads coverage was performed (table S3 and fig. S17), unveiling multiple short-scale modifications of loxPsym-flanked segments (summarized in Fig. 4C, details in fig. S18). These results highlight the potential of the SCRaMbLE design to generate gross chromosomal rearrangements, with more rearrangements being achieved after longer induction times. Incidentally, Hi-C analysis of Sc2.0 strains identified several chromosomal rearrangements that spontaneously arose during chromosome assemblies, such as aneuploidy, duplication, or translocation events outside of the synthetic chromosome of interest (table S1 and fig. S19) (17). Hi-C is therefore a convenient way to validate the assembly and subsequent processing of strains carrying synthetic chromosomes.
Fig. 4. SCRaMbLE induction of synthetic chromosomes results in multiple types of genome rearrangements.
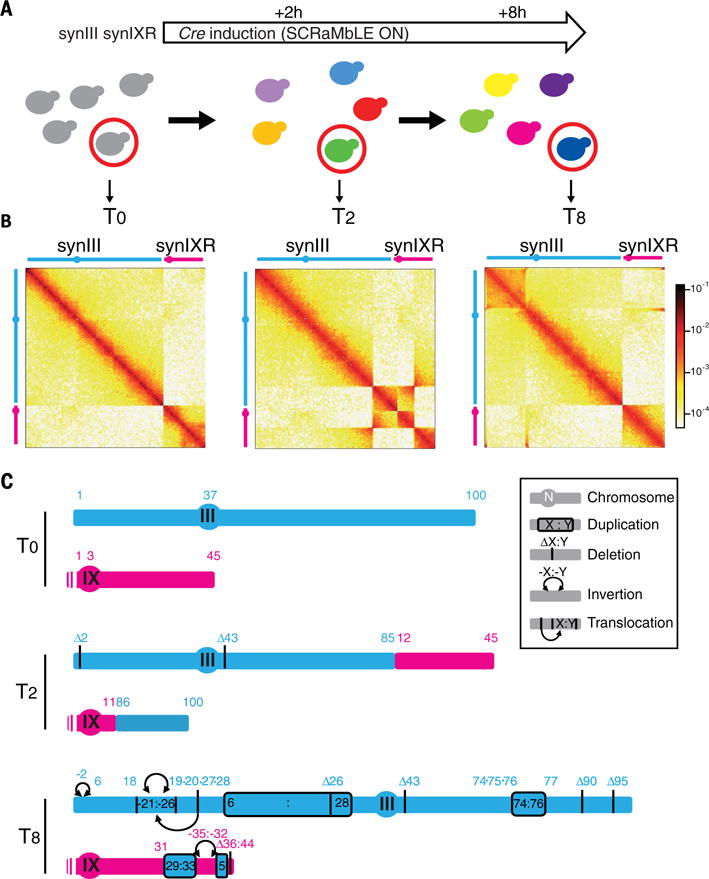
(A) Illustration of the time course induction of the SCRaMbLE system in strain yLM539 carrying two synthetic chromosomes, synIII and synIXR. (B) Normalized contact maps (bin size, 2 kb) of the parental strain yLM539 (at T0; carrying synIII and synIXR) and two SCRaMbLE clones isolated after 2 hours (T2; HMSY029) and 8 hours (T8; HMSY030) of Cre induction. All Hi-C reads are mapped against the reference genome of the parental strain yLM539. (C) Schematic representations of the duplications, deletions, inversions, and translocations identified from these maps and the coverage analysis. DNA segments between two loxPsym sites are numbered from left to right (in blue for synIII and pink for synIX). The schematic representation shows the rearranged synIII and synIX by using numbering of the segments from the parental strain. Details are shown in fig. S18.
Outlook
This large data set is a resource that will be exploited in future studies exploring the power of the SCRaMbLE system. By showing that the spatial organization of the Sc2.0 genome is not substantively altered, this work paves the way for future studies addressing the influence of genome-wide engineering approaches on essential features of living systems.
Materials and methods
Media
Yeast were grown either in YPD [1% (w/v) Bacto peptone (Difco), 1% (w/v) Bacto yeast extract (Difco), 2% (w/v) glucose, and 2% (w/v) Bactoagar] or in selective SC media [0.67% Yeast Nitrogen Base without amino acids (Difco), supplemented with an amino acid mix minus those whose prototrophy is selected for, 2% (w/v) glucose and 2% (w/v) Bactoagar].
Strains
All strains used in the study are described in table S1.
Culture conditions
Cells were inoculated and grown overnight in 10 ml YPD. Overnight cultures were then diluted and grown to exponential phase in 500 ml YPD for ~15 hours at 30°C. For SCRaMbLE and mating-type specific organization experiments, Hi-C libraries were generated from asynchronous cultures (see table S2). For all other Sc2.0 strains, Hi-C libraries were generated from daughter cells recovered using elutriation and restarted for 30 min in YPD at 30°C (38).
Generation of Hi-C libraries
Hi-C libraries were generated with a protocol adapted from (23) with introduction of a biotin-ligation step (24). Briefly, aliquots of 1–3 × 10⁹ cells were cross-linked for 30 min with fresh formaldehyde (3% final concentration) and quenched with glycine for 15 min. Pelleted cells were dissolved in 10 ml sorbitol 1 M and incubated for 30 min with DTT 5 mM and Zymolyase 100T (CFinal = 1 mg/ml). Spheroplasts were washed with 5 ml sorbitol 1M, then with 5 ml 1X restriction buffer (NEB), and suspended in 3.5 ml 1X restriction buffer. Cells were split into aliquots (V = 500 μl) and incubated in SDS (3%) for 20 min at 65°C. Cross-linked DNA was digested at 37°C overnight with 150 units of DpnII restriction enzyme (NEB). The digestion mix was subsequently centrifuged 20 min at 18,000 g and the supernatant discarded. Pellets were suspended in cold water. DNA ends were repaired in the presence of 14-dCTP biotin (Invitrogen), and cross-linked complexes incubated for 4 hours at 16°C in presence of 250 U of T4 DNA ligase (Thermo Scientific, 12.5 ml final volume). DNA purification was achieved through an overnight incubation at 65°C with 250 μg/ml proteinase K in 6.2 mM EDTA followed by a precipitation step and RNAse treatment.
The resulting Hi-C libraries were sheared and processed into Illumina libraries according to manufacturer instructions (Paired-End DNA sample Prep Kit – Illumina – PE-930-1001) using custom-made versions of the Illumina PE adapters (28). Fragments between 400 and 800 bp were purified, amplified, and paired-end (PE) sequenced on an Illumina platform (HiSeq2000 or NextSeq500; table S2).
Raw sequences are accessible in the SRA database under accession number SRP070421.
Generation and normalization of contact maps
Sequencing pair-end data was processed as follows. For each library, PCR duplicates were collapsed using the 6 Ns present on each of the custom-made adapters and trimmed. Reads were then aligned using Bowtie 2 in its most sensitive mode against the S. cerevisiae reference genome adapted with the synthetics sequences (39). An iterative alignment procedure was used: for each read the length of the mapped sequence increases gradually from 20 bp until mapping becomes unambiguous (mapping quality > 30). Read pairs were aligned independently and assigned to a restriction fragment (RF). Religation and other unwanted events were filtered out, taking into account the orientation of the reads, as described (28, 40). Contact matrices were built for each strain by binning the aligned reads into units of single RF. Adjacent restriction fragments were then pooled into fixed size bins of either 2 or 5 kb. Bins exhibiting important contact frequencies variations (< or > two standard deviation) were filtered, with the corresponding vectors either set to zero (white band on contact maps) or removed (see fig. S12). Binned contact maps were then normalized using the sequential component normalization (SCN) described in (40).
3D representation of contact maps
The 3D representations of the contact maps were generated using ShRec3D (27) on the normalized contact maps filtered for low signal bins. These 3D structures are average representations from populations of billions of cells, and therefore do not represent the exact structure found in an individual cell. It must also be underlined that they are not polymer models and cannot be interpreted as such. They have to be interpreted as representations of DNA contact frequencies over a population of cells. For instance, telomeres loosely cluster together on these 3D representations. In a single nucleus, telomeres would rather form smaller groups scattered all around the nuclear membrane. Since in different cells these group gather different partners, they are regrouped together in the average structure that reflects the population average of contacts. All 3D structures presented here were rendered using VMD (41).
Similarity between contact maps
To assess the differences of the different data sets, we proceeded as follows. First, normalized contact maps of native chromosomes I, IV, VII, VIII, XIII, XIV, XV, and XVI were binned at 50 kb and quantile normalized. We then computed the Euclidean distance between all pairs of maps and performed a principal component analysis on the resulting distance matrix.
Genomic distance plot
Pairs of reads mapping in cis (i.e., intrachromosomal) positions along the genome were partitioned by chromosome. Reads oriented towards different directions or separated by less than 1.5 kb were discarded. For each chromosome, read pairs were log-binned according to the genomic distance s separating them (in kb)
The genomic distance plot is the weighted histogram computed from the sum of read pairs for each bin, weighted with the expected number of pairs under the uniform null hypothesis. To compare synthetic and native chromosome both distributions were normalized by their mean computed over the 70% of the curve at lower distances.
SCRaMbLE assay
Strain yLM539 (synIII, synIXR) was transformed with the plasmid pSCw11 CRE-EBD_HIS3 and grown in SC-HIS media (14). Cre expression was induced with 1 μM estradiol. Samples of induced and non-induced cultures were analyzed over 48 hours (0, 1, 2, 4, 5, 6, 8, 24, and 48 hours). For each time point, serial dilutions were spotted on YPD and SC-HIS agar plates (fig. S15). Two clones, HMSY029 (T2 = 2 hours) and HMSY030 (T8 = 8 hours), were retained for sequencing and Hi-C analysis.
Genomic analysis of SCRaMbLE strains
Illumina paired-end short-reads were trimmed to remove adapter sequences. Reads shorter than 100 bp, and/or with unknown bases, and/or exhibiting 1 or more bases with a Phred-score under 7, were filtered and discarded from the analysis. Remaining reads were then mapped to the reference sequence using Bowtie2. The read coverage over the entire genome was computed, with a specific focus on the synthetic regions. The copy number of each segment in between loxPsym sites was assessed to detect deletions, duplications, and higher amplifications. To account for possible systematic experimental biases in the sequencing depth resulting from library preparation and mapping, we used an iterative algorithm to refine the copy number estimation (16).
We then focused on the unmapped reads carrying a loxPsym site to characterize SCRaMbLE rearrangements. The two segments flanking a loxPsym site define a junction. We trisected unmapped reads into a loxPsym site and its two flanking extremities, then mapped each of the latter to the reference genome using EMBOSS water (42) to identify novel junction. The average sequencing depths of novel junctions for the 2-hour and 8-hour Cre-induced strains were 16.3 and 14.3, respectively. We combined novel junctions with a depth higher than 5 and the copy number of segments to characterize the SCRaMbLE induced rearrangements (table S3).
That no off-target rearrangement occurred elsewhere in the genome was confirmed by analyzing unmapped reads without loxPsym site with EMBOSS water to detect potential recombination events.
Analysis of rDNA contacts
Genome-wide rDNA contact frequencies were investigated in Sc2.0 strains carrying the rDNA either at its natural position on chromosome XII (data sets from strains YS031, yXZX538, yLM539, yLM896, HMSY012, yXZX573), on chromosome synXII (data sets from strains JDY465, JDY512, JDY452), on chromosome III (data sets from strains JDY448, JDY449), or on the 2μ plasmid (data set from strain JDY446). For each data set, pair-end reads were aligned on the reference genome of the corresponding strain lacking rDNA sequences and on an extra contig corresponding to a single rDNA unit (~9 kb). Contact maps of trans interactions were generated (bin size, 5 kb) and normalized (40). To compare the contacts between the rDNA contig with the rest of the genome in different data sets, the values in the corresponding vector were divided by their median to alleviate differences of coverage and/or number of rDNA units. Chromosomes III and XII, which carry the rDNA cluster in three out of four data sets, were removed from the analysis to allow comparison of the rest of the genome. For each data set, the contacts made by the rDNA sequence with either the 28 subtelomeric regions (30 kb at the extremities of the 14 chromosomes investigated) or a 30-kb region positioned 30 kb from the centromere on each arm (central region) were plotted using violin plot function from the “vioplot” R library.
Distribution of read coverage for synthetic and native chromosomes
The removal of repeated genetic elements in synthetic chromosomes relative to native counterparts leads to smother contact maps. Indeed, Hi-C reads cannot be aligned against repeats without ambiguities, resulting in vectors with a low if not null number of contacts. Those vectors appear as empty rows and columns in the contact maps and are a source of noise and spurious contacts in the matrices after normalization. For this reason, these regions are filtered according to a threshold (see the section on Generation and normalization of contact maps). To quantify the improvement in the visibility of synthetic chromosomes all along their length, we compared the histogram of their coverage between the synthetic and the native data set (fig. S12). The histograms count the number of contacts made by each vector within the region of interest with the entire genome (histogram bin size, 500 reads). The filtering threshold (median – 2SD) was computed over the entire genome (reported on the fig. S12 histograms as dotted lines).
Supplementary Material
Acknowledgments
We thank A. Cournac, M. Marbouty, and L. Lazar-Stefanita for fruitful discussions and advice. This research was supported by funding to R.K. from the European Research Council (ERC) under the 7th Framework Program (FP7/2007-2013, ERC grant agreement 260822), Agence Nationale pour la Recherche (ANR) (MeioRec ANR-13-BSV6-0012-02), and ERASynBio and ANR (IESY ANR-14-SYNB-0001-03). H.M. and V.F.S are partly supported by Pasteur-Roux Fellowships. J.D. was funded by the National Science Foundation of China (31471254), Tsinghua University Initiative Scientific Research Program (2011Z02296), Ph.D. Programs Foundation of Ministry of Education of China (20110002120055), and the Chinese Ministry of Science and Technology (2012CB725201). Y.-J.Y. was supported by the Natural Science Foundation of China (21621004 and 21390203). Y.C. was funded by a Chancellor’s Fellowship from the University of Edinburgh, a startup fund from the Scottish Universities Life Sciences Alliance, and grants from the U.K. Biotechnology and Biological Sciences Research Council (BB/M005690/1, BB/M025640/1, and BB/M00029X/1). Y.S. was supported by a research grant from the Shenzhen Engineering Laboratory for Clinical Molecular Diagnostic Promotion [JZF no. (2016)884]. This work was supported in part by funding from the U.S. National Science Foundation (grants MCB-0718846 and MCB-1026068 to J.D.B. and J.S.B. and MCB-0546446 and MCB-1445545 to J.S.B.). J.D.B. and J.S.B. are founders and directors of Neochromosome. J.D.B. serves as a scientific advisor to Recombinetics and Sample6. FASTQ files of the reads have been deposited in the Sequence Read Archive database under accession number SRP070421.
Footnotes
These arrangements are reviewed and managed by the committees on conflict of interest at the New York University Langone Medical Center (J.D.B.) and Johns Hopkins University (J.S.B.).
REFERENCES AND NOTES
- 1.Sharp PM, Lloyd AT. Regional base composition variation along yeast chromosome III: Evolution of chromosome primary structure. Nucleic Acids Res. 1993;21:179–183. doi: 10.1093/nar/21.2.179. [DOI] [PMC free article] [PubMed] [Google Scholar]
- 2.Bradnam KR, Seoighe C, Sharp PM, Wolfe KH. G+C content variation along and among Saccharomyces cerevisiae chromosomes. Mol Biol Evol. 1999;16:666–675. doi: 10.1093/oxfordjournals.molbev.a026149. [DOI] [PubMed] [Google Scholar]
- 3.Cohen BA, Mitra RD, Hughes JD, Church GM. A computational analysis of whole-genome expression data reveals chromosomal domains of gene expression. Nat Genet. 2000;26:183–186. doi: 10.1038/79896. [DOI] [PubMed] [Google Scholar]
- 4.Louis EJ, Vershinin AV. Chromosome ends: Different sequences may provide conserved functions. BioEssays. 2005;27:685–697. doi: 10.1002/bies.20259. [DOI] [PubMed] [Google Scholar]
- 5.Burgess SM, Kleckner N. Collisions between yeast chromosomal loci in vivo are governed by three layers of organization. Genes Dev. 1999;13:1871–1883. doi: 10.1101/gad.13.14.1871. [DOI] [PMC free article] [PubMed] [Google Scholar]
- 6.Guacci V, Hogan E, Koshland D. Centromere position in budding yeast: Evidence for anaphase A. Mol Biol Cell. 1997;8:957–972. doi: 10.1091/mbc.8.6.957. [DOI] [PMC free article] [PubMed] [Google Scholar]
- 7.Therizols P, Duong T, Dujon B, Zimmer C, Fabre E. Chromosome arm length and nuclear constraints determine the dynamic relationship of yeast subtelomeres. Proc Natl Acad Sci USA. 2010;107:2025–2030. doi: 10.1073/pnas.0914187107. [DOI] [PMC free article] [PubMed] [Google Scholar]
- 8.Taddei A, Gasser SM. Structure and function in the budding yeast nucleus. Genetics. 2012;192:107–129. doi: 10.1534/genetics.112.140608. [DOI] [PMC free article] [PubMed] [Google Scholar]
- 9.Rabl C. On cell division. Morphol Jahrb. 1985;10:214–330. [Google Scholar]
- 10.Thompson M, Haeusler RA, Good PD, Engelke DR. Nucleolar clustering of dispersed tRNA genes. Science. 2003;302:1399–1401. doi: 10.1126/science.1089814. [DOI] [PMC free article] [PubMed] [Google Scholar]
- 11.Haeusler RA, Engelke DR. Genome organization in three dimensions: Thinking outside the line. Cell Cycle. 2004;3:273–275. doi: 10.4161/cc.3.3.732. [DOI] [PMC free article] [PubMed] [Google Scholar]
- 12.Schober H, et al. Controlled exchange of chromosomal arms reveals principles driving telomere interactions in yeast. Genome Res. 2008;18:261–271. doi: 10.1101/gr.6687808. [DOI] [PMC free article] [PubMed] [Google Scholar]
- 13.Richardson SM, et al. Design of a synthetic yeast genome. Science. 2017;355:1040–1044. doi: 10.1126/science.aaf4557. [DOI] [PubMed] [Google Scholar]
- 14.Dymond JS, et al. Synthetic chromosome arms function in yeast and generate phenotypic diversity by design. Nature. 2011;477:471–476. doi: 10.1038/nature10403. [DOI] [PMC free article] [PubMed] [Google Scholar]
- 15.Dymond J, Boeke J. The Saccharomyces cerevisiae SCRaMbLE system and genome minimization. Bioeng Bugs. 2012;3:168–171. doi: 10.4161/bbug.19543. [DOI] [PMC free article] [PubMed] [Google Scholar]
- 16.Shen Y, et al. SCRaMbLE generates designed combinatorial stochastic diversity in synthetic chromosomes. Genome Res. 2016;26:36–49. doi: 10.1101/gr.193433.115. [DOI] [PMC free article] [PubMed] [Google Scholar]
- 17.Shen Y, et al. Deep functional analysis of synII, a 770-kilobase synthetic yeast chromosome. Science. 2017;355:eaaf4791. doi: 10.1126/science.aaf4791. [DOI] [PMC free article] [PubMed] [Google Scholar]
- 18.Annaluru N, et al. Total synthesis of a functional designer eukaryotic chromosome. Science. 2014;344:55–58. doi: 10.1126/science.1249252. [DOI] [PMC free article] [PubMed] [Google Scholar]
- 19.Xie ZX, et al. “Perfect” designer chromosome V and behavior of a ring derivative. Science. 2017;355:eaaf4704. doi: 10.1126/science.aaf4704. [DOI] [PubMed] [Google Scholar]
- 20.Mitchell LA, et al. Synthesis, debugging, and effects of synthetic chromosome consolidation: synVI and beyond. Science. 2017;355:eaaf4831. doi: 10.1126/science.aaf4831. [DOI] [PubMed] [Google Scholar]
- 21.Wu Y, et al. Bug mapping and fitness testing of chemically synthesized chromosome X. Science. 2017;355:eaaf4706. doi: 10.1126/science.aaf4706. [DOI] [PMC free article] [PubMed] [Google Scholar]
- 22.Zhang W, et al. Engineering the ribosomal DNA in a megabase synthetic chromosome. Science. 2017;355:eaaf3981. doi: 10.1126/science.aaf3981. [DOI] [PubMed] [Google Scholar]
- 23.Dekker J, Rippe K, Dekker M, Kleckner N. Capturing chromosome conformation. Science. 2002;295:1306–1311. doi: 10.1126/science.1067799. [DOI] [PubMed] [Google Scholar]
- 24.Lieberman-Aiden E, et al. Comprehensive mapping of long-range interactions reveals folding principles of the human genome. Science. 2009;326:289–293. doi: 10.1126/science.1181369. [DOI] [PMC free article] [PubMed] [Google Scholar]
- 25.Duan Z, et al. A three-dimensional model of the yeast genome. Nature. 2010;465:363–367. doi: 10.1038/nature08973. [DOI] [PMC free article] [PubMed] [Google Scholar]
- 26.Marie-Nelly H, et al. Filling annotation gaps in yeast genomes using genome-wide contact maps. Bioinformatics. 2014;30:2105–2113. doi: 10.1093/bioinformatics/btu162. [DOI] [PubMed] [Google Scholar]
- 27.Lesne A, Riposo J, Roger P, Cournac A, Mozziconacci J. 3D genome reconstruction from chromosomal contacts. Nat Methods. 2014;11:1141–1143. doi: 10.1038/nmeth.3104. [DOI] [PubMed] [Google Scholar]
- 28.Cournac A, Marbouty M, Mozziconacci J, Koszul R. Generation and analysis of chromosomal contact maps of yeast species. Methods Mol Biol. 2016;1361:227–245. doi: 10.1007/978-1-4939-3079-1_13. [DOI] [PubMed] [Google Scholar]
- 29.Miele A, Bystricky K, Dekker J. Yeast silent mating type loci form heterochromatic clusters through silencer protein-dependent long-range interactions. PLOS Genet. 2009;5:e1000478. doi: 10.1371/journal.pgen.1000478. [DOI] [PMC free article] [PubMed] [Google Scholar]
- 30.Belton JM, et al. The conformation of yeast chromosome III is mating type dependent and controlled by the recombination enhancer. Cell Rep. 2015;13:1855–1867. doi: 10.1016/j.celrep.2015.10.063. [DOI] [PMC free article] [PubMed] [Google Scholar]
- 31.Bystricky K, Laroche T, van Houwe G, Blaszczyk M, Gasser SM. Chromosome looping in yeast. J Cell Biol. 2005;168:375–387. doi: 10.1083/jcb.200409091. [DOI] [PMC free article] [PubMed] [Google Scholar]
- 32.Oakes M, et al. Mutational analysis of the structure and localization of the nucleolus in the yeast Saccharomyces cerevisiae. J Cell Biol. 1998;143:23–34. doi: 10.1083/jcb.143.1.23. [DOI] [PMC free article] [PubMed] [Google Scholar]
- 33.Hildebrandt ER, Cozzarelli NR. Comparison of recombination in vitro and in E. coli cells: Measure of the effective concentration of DNA in vivo. Cell. 1995;81:331–340. doi: 10.1016/0092-86749590386-0. [DOI] [PubMed] [Google Scholar]
- 34.Marie-Nelly H, et al. High-quality genome (re)assembly using chromosomal contact data. Nat Commun. 2014;5:5695. doi: 10.1038/ncomms6695. [DOI] [PMC free article] [PubMed] [Google Scholar]
- 35.Kaplan N, Dekker J. High-throughput genome scaffolding from in vivo DNA interaction frequency. Nat Biotechnol. 2013;31:1143–1147. doi: 10.1038/nbt.2768. [DOI] [PMC free article] [PubMed] [Google Scholar]
- 36.Flot JF, Marie-Nelly H, Koszul R. Contact genomics: Scaffolding and phasing (meta)genomes using chromosome 3D physical signatures. FEBS Lett. 2015;589:2966–2974. doi: 10.1016/j.febslet.2015.04.034. [DOI] [PubMed] [Google Scholar]
- 37.Burton JN, et al. Chromosome-scale scaffolding of de novo genome assemblies based on chromatin interactions. Nat Biotechnol. 2013;31:1119–1125. doi: 10.1038/nbt.2727. [DOI] [PMC free article] [PubMed] [Google Scholar]
- 38.Guidi M, et al. Spatial reorganization of telomeres in long-lived quiescent cells. Genome Biol. 2015;16:206. doi: 10.1186/s13059-015-0766-2. [DOI] [PMC free article] [PubMed] [Google Scholar]
- 39.Langmead B, Salzberg SL. Fast gapped-read alignment with Bowtie 2. Nat Methods. 2012;9:357–359. doi: 10.1038/nmeth.1923. [DOI] [PMC free article] [PubMed] [Google Scholar]
- 40.Cournac A, Marie-Nelly H, Marbouty M, Koszul R, Mozziconacci J. Normalization of a chromosomal contact map. BMC Genomics. 2012;13:436. doi: 10.1186/1471-2164-13-436. [DOI] [PMC free article] [PubMed] [Google Scholar]
- 41.Humphrey W, Dalke A, Schulten K. VMD: Visual molecular dynamics. J Mol Graph. 1996;14:33–38. doi: 10.1016/0263-78559600018-5. [DOI] [PubMed] [Google Scholar]
- 42.Rice P, Longden I, Bleasby A. EMBOSS: The European Molecular Biology Open Software Suite. Trends Genet. 2000;16:276–277. doi: 10.1016/S0168-95250002024-2. [DOI] [PubMed] [Google Scholar]
Associated Data
This section collects any data citations, data availability statements, or supplementary materials included in this article.