
Fig. 2. Sensitivity of estimates to the prior distribution.
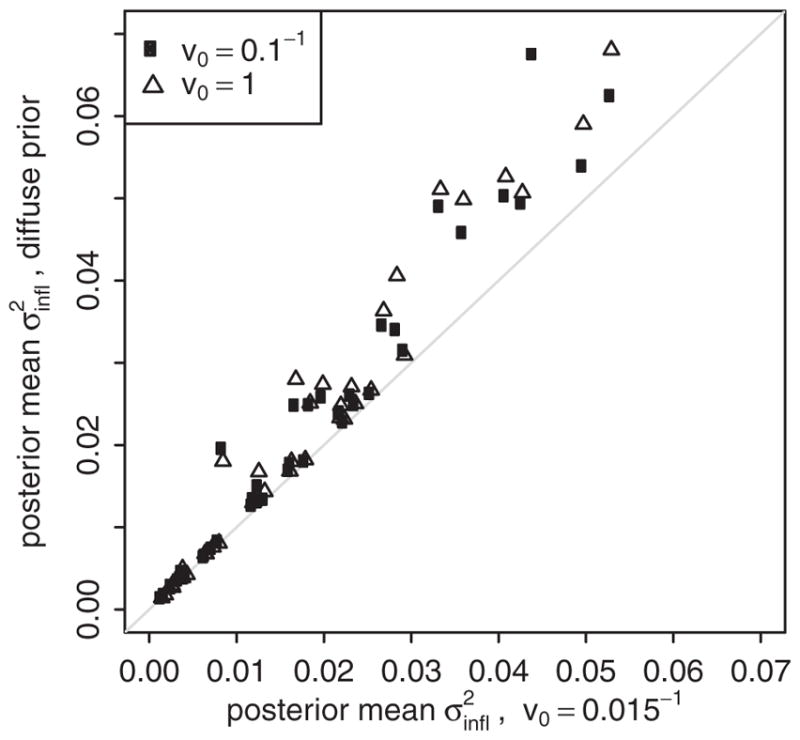
Scatter plot illustrates the posterior mean estimate for using the informative prior with rate v0=0.015−1 compared to the posterior mean with more diffuse priors (v0=0.1−1: circles; v0=1: triangles). Points represent estimates from the same dataset. Results are presented for the r-spline model.