

SUMMARY
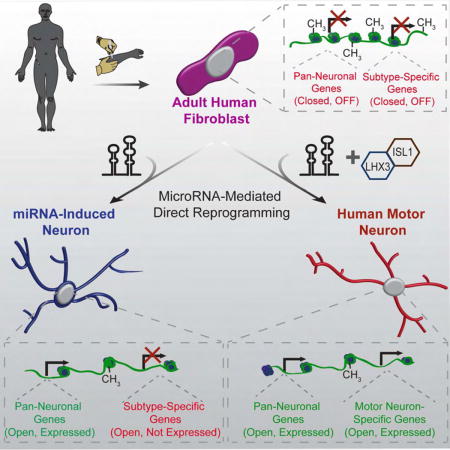
Directed reprogramming of human fibroblasts into fully-differentiated neurons requires massive changes in epigenetic and transcriptional states. Induction of a chromatin environment permissive to acquiring neuronal subtype identity is therefore a major barrier to fate conversion. Here we show that the brain-enriched miRNAs miR-9/9* and miR-124 (miR-9/9*-124) trigger reconfiguration of chromatin accessibility, DNA methylation, and mRNA expression to induce a default neuronal state. MiR-9/9*-124-induced neurons (miNs) are functionally excitable and are uncommitted towards specific subtypes yet possess open chromatin at neuronal subtype-specific loci, suggesting such identity can be imparted by additional lineage-specific transcription factors. Consistently, we show ISL1 and LHX3 selectively drive conversion to a highly homogenous population of human spinal cord motor neurons. Taken together, this study shows modular synergism between miRNAs and neuronal subtype-specific transcription factors can drive lineage-specific neuronal reprogramming, thereby providing a general platform for high-efficiency generation of distinct subtypes of human neurons.
Graphical abstract
INTRODUCTION
Understanding genetic pathways that specify neuronal cell fates during development has enabled directed differentiation of pluripotent stem cells to specific neuronal subtypes (Perrier et al., 2004; Wichterle et al., 2002). This knowledge has been further leveraged to directly convert (or reprogram) non-neuronal somatic cells into neurons via ectopic expression of pro-neural transcription factors (TFs) or neurogenic miRNAs with TFs (Mertens et al., 2016). These direct conversion modalities may prove invaluable in the study of late-onset neurodegenerative diseases, as the original age of human fibroblasts is maintained in converted neurons (Huh et al., 2016; Mertens et al., 2015) in contrast to the cellular rejuvenation observed in induced pluripotent stem cells (Horvath, 2013; Miller et al., 2013). Interestingly, the miRNA-mediated reprogramming approach boasts high conversion efficiency in adult human fibroblasts, which may provide unique opportunities in modeling neurological disorders using patient derived neurons (Victor et al., 2014). However, despite the advantages of direct reprogramming, little is known about the epigenetic and molecular events that accompany direct cell-fate conversion.
MiRNAs regulate genetic pathways by binding to their target transcripts and repressing their expression (Pasquinelli, 2012). Target specificity is governed largely through short sequence complementarity within the 5′ end of a miRNA enabling a single miRNA to target hundreds of mRNA transcripts (Boudreau et al., 2014; Chi et al., 2009). Moreover, a single mRNA can be targeted by multiple miRNAs, markedly enlarging the effect on single gene repression (Wu et al., 2010). The convergence of genetic controls by miRNAs towards a specific biological process is exemplified by miR-9/9* and miR-124 miRNAs activated at the onset of neurogenesis (Conaco et al., 2006; Makeyev et al., 2007). For example, miR-9* and miR-124 synergistically initiate subunit switching within BAF chromatin remodeling complexes (Staahl et al., 2013; Yoo et al., 2009) while separately repressing the neuronal cell-fate inhibitors REST, Co-REST and SCP1 (Packer et al., 2008; Visvanathan et al., 2007). These examples suggest that miR-9/9* and miR-124 target components of genetic pathways that antagonize neurogenesis to promote a neuronal identity during development.
Co-expressing miR-9/9* and miR-124 (miR-9/9*-124), with TFs enriched in the cortex and striatum directly converts primary adult human fibroblasts to cortical and striatal medium spiny neurons, respectively (Yoo et al., 2011; Victor et al., 2014). However, the same TFs without miR-9/9*-124 fail to trigger neuronal conversion (Victor et al., 2014; Yoo et al., 2011), suggesting that the miRNA-induced neuronal state is permissive to terminal selector TFs which, upon determination of a neuronal fate, initiate and advance mature subtype-identities (Stefanakis et al., 2015).
Here, we systematically investigated a miRNA-induced neuronal state in adult human cells. Longitudinal analyses of the transcriptome, genome-wide DNA-methylation and chromatin accessibilities revealed that miR-9/9*-124 induced extensive remodeling of the epigenome, including simultaneous activation of a pan-neuronal program and the reconfiguration of chromatin accessibilities. These changes precede the emergence of differentially methylated genomic regions. Because miR-9/9*-124 also led to the opening of genomic loci for multiple subtype-specific genes including established motor neuron markers, we postulated that motor neuron-enriched transcription factors would cooperate with miR-9/9*-124 to specify a motor neuron lineage. As such, we demonstrate that co-expressing TFs ISL1 and LHX3 along with miR-9/9*-124 generated a highly pure population of human spinal cord motor neurons. Taken together, these results demonstrate that miR-9/9*-124 opens the neurogenic potential of adult human fibroblasts and provides a platform for subtype-specific neuronal conversion of human cells.
RESULTS
Neuronal Conversion of Human Adult Fibroblasts With miR-9/9*-124 Alone
To dissect how miRNAs alone contribute to neuronal conversion, we first tested the ability of miR-9/9*-124 to convert primary human fibroblasts collected from multiple adult individuals from ages 22 to 68 into microRNAs-induced neurons (miNs). We transduced fibroblasts with lentivirus containing a doxycycline (Dox)-inducible promoter driving miR-9/9*-124 and BCL-XL expression (Victor et al., 2014) (Figures 1A and S1A). At 35 days post-transduction, we evaluated cell morphology and the expression of neuronal markers MAP2, TUBB3 and NEUN by immunocytochemistry (Figure 1B). Strikingly, miR-9/9*-124 alone converted 80% of the fibroblasts to neuronal cells displaying complex neurite outgrowth and neuronal marker expression (Figures 1B and 1C). The converted cells stained positive for voltage-gated sodium channels SCN1A and Ankyrin G, which localized at axonal initial segments with a characteristic polarized staining pattern (Figure 1D). The synaptic vesicle marker SV2 displayed defined puncta along neurites, consistent with the adoption of a neuronal fate (Figure 1D).
Figure 1. Direct Conversion of Young and Old Primary Adult Human Fibroblasts into Neurons via miRNA Overexpression.
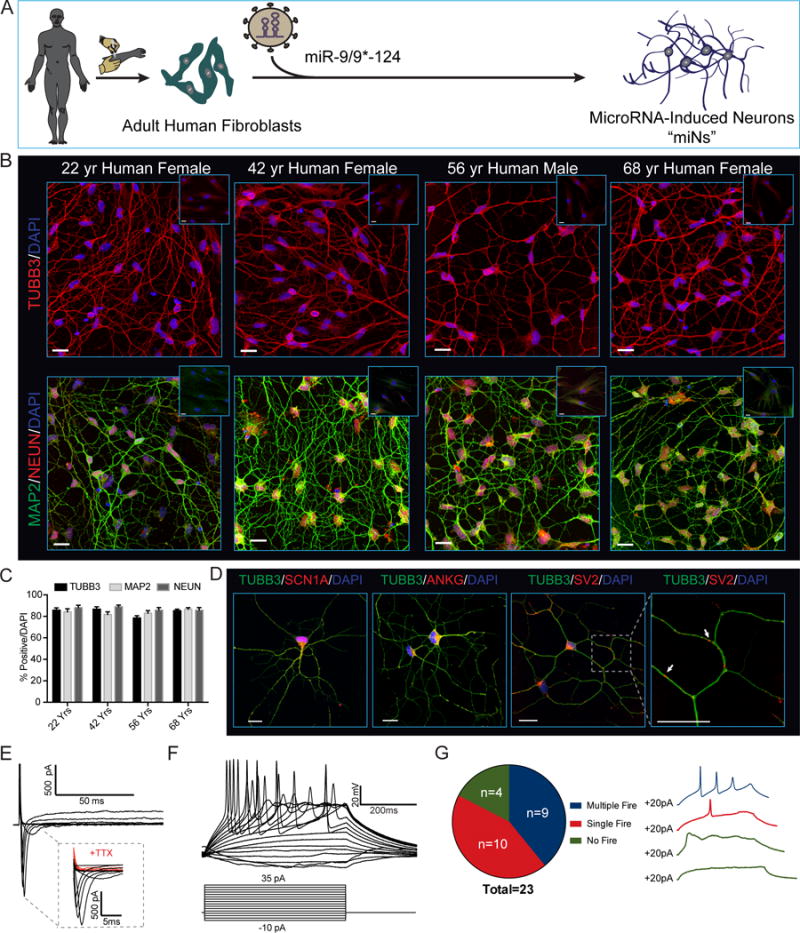
(A) Experimental scheme for miR-9/9*-124 mediated direct neuronal conversion.
(B) Adult human fibroblasts ectopically expressing miR-9/9*-124 for 35 days immunostained for the pan-neuronal markers TUBB3, MAP2 and NEUN. Insets represent starting fibroblasts co-stained as negative controls. Scale bars = 20μm.
(C) Quantification of TUBB3, MAP2 and NEUN positive cells over total number of cells (DAPI). For TUBB3 and MAP2, only cells with processes at least three times the length of the soma were counted. For NEUN, only cells with proper nuclear localization were counted. Data are represented as mean ± SEM. 22 Yr Female n = 238 cells, 42 Yr Female, n = 100 cells, 56 Yr Male n = 171 cells, and 68 Yr Female n = 216.
(D) Converted neurons display hallmark sodium channel (SCN1A), axonal initial segment (ANKG) (left) and synaptic vesicle (SV2) (right) staining patterns. Scale bars = 20μm.
(E) Representative traces of TTX-sensitive inward and potassium whole-cell currents.
(F) Repetitive AP waveforms in response to 500 ms current injections recorded from converted neurons in monoculture.
(G) Summary of AP firing patterns observed in 23 neurons recorded in current-clamp mode (left) and representative waveforms within each firing pattern recorded (right).
See also Figure S1.
Functional Properties and Stability of miNs
To determine if miNs displayed membrane excitability, we performed whole-cell recording on miNs without glial co-culture. All cells recorded (23/23 cells) exhibited fast TTX-sensitive inward currents upon depolarization (Figure 1E, while 19/23 cells fired action potentials (APs) during current injections (9 cells with multiple APs and 10 with single APs) (Figures 1F and 1G). Similar current (I)-voltage (V) curve relationships were observed between cells that fired multiple or single APs (Figure S1B). All miNs had stable hyperpolarized resting membrane potentials ranging from −52.7 to −84.5 mV with a mean value of −69.63 mV ± 2.15 mV (S.E.M.) (Figures S1C and S1D). There was no correlation between capacitance and firing patterns suggesting this membrane property is not as an accurate measure of neuronal maturation (Figure S1E). Together, this data indicates that miNs exhibit the membrane functionality of neurons.
The minimum duration of miRNA expression required for neuronal conversion was determined by inactivating the Dox-inducible promoter at 3-day intervals by Dox removal beginning at day 9 until reprogramming day 30 (Figure S1F). Loss of fibroblast identity and gain of neuronal identity was assayed by analyzing fibroblast-specific protein (FSP1) and MAP2 expression, respectively. Surprisingly, we saw a reduction in the number of FSP1-positive cells and the appearance of MAP2-positive cells after only 9 days of miRNA expression. However, efficient switching of a cell population from FSP1-to MAP2-positive cells required 30 days of miR-9/9*-124 expression (Figure S1F). These data reveal the non-synchronous process of the neuronal conversion and temporal requirements for highly efficient neuronal conversion. The stability of miRNA-induced neuronal conversion was determined by following miNs for an additional 30 days after removing miR-9/9*-124 exposure (Figure S1G, top). The majority of miNs remained as post-mitotic neurons (marked by the absence of Ki67, a cell proliferation marker) expressing MAP2, TUBB3, NeuN and NCAM, in contrast to non-converted fibroblasts (Figure S1G, left panel), indicating that the morphological and protein expression changes that accompany miR-9/9*-124-mediated conversion of adult human fibroblasts are stable after 30 days of miR-9/9*-124 expression.
Transcriptional Profiling of miNs
To further explore the miR-9/9*-124-mediated neuronal output, we profiled the transcriptome of starting human adult fibroblasts and miNs after 30 days of neuronal conversion by RNA-Seq. We identified 2,692 differentially expressed genes (DEGs) in miNs representing 1,251 up-regulated and 1,441 down-regulated genes in comparison to fibroblasts (log fold change ≥ 2; adjusted p-value < 0.01) (Figure 2A). A robust down-regulation of fibroblast-specific genes (for instance, S100A4, VIM, FBN1 and, COL13A1) was accompanied an enrichment of pan-neuronal genes including MAP2, SCN1A, SNAP25, NRCAM, and NEFM (Figure 2A, 2B top two traces). Analysis of top 10 gene ontology (GO) terms revealed that upregulated genes in miNs were primarily enriched with terms related to neuronal development and functionality (Figure 2C) while downregulated genes associated with fibroblast functions (Figure 2C). Downregulated genes also included key cell-cycle components (data not shown), consistent with the previous finding that miR-9/9*-124 expression in human fibroblasts caused rapid cell cycle exit without transitioning through a neural stem cell-like state (Yoo et al., 2011). Interestingly, neuronal subtype-specific genes such as TH (dopaminergic neurons), GABBR2, GABR1, and GAD2 (GABAergic neurons), CHAT (cholinergic neurons), or DARPP-32 (striatal medium spiny neurons), were not significantly enriched in miNs (Figure 2B, bottom two traces as examples). Overall, our transcriptome analyses show that miR-9/9*-124 induce a neuronal state characterized by the loss of fibroblast identity and the presence of a pan-neuronal gene expression program without commitment to a particular subtype.
Figure 2. Gene Expression Profiling Reveals Pan-Neuronal Identity Induced by miRNAs Alone.
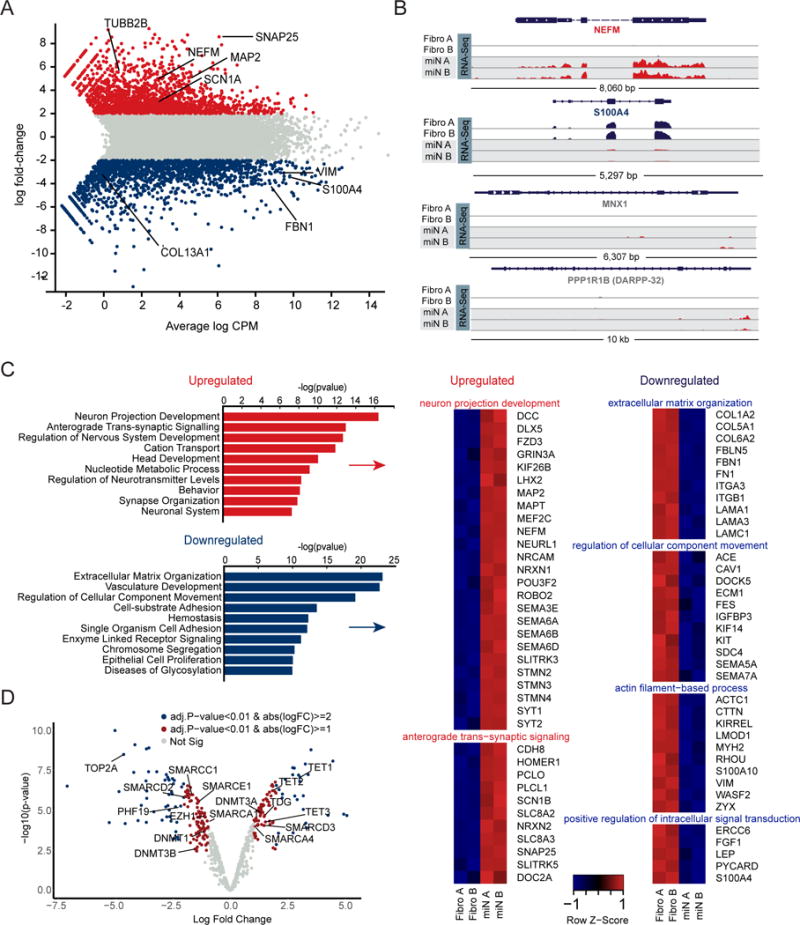
(A) Genome wide expression analysis of miNs and starting fibroblasts by RNA-seq at day 30 of reprogramming. Plot shows the relationship between average gene expression (logCPM) and log fold-change of miNs compared to fibroblasts. A selection of pan-neuronal and fibroblast-specific genes are highlighted in black text. Blue = fold change < −2 log2 p < 0.01 (more abundant in fibroblasts), grey = fold change > −2 log2 < 2 log2 p > 0.01, and red = fold change > 2 log2 p < 0.01 (more abundant in miNs). FDR < 0.01.
(B) Representative genome browser snapshots demonstrating increased expression for a pan-neuronal gene (NEFM), loss of fibroblast marker gene expression (S100A4), and absence of neuronal subtype marker gene expression (MNX1, motor neuron marker; DARPP-32, medium spiny neuron marker).
(C) Gene ontology (GO) terms associated with genes upregulated in miNs (red) and GO terms associated with genes downregulated in miNs (blue). Right, examples of genes that fall within top GO categories listed.
(D) Volcano plot representing chromatin modifier genes differentially expressed between fibroblasts and miNs. Blue dot, abs(logFC) > 2 and p < 0.01, red dot, abs(logFC) > 1 and p < 0.01, grey dot, no significant difference. See also Figure S2.
Transcriptional Changes in Epigenetic Machinery
Epigenetic modifications can markedly affect gene expression and developmental programs (Cantone and Fisher, 2013). Our gene expression studies showed that when compared to fibroblasts, miNs had markedly altered expression of genes involved in DNA methylation, histone modifications, chromatin remodeling and chromatin compaction (Figures 2D and S2). For instance, the TET family of proteins, key mediators of DNA-demethylation (Wu and Zhang, 2011) were upregulated along with the brain-enriched de novo DNA-methyltransferase DNTM3A (Lister et al., 2013), while DNMT3B (Okano et al., 1999) mRNA levels were reduced in miNs compared to fibroblasts (Figures 2D and S2). Transcripts encoding histones and histone variants were altered (Figure S2) suggesting that changes in histone composition may accompany neuronal conversion of human fibroblasts. Genes encoding chromatin remodelers important for neurogenesis like CHD5, CHD7 and components of the BAF chromatin remodeling complex were expressed at higher levels in miNs than in fibroblasts (Egan et al., 2013; Feng et al., 2013; Lessard et al., 2007) (Figures 2D and S2). Additionally, the main DNA topoisomerase 2 family member expressed in miNs is TOP2B, which replaces the non-neuronal TOP2A, a switch that has been observed during normal neuronal differentiation (Tiwari et al., 2012) (Figures 2D and S2). In sum, dynamic changes and switches within diverse epigenetic modifiers coincide with neuronal differentiation and appear to be recapitulated in direct neuronal conversion of fibroblasts by miR-9/9*-124.
Dynamic Regulatory Events During Neuronal Reprogramming
Because transcriptome profiling at day 30 only provided a snapshot of the functional output of neuronal reprogramming, we explored transcriptome dynamics by profiling intermediary timepoints (days 3, 6, 10, and 20) by RNA-seq. The Dynamic Regulatory Events Miner (DREM) (Schulz et al., 2012) reports 13 paths of co-regulated, differentially expressed genes during the first 20 days of neuronal conversion (Figure 3A). Combining DREM with predicted TF-gene binding interactions (Ernst et al., 2010) revealed several potential TFs associated with major regulatory events (bifurcations in each path; Figure 3A). Altogether, major regulatory events were observed before day 10, suggesting genetic networks were established within 10 days of miR-9/9*-124 expression. Thereafter, the directionality of gene expression stayed the same but transcript levels markedly changed. This transcriptional maturation over time may explain why the acquisition of functional neuronal characteristics requires 30 days of culture. GO analyses of each path revealed enrichment of neuronal terms in the most upregulated path, whereas down-regulated paths were enriched for cell cycle and extracellular matrix-related terms (Figure 3B), consistent with results for day 30 transcriptome profiling (Figure 2C). Other dynamically regulated paths included terms such as extracellular matrix, cell adhesion, and regulation of cytoskeleton, which are broadly reflective of the extensive morphological changes that occur during reprogramming. The transcriptome switch from a fibroblast to a neuronal program occurred as early as day 10 of miR-9/9*-124 expression, as fibroblast genes were repressed (e.g. MFAP5 and S100A4) and neuronal genes steadily increased in expression (e.g. SNAP25) while other genes associated with synaptic functionality appeared at day 20 (e.g. HOOK1) (Figure 3C).
Figure 3. Time Series Transcriptome Analysis Reveals Early Dynamic Gene Expression Changes Followed by a Stable Transcriptome Switch.
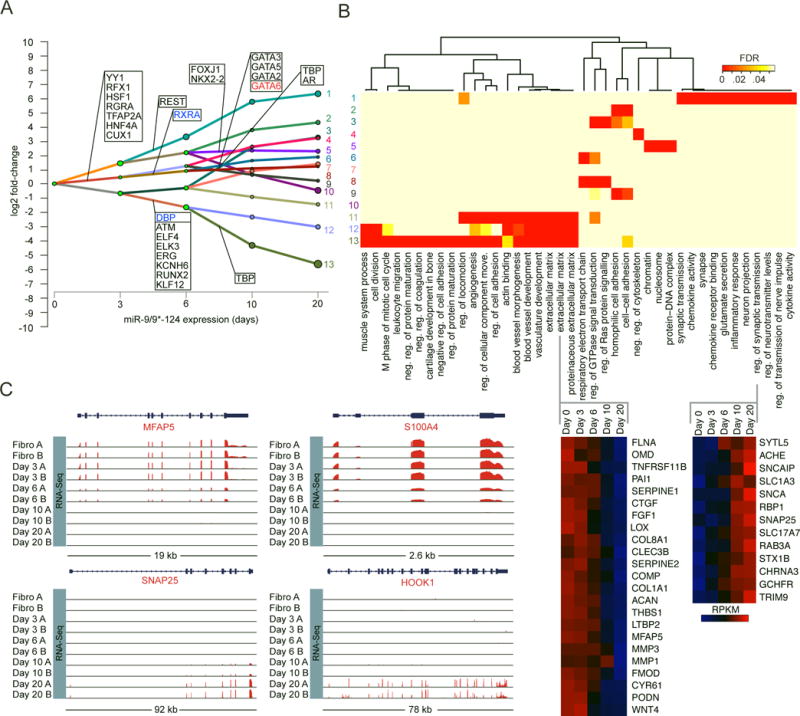
(A) Dynamic Regulatory Event Miner (DREM) analysis reveals multiple paths of co-regulated genes emerge over time (days). Genes shown in each rectangle represent predicted transcription factors that may underlie the transcriptome changes detected.
(B) GO terms enriched in each path (top) and heat maps of genes within the extracellular matrix and regulation of synaptic transmission terms (bottom). Z-score normalized RPKM.
(C) Representative genome browser snapshots demonstrating the time-dependent loss of fibroblast gene expression (top), emergence of pan-neuronal marker gene expression, and synaptic component expression (bottom).
Finally, there were no significant changes in ASCL1 or SOX2 (Figure S3F), TFs that have been used to reprogram somatic cells into neurons (Niu et al., 2013; Pang et al., 2011), suggesting miR-9/9*-124-induced neuronal conversion activates a neuronal program through mechanisms distinct from those previously reported.
DNA Methylation Profiling of miNs
After observing numerous changes in DNA methylation machinery we assessed genome-wide DNA methylation at an early (day 10), intermediate (day 20), and late stage (day 30) of neuronal reprogramming by combining methylated DNA immunoprecipitation sequencing (MeDIP-seq) and methylation sensitive restriction enzyme sequencing (MRE-seq; Figure 4A) (Zhang et al., 2013). No significant changes in DNA methylation were detected at day 10 between cells that were exposed to miRNAs and non-treated control (Ctrl) cells. In contrast, we identified 1,540 differentially methylated regions (DMRs) at day 20 (miN day 20 vs. Ctrl day 20) that overlap with DMRs at day 30 (miN day 30 vs. Ctrl day 30; Figures 4B and 4C). The difference in DNA methylation at day 30 between treated and control cells was more dramatic than changes observed at day 20 with most DNA regions undergoing demethylation. Gene ontology (GO) analysis of Mouse Genome Informatics (MGI) expression using the GREAT (McLean et al., 2010) tool to characterize the top overlapping DMRs in miNs enriched only for neuronal tissue developmental processes (Figure 4D). Interestingly, these differentially methylated regions undergo changes at TS15 in mouse development (equivalent to mouse E9/10), which is when miR-9 expression is first detected in developing mouse telencephalon (Shibata et al., 2008). Two examples of top DMRs within genes important for neuronal development and function are shown in Figure 4E (Gehrke et al., 2010; Vadhvani et al., 2013). Nearly 64% of DMRs were located in introns and 28% of DMRs are in intergenic regions (Figure 4F). Comparison of data from day 30 demethylated and methylated DMRs and RNA-seq revealed 882 differentially expressed genes in total. GO analysis of top demethylated DMRs associated with upregulated genes (> 2.5 logFC) was enriched for neuronal terms. In contrast, top methylated DMRs associated with down-regulated genes (< 2.5 logFC) did not match GO terms involved in neural development (Figure 4G; data not shown). Furthermore, since miR-9/9*-124 expression quickly induces cell cycle exit, these changes in DNA methylation must necessarily occur via active processes, such as those catalyzed by TET and TDG enzymes (Kohli and Zhang, 2013), rather than via failure to remethylate DNA after DNA replication. We should note that due to the need to isolate sufficient DNA, profiling of DNA methylation was performed using human neonatal fibroblasts, which grow faster and senesce much later than the human adult fibroblasts used throughout this manuscript, and could differ in some ways from results generated using adult cells.
Figure 4. MiR-9/9*-124 Alter DNA Methylation at Neuronal Loci.
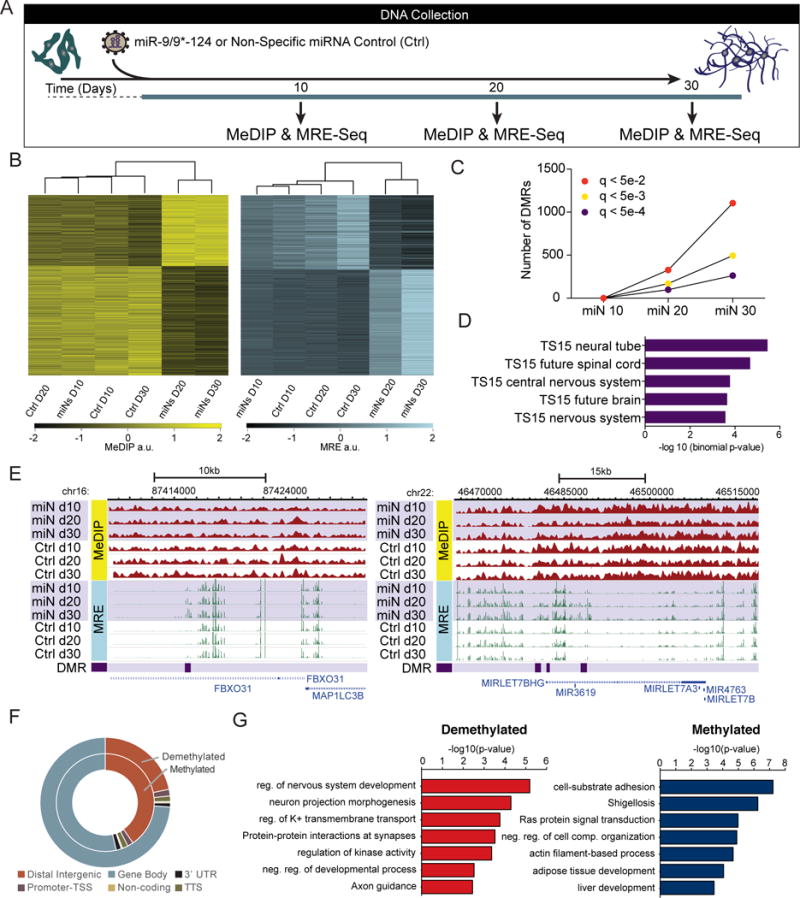
(A) Schematic of sample collection during miR-9/9*-124-mediated neuronal reprogramming for DNA methylation studies. Human fibroblasts were transduced with virus expressing miR-9/9*-124 or a non-specific (NS) control (Ctrl) virus at day 0. Samples were collected at day 10, day 20, and day 30.
(B) Biclustering analysis of DMRs. Heatmaps based on MeDIP-seq RPKM (left) and MRE-seq RPKM (right) showing overlapping DMRs at days 20 and day 30.
(C) Quantification of DMRs at multiple q-value cutoffs (q < 5e-2 in red; q < 5e-3 in yellow; q < 5e-4 in purple) across all time points: miN 10 (miN day 10 vs. Ctrl day 10), miN 20 (miN day 20 vs. Ctrl day 20), and miN 30 (miN day 30 vs. Ctrl day 30).
(D) Tissue development enrichment of top overlapping DMRs at day 20 and day 30 show neuronal tissue terms at TS15 (~E9/10 in mouse development).
(E) WashU Epigenome Browser screenshots of two DMRs: FBXO31 (left) and MIRLET7BHG (right) loci are shown with MeDIP-seq tracks (red; top), MRE-seq tracks (green; middle), and DMR positions (purple; bottom).
(F) Genomic distribution of differentially methylated and demethylated regions.
(G) Functional enrichment of top demethylated and upregulated (red; left) or methylated and downregulated (blue; right) DMRs overlapping at day 20 and day 30 compared with RNA-seq at day 30.
Chromatin Remodeling in miNs
Extensive expression changes in diverse chromatin remodeling genes during neuronal reprogramming (Figures 2D and S2) suggest that miR-9/9*-124 may also alter chromatin accessibility. We therefore performed Assay for Transpose-Accessible Chromatin followed by high throughput sequencing (ATAC-seq) 10 and 20 days after initiating miR-9/9*-124 induced neuronal conversion. A high correlation between replicates confirmed the reproducibility of our analyses (Figure 5A). We obtained 154,406 total peaks across all samples and identified 59,200 differential peaks (Figure 5B). Of the total peaks detected, 20,712 became more accessible (opened) and 38,882 peaks became inaccessible (closed). Most differential peaks in miNs at day 10 overlapped with the peaks at day 20 and the signal intensity of peaks gradually increased or decreased during the conversion (Figure 5C), suggesting gradual transition of chromatin accessibility during reprogramming (Figure 5C). Interestingly, the ratio of open intragenic to distal intergenic regions increased during miR-9/9*-124-mediated conversion (Figure 5D).
Figure 5. MiR-9/9*-124 Globally Changes Chromatin Accessibility.
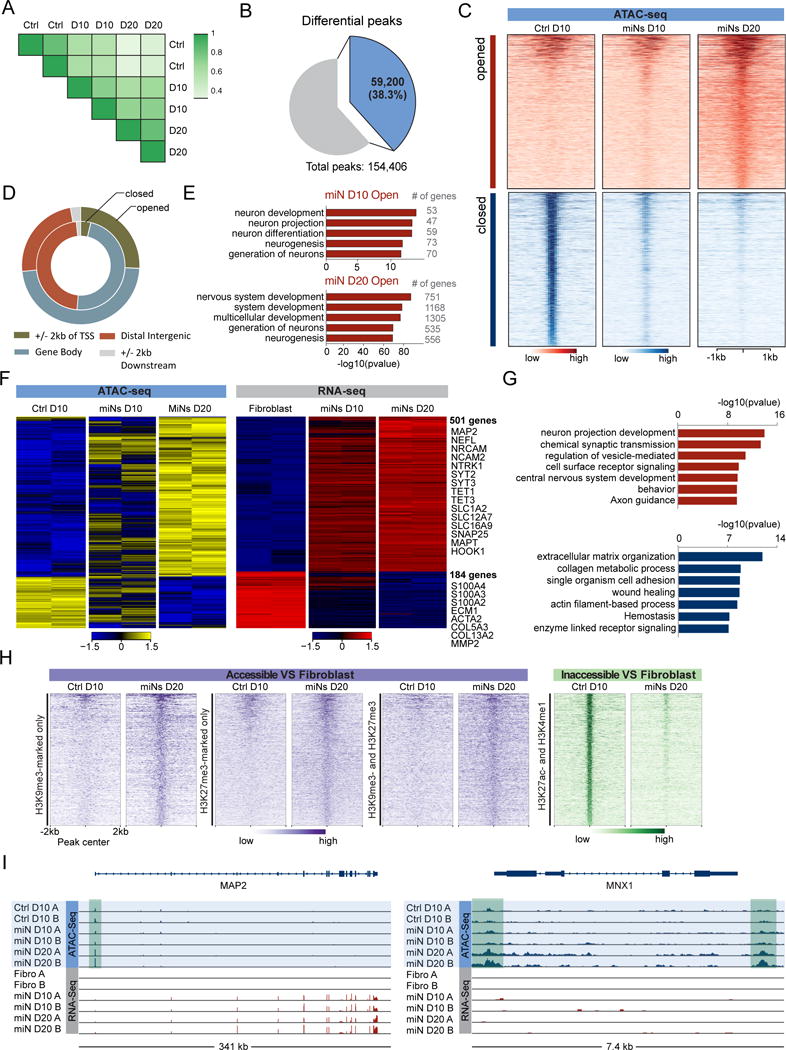
(A) Two-dimensional correlation plot of samples. Pearson’s correlation coefficient: 0.90 for Ctrl D10; 0.83 for miNs D10 (D10); 0.90 for miNs D20 (D20).
(B) Pie chart showing the proportion of differential peaks and total peaks. Differential peaks were obtained by combining all significant peaks (Ctrl D10 vs miNs D10, miNs D10 vs miNs D20).
(C) Heatmaps showing signal intensity in opened and closed chromatin peaks across all time points. All opened and closed chromatin regions were ranked according to maximum intensity across all samples.
(D) The genomic distribution of opened and closed chromatin regions.
(E) Comparison of GO terms for genes with opened chromatin regions at promoters in miNs at day 10 and 20.
(F) Heatmaps showing gene expression levels for DEGs positively correlated with ATAC-seq signal intensities in their promoter regions. Signal intensity is based on normalized counts per million (CPM) values. Z-score normalized logCPM.
(G) Top GO terms associated with DEGs that correlate with ATAC-seq signal intensity in promoter regions. Top (red): opened and upregulated genes. Bottom (blue): closed and downregulated genes.
(H) Heatmaps showing ATAC signal intensities in the opened and closed chromatin regions in response to miR-9/9*-124, which overlapped with closed/heterochromatin and enhancer regions of fibroblasts.
I) Integrated genomics viewer (IGV) screenshots showing two different examples of ATAC-seq and RNA-seq integration. An example of ATAC-seq and RNA-seq peaks within a pan-neuronal gene: MAP2 (left) and an example of ATAC-seq peaks (shaded green) within a subtype-specific locus without gene expression changes: MNX1 (right). See also Figures S3 and S4.
Erasure of Fibroblast Epigenetic Identity and Gain of Neuronal Chromatin Architecture
To gain insight into biological relevance of changes in chromatin accessibility after miR-9/9*-124 expression, we performed gene enrichment analysis on genes with differential ATAC signals around the transcription start site ± 2Kb (TSS). We identified 4,915 genes with gradual increases and 1,763 genes with gradual decreases in ATAC signals during conversion. Top GO terms associated with genes with increased ATAC signals are enriched in neuronal terms (Figure 5E), while closed regions were not (Figure S3A). The number of genes in open regions associated with neuronal terms gradually increased from day 10 to 20 consistent with our transcriptional profiling and coinciding with bona fide neuronal commitment of miNs (Figure 5E). Consistent with this hypothesis, chromatin accessibility for fibroblast marker genes like S100A4, S100A10, VIM and COL13A1 gradually decreased between 10 and 20 days into neuronal conversion. Collectively, our ATAC-seq analyses demonstrate miR-9/9*-124-induced chromatin remodeling events are characterized by concurrent closing of fibroblast-related genomic loci and opening of neuronal gene loci.
Next, we examined whether miR-9/9*-124-induced chromatin accessibility correlated with changes in mRNA levels. We compared DEGs (logFC > 2 or < −2 adjusted p-value < 0.01) to genes with altered chromatin accessibility around the TSS and identified 501 upregulated and 184 down-regulated genes that coincide with open and close regions, respectively (Figure 5F). GO enrichment analysis revealed that upregulated genes from opened regions associated with neurogenic terms, while downregulated genes from closed regions were connected with terms important for fibroblast function (Figure 5G, see S3E for example tracks). This demonstrates the concordant regulation of transcription and chromatin accessibility mediated by miR-9/9*-124. Interestingly, some opened genomic regions that displayed no changes in gene expression contained genes that are specifically expressed in various neuronal subtypes, including those enriched in: dopaminergic neuron markers (TH and SLC6A3), serotonergic neuron markers (FEV, LMX1B and SLC6A4), GABAergic neuron markers (SLC6A1, SLC32A1, GAD2), striatal medium spiny neuron marker (PPP1R1B), glutamatergic neuron markers (GLUL and SLC1A6), and cholinergic or motor neuron markers (MNX1, CHAT, and SLC5A7) (Figure S3G for example tracks). These results suggest that miR-9/9*-124 poise the chromatin to accept additional inputs from subtype-specifying determinants without activating subtype-specific programs. In all, the chromatin dynamics observed during miRNA mediated neuronal conversion are consistent with time-dependent suppression of fibroblast identity concurrent with the opening of neuronal loci and activation of pan-neuronal gene expression.
MicroRNA-induced Chromatin Remodeling at Heterochromatin Regions in Fibroblasts
To gain a more complete understanding of the epigenetic architecture within opened and closed chromatin sites, we examined the relationship of these regions to pre-existing histone marks present in fibroblasts. We hypothesized that regions that close during reprogramming would overlap with the active enhancer/euchromatin marks H3K27ac and H3K4me1 in fibroblasts. Conversely, regions that open during neuronal reprogramming may overlap with heterochromatic H3K9me3 and H3K27me3 signatures pre-existing in fibroblasts.
We selected 70,661 regions commonly marked by H3K27ac and H3K4me1 (enhancer/euchromatin) and 5,843 regions commonly marked by H3K9me3 and H3K27me3 (heterochromatin/closed) in human fibroblasts based on the Roadmap Epigenome database (Roadmap Epigenomics et al., 2015). Strikingly, we found that 1,128 ATAC signal peaks present in day 20 miNs that displayed increased accessibility during the neuronal conversion overlapped with regions of fibroblasts marked by H3K9me3/H3K27me3, heterochromatic marks in fibroblasts, whereas H3K27ac/H3K4me1 euchromatic regions in fibroblasts overlapped with 16,207 peaks that were closed in miNs (Figure 5H). GO enrichment analysis of genes associated with open chromatin regions in miNs that were marked by H3K9me3 or H3K27me3 in fibroblasts resulted in neuronal differentiation and function-related terms (Figure S3B). In contrast, regions with decreased chromatin accessibility in miNs were enriched with non-neuronal terms (Figure S3D). These results demonstrate the surprising potency of miR-9/9*-124 to open heterochromatin regions needed for neuronal fate and to close enhancer regions associated with fibroblast fate. Our results collectively demonstrate that microRNAs can change chromatin architecture to promote neuronal and repress fibroblast fates during the direct conversion of human fibroblasts to neurons.
Chromatin Remodeling is Required for Direct Conversion
To further determine if chromatin changes were necessary for generating miNs, we knocked down the expression of BRG1, a core component of BAF chromatin remodeling complex whose reduced function has been shown to collapse the overall chromatin architecture (Kadoch et al., 2017) (Figure S4A). After 20 days of neuronal conversion, loss of BRG1 markedly decreased the number of MAP2-positive cells when compared to a control shRNA (Figure S4B and C). ATAC-seq revealed regions which failed to open in response to miR-9/9*-124 in the absence of BRG1 (Figure S4D and E). These regions were associated with neuronal GO terms in contrast to the fibroblast-related GO terms associated with regions that failed to close (Figure S4F). These data demonstrate the requirement of chromatin remodeling during miR-9/9*-124-mediated neuronal conversion.
Instructing the miRNA-induced Neurogenic State to a Motor Neuron Fate
The deposition and removal of nucleosomes along regulatory elements within DNA inhibits or enables the binding of TFs, simultaneously facilitating and reinforcing cell-type specific gene expression programs (Jiang and Pugh, 2009). In our previous analyses we noted chromatin regions in miNs with enhanced accessibility were proximal to MNX1 and choline acetyl transferase CHAT, two of the hallmark genes expressed by motor neurons (Fonnum, 1973; Tanabe et al., 1998) (Figure 5I). Neither MNX1 nor CHAT mRNA levels were elevated in day 30 miNs after miR-9/9*-124 directed neuronal conversion, but we hypothesized the open chromatin would facilitate expression of these genes in response to motor neuron-specific TFs. To test this hypothesis, we expressed a panel of TFs known to promote motor neuron identity (Figure S5A) in combination with ectopic miR-9/9*-124 expression, and assayed for MAP2 and MNX1 expression by immunostaining (data not shown). While all combinations resulted in MAP2 positive cells, only ISL1 and LHX3 robustly led to the generation of MNX1-positive cells. Co-expressing LHX3 and ISL1 with miR-9/9*-124 in adult human fibroblasts from 22-, 42-, 56- and 68-year-old donors resulted in MAP2, TUBB3 and NCAM-positive cells with complex neuronal morphologies (Figures 6A and 6B). Approximately 80% of cells positive for DAPI staining were positive for TUBB3, MAP2 and NCAM expression (Figure 6C). The majority of converted cells displayed nuclear staining of MNX1 (~85% of TUBB3 positive cells in each line, Figures 6D and 6E). Similarly, cytoplasmic CHAT protein and SMI-32 (a neurofilament protein found in motor neurons) were detected in ~80% of TUBB3 positive cells within each age group (Figure 6D and 6E).
Figure 6. MiRNA-Induced Neuronal Competence Enables Motor Neuron Transcription Factors, ISL1 and LHX3, to Determine Motor Neuron Identity.
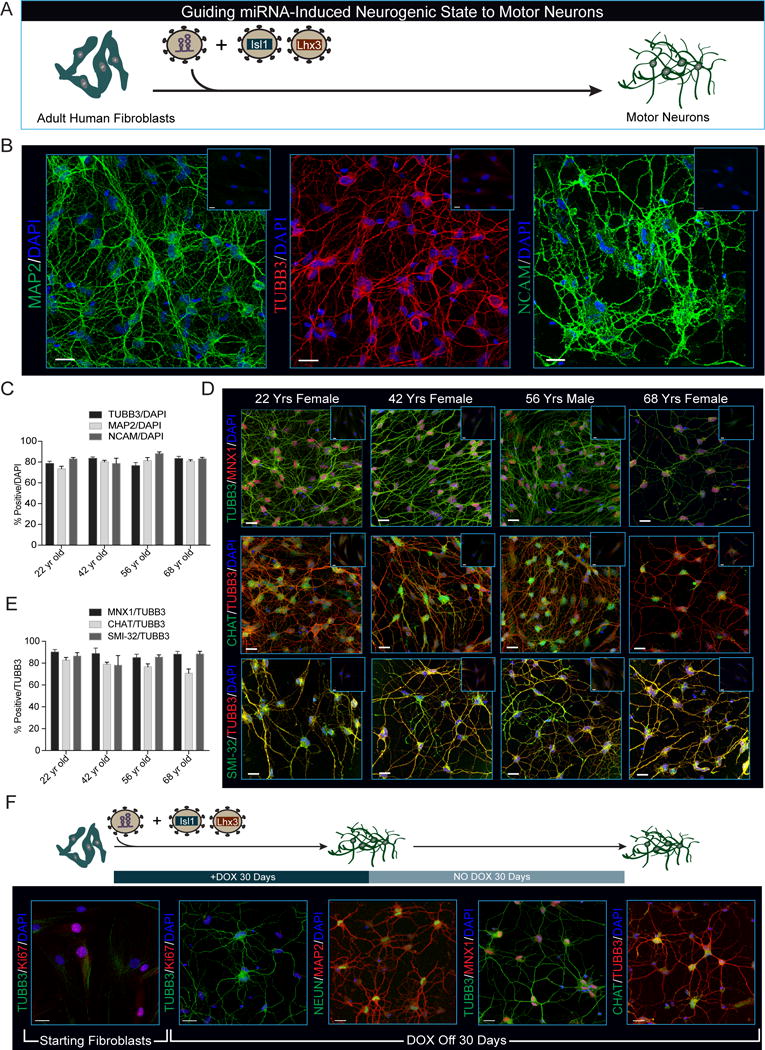
(A) Schematic of neuronal induction paradigm using miR-9/9*-124 plus ISL1 and LHX3.
(B) Representative immunohistochemistry for pan-neuronal markers in neurons generated from fibroblasts through 35 days of miR-9/9*-124, ISL1, and LHX3 co-expression. Fibroblasts were isolated from a 22-year-old female donor. Scale bars = 20μm.
(C) Quantification of 4 independent primary human fibroblast samples from male and female donors stained with TUBB3, MAP2 and NCAM. Percentages represent total number of positive cells over all cells (DAPI) and are represented as mean ± SEM. Cells (N) analyzed: 22 yr old N=TUBB3 325, MAP2 219, NCAM 275; 42 yr old N=TUBB3 304, MAP2 236, NCAM 129; 56 yr old N=TUBB3 275, MAP2 279, NCAM 213; 68 yr old N=TUBB3 282, MAP2 234, NCAM 190.
(D) Expression and correct localization of motor neuron markers in neurons converted by miR-9/9*-124 and ISL1/LHX3 as demonstrated by immunohistochemistry. MNX1, (top), CHAT (middle) and SMI-32 (bottom). Scale bars = 20μm.
(E) Quantification of (D) represents the total percentage of MNX1, CHAT and SMI-32-positive cells over TUBB3-positive cells. Data are represented as mean ± SEM. Cells analyzed: 22 yr old N=MNX1 256, CHAT 256, SMI-32 113; 42 yr old N= MNX1 151, CHAT 151, SMI-32 283; 56 yr old N= MNX1 207, CHAT 207, SMI-32 174; 68 yr old N= MNX1 151, CHAT 151, SMI-32 96.
(F) After 30 days of neuronal conversion by ectopic miR-9/9*-124 expression, Dox was removed and cells were cultured for an additional 30 days. Immunocytochemistry showing motor neurons produced by miR-9/9*-124 plus ISL1 and LHX3 (Moto-miNs) remain Ki-67 negative (2nd panel), retain expression and localization of the neuronal proteins TUBB3, NEUN, and MAP2 (2nd and 3rd panel), and express the motor neuron proteins MNX1 and CHAT (4th and 5th panel). Scale bars = 20μm.
See also Figure S5.
Interestingly, ISL1 and LHX3 alone were not sufficient to induce neuronal conversion when co-expressed with a non-specific miRNA (miR-NS) (Figure S5B), supporting the notion that miR-9/9*-124 is necessary for the subtype-specifying activities of ISL1 and LHX3. We also found the motor neuron conversion induced by miR-9/9*-124 with ISL1 and LHX3 to be stable, displaying neuronal morphologies, cell cycle exit, and motor neuron marker expression for 30 days after Dox removal (Figure 6F).
Electrophysiological properties of Moto-miNs
Motor neurons produced from fibroblasts by co-expression of miR-9/9*-124, ISL1 and LHX3 (Moto-miNs) demonstrated robust inward and outward currents in response to depolarizing steps (Figure 7A) and displayed AP trains through the injection of step-wise depolarizations (Figures 7B and S5C). The visualization of single traces recorded at individual current steps revealed the characteristic hyperpolarization following each action AP seen in mature neurons (Figure 7C). To assess the percentage of functionally mature Moto-miNs, we patched 45 randomly chosen Moto-miNs from 22-year-old and 68-year-old donors. All Moto-miNs fired APs in which most cells fired multiple APs (80% n = 20 and 74% n = 25) while single APs were observed in ~20–25% of the patched cells (Figure 7D). Gap-free recordings in current clamp mode revealed cells capable of firing spontaneous APs (Figure 7E), demonstrating the excitability of the converted Moto-miNs. Similar I–V curve relationships were observed between donors and firing patterns (Figure 7F). Peak inward currents were substantially higher than those observed in miNs (Figure S6A). Lastly, resting membrane potentials in all Moto-miNs tested were hyperpolarized (Figure 7G; 22 yr old, −67.2 mV ± 3.3 mV; 68 yr old, −72.8 mV ± 2.0 mV, S.E.M.). Coupled with the increased proportion of cells that fire multiple APs, these data suggest that the addition of ISL1 and LHX3 to miR-9/9*-124 produced more mature neurons than exposure to miR-9/9*-124 alone.
Figure 7. Functional Properties and Gene Expression Profile of Moto-miNs.
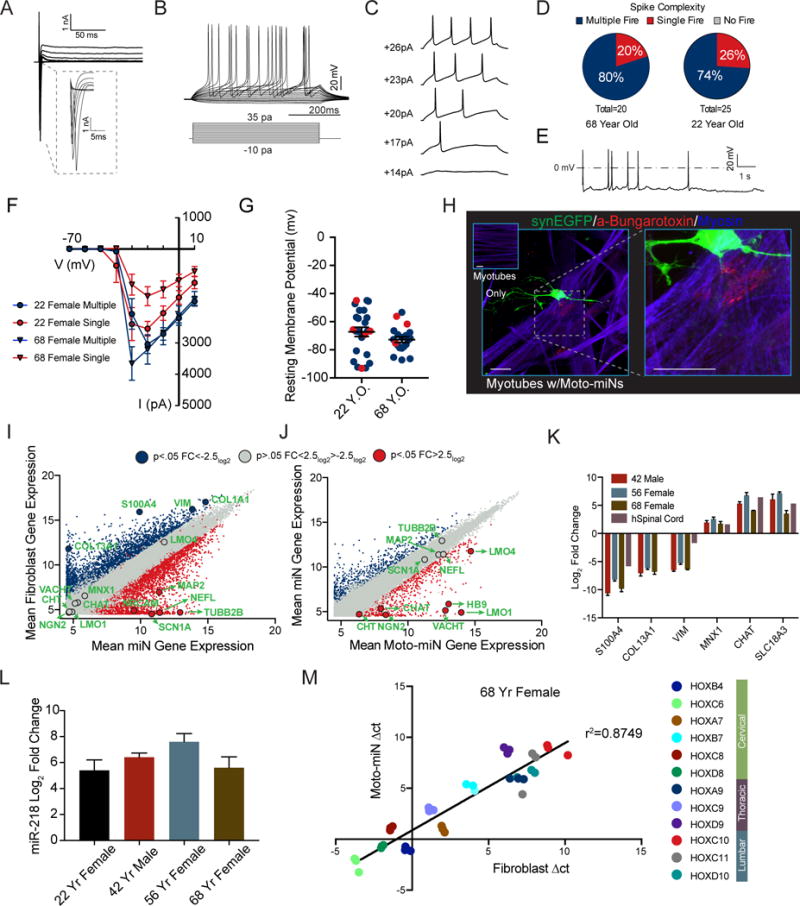
(A) Representative traces of inward sodium and outward potassium whole-cell currents.
(B) Repetitive AP waveforms in response to 500 ms current injections recorded from Moto-miNs in monoculture.
(C) Representative waveforms of APs with increasing current injections.
(D) Summary of firing patterns observed in Moto-miNs converted from both old and young donors. 68 yr old 80% multiple (N=20), 22 yr old 74% multiple (N=25).
(E) Spontaneous AP generation observed in a small percentage of Moto-miNs (3/20).
(F) Combined plot of the current (I) - voltage (V) relationship for all Moto-miNs recorded. Data are represented as mean ± SEM.
(G) Moto-miNs converted from both young and old donors are hyperpolarized, demonstrating mean resting membrane potentials of −67.2mV and −72.8mV, respectively. Data are represented as mean ± SEM.
(H) Staining of Moto-miNs cultured with differentiated human myotubes. Moto-miNs were labeled with synapsin-EGFP via viral transduction and then plated onto human myotubes. Myotube only cultures did not have α-Bungarotoxin-594 (red) puncta (top left inset). Scale bar = 20μm.
(I) Scatterplot comparing the mean gene expression between starting fibroblasts from a 22-year-old donor (y-axis) and miNs generated from the same individual (x-axis). Plot highlights a selection of pan-neuronal and fibroblast-specific genes in green text. Blue = log2FC < −2.5 and p < 0.05, (more abundant in fibroblasts) grey = log2FC > −2.5 and < 2.5 p > 0.05 (no significant difference), and red = log2FC > 2.5 and p < 0.05 (more abundant in miNs).
(J) Scatterplot comparing the mean gene expression between miNs from a 22-year-old donor (y-axis) and Moto-miNs generated from the same individual (x-axis). Plot highlights a selection of pan-neuronal and motor neuron-specific genes in green text. Blue = log2FC < −2.5 and p < 0.05, (more abundant in miNs) grey = log2FC > −2.5 and < 2.5 p > 0.05 (no significant difference), and red = log2FC > 2.5 and p < 0.05 (more abundant in Moto-miNs).
(K) qRT-PCR validation of fibroblast and motor neuron-specific genes. Moto-miNs were analyzed by qRT-PCR 35 days post-transduction. Human spinal cord RNA served as a positive control (normalized to 42 yr fibroblasts, ΔΔct method). Data are represented as mean ± SEM.
(L) Moto-miNs express the motor neuron specific miRNA, miR-218. RNA was isolated from fibroblasts and Moto-miNs 35 days post-transduction and analyzed by qRT-PCR. Data are represented as mean ± SEM.
(M) Moto-miNs retain HOX gene expression pattern of donor fibroblasts as demonstrated by qRT-PCR. Δct method. Data represent Δct values for each biological replicate (3 separate Moto-miN conversions). See also Figure S6 and S7.
The ability of motor neurons to control voluntary muscle movement stems from their ability to form neuromuscular junctions (NMJs), unique synapses formed between motor neurons and muscle cells. The formation of NMJs was visualized through the co-localization of EGFP-labeled Moto-miNs, Alexa-fluor-594 Bungarotoxin (BTX, a toxin that binds to the nicotinic acetylcholine receptor (AChR) of NMJs), and myosin heavy chain. BTX puncta were not observed in the absence of Moto-miNs (Figure 7H, left inset). In contrast, Moto-miNs were able to induce characteristic BTX-clustering in close apposition with EGFP labeled neurons and myotubes (Figure 7H) indicating the formation of putative NMJs.
Transcriptional Profiling of Moto-miNs
To fully characterize the acquisition of a motor neuron fate and assess the contribution of ISL1 and LHX3, we profiled the transcriptome of 22-yr-old starting fibroblasts, miNs and Moto-miNs by microarray. We again observed the loss of fibroblast gene expression (for example, S100A4, VIM and COL13A1), and the gain of a pan-neuronal identity (for example, MAP2, NEFL, SNAP25 and SCN1A) 35 days after the expression of miR-9/9*-124 (Figure 7I). Expression of motor neuron-specific genes was not significantly different between starting fibroblasts and miNs. While the addition of ISL1 and LHX3 to miR-9/9*-124 did not significantly change the expression of pan-neuronal genes when compared to miNs (Figure 7J), ISL1 and LHX3 selectively activated key motor neuron genes including MNX1, CHAT, VACHT, LMO1 and LMO4 (Figure 7J). We further validated the loss of fibroblast identity and gain of motor-neuron identity in Moto-miNs derived from 42-, 56- and 68-year-old donors by qRT-PCR using RNA from human spinal cord as a positive control (Figure 7K). In addition, we observed dramatic upregulation of miR-218, a recently identified motor neuron-specific miRNA (Amin et al., 2015; Thiebes et al., 2015) in Moto-miNs (Figure 7L).
Next, we used the cell type-specific enrichment analysis tool (CSEA) (Xu et al., 2014) to test whether the gene expression profile within each population of miNs and Moto-miNs would be associated with distinct subtypes of in vivo neurons. When queried with a gene list, CSEA identifies neuronal subtypes that show significant enrichment in genes from the input list through curated transcriptomic data. Our CSEA analysis of the 100 most enriched genes within Moto-miNs identified two subtypes, brainstem motor neurons and spinal motor neurons, to be significantly associated. No subtype specificity was assigned to the miN transcriptome (Figure S6B). This unbiased bioinformatics approach further supports the motor neuron identity of converted Moto-miNs.
Lastly, HOX gene expression patterns were compared by qRT-PCR between starting fibroblasts and Moto-miNs. Interestingly, we observed a high correlation (R2 = 0.88) between the expression levels of HOX genes before and after conversion within each of the defined spinal cord regions tested, indicating Moto-miNs retain the positional identity that existed in original fibroblasts (Figure 7M, S6C).
Transcriptional Activation of ISL1 and LHX3 Genomic Targets
An alternative approach for generating motor neurons is forced expression of NGN2, ISL1, and LHX3 in human embryonic stem cells (ESCs) (Mazzoni et al., 2013). We compared the genomic targets of ISL1 and LHX3 identified by Mazzoni et al. through ChIP-seq to genes whose expression increases in Moto-miNs compared to miNs. Surprisingly, we identified a large cohort of overlapping genes (323) that include numerous hallmark motor neuron markers (Figure S7A), suggesting that ISL1 and LHX3 activate expression of a core gene regulatory network that specifies the miR-9/9*-124-mediated neuronal conversion towards motor neurons.
Comparison of Moto-miNs to Endogenous Spinal Cord Motor Neurons
The inability to obtain a pure population of spinal cord motor neurons from human adults prevents direct transcriptional comparisons between Moto-miNs and their human in vivo counterparts. Therefore, we directly compared Moto-miNs to fully differentiated in vivo mouse spinal cord motor neurons. To interrogate the gene expression of motor neurons within the large heterogeneity of cell-types present in the spinal cord, we performed Translating Ribosomal Affinity Purification (TRAP) followed by RNA-seq (Figure S7B). The use of two mouse lines expressing EGFP tagged ribosomes (one line under the pan-neuronal SNAP25 promoter, and the other through the CHAT promoter), enabled the enrichment and subsequent sequencing of actively transcribed mRNA in all neurons and motor neurons within the spinal cord. We also profiled the transcriptome of the entire spinal cord as an additional ‘pre-IP’ control. Comparisons between CHAT pre-IP controls and CHAT-TRAP transcripts confirmed significant enrichment of motor neuron markers (Figure S7C, left) by the TRAP procedure. To further separate motor neuron enriched genes from common neuronal genes we first normalized CHAT-TRAP and SNAP-25 datasets to their pre-IP controls, then directly compared the normalized gene expression values. This analysis revealed the co-expression of pan-neuronal genes such as MAP2, NRCAM, SCN1A and TUBB3 and highly enriched for motor neurons transcripts such as SLC18A3 (VACHT), CHAT and MNX1 (Figure S7C, right). This dataset also serves as a resource for genes enriched in spinal cord neurons over all SNAP25 expressing neurons within the spinal cord. To that end, we compared differentially expressed mouse spinal cord motor neuron genes to genes enriched in Moto-miNs over miNs. We observed a significantly larger overlap between Moto-miNs and mouse motor neurons than expected by chance (Fisher’s exact test p = 3.522e-06), indicating that Moto-miNs and endogenous mouse motor neurons utilize similar genetic networks. This includes expression of canonical motor neuron markers such as, SLIT2 and SLIT3, host genes for the motor neuron specific miRNA, miR-218 (Amin et al., 2015) (Figure S7D). Altogether, our in-depth analyses of Moto-miNs at cellular, functional, and transcriptomic levels confirm that co-expression of miR-9/9*-124 and ISL1/LHX3 can directly convert adult fibroblasts into spinal cord motor neurons.
DISCUSSION
MiRNA-mediated neuronal conversion appears to be distinct from current models of cell fate reprogramming. Two models of lineage reprogramming have been proposed: one based on transcription factor cooperativity and positive feedback loops (Jaenisch and Young, 2008; Soufi et al., 2012; Vierbuchen and Wernig, 2012), and the other based on the “on-target” pioneer activity of a TF as shown in neuronal conversion of mouse embryonic fibroblasts (Wapinski et al., 2013). In stark contrast, canonical gene regulation by miRNAs requires the removal of genetic information through translational repression and transcript degradation of their target genes. This mode of repression in conjunction with the multitude of anti-neurogenic genes targeted by miR-9/9*-124 suggests miRNA-mediated reprogramming acts through an alternative mechanism. We propose miR-9/9*-124 expression in non-neuronal somatic cells initiates gradual, yet active changes in the activities of multiple chromatin modifiers while simultaneously repressing anti-neuronal genes and activating neuronal genes culminating in a binary cell-fate switch. This model is supported by the rapid cell cycle exit observed upon ectopic miR-9/9*-124 expression, the subsequent neuronal switching within chromatin modifiers, steady increase in epigenetic and transcriptional changes, and the time scale in which conversion takes place.
Chromatin Remodeling Accompanies Cell Fate Conversion
In this study, we reveal the surprising potency of miR-9/9*-124 for remodeling chromatin and altering DNA methylation. Surprisingly, preexisting neuronal loci within the heterochromatic regions in human fibroblasts opened in response to miR-9/9*-124. These data suggest that the robustness of miRNA-mediated reprogramming observed in human adult fibroblasts could stem from their ability to induce epigenetic changes. Cellular processes and identity are governed by the cumulative action of multiple levels of genome regulation, and it is unlikely that a single genetic component downstream of miR-9/9*-124 would mediate such drastic changes in cellular identities. For example, almost every level of epigenetic remodeling participates in the induction of pluripotency (Takahashi and Yamanaka, 2016), and instructions operating through multiple levels of genetic and epigenetic regulation are likely required for true cell-fate conversion. As such, our thorough analyses of miR-9/9*-124 induced transdifferentiation of human fibroblasts into functional neurons highlights molecular processes that are critical to cell fate conversion.
A Modular Neuronal State
The miRNA-mediated neuronal platform presented here affords modularity to direct the conversion to specific neuronal subtypes. Numerous studies in developmental neuroscience have identified subtype-specific TFs or terminal selector genes that could be incorporated in neuronal reprogramming technologies. Yet, identifying molecules capable of overcoming the cell-fate barrier present in human somatic cells and eliciting a permissive environment in which terminal selector genes can act has proven to be challenging. In this study, we demonstrate that miR-9/9*-124 are capable of evoking a neuronal state through extensive epigenetic remodeling and generating a neuronal population highly enriched with spinal cord motor neurons from human adult fibroblasts with ISL1 and LHX3. Because motor neurons are the major neuronal subtype affected in Amyotrophic Lateral Sclerosis (ALS) and Spinal Muscular Atrophy (SMA), the robustness and specificity of neuronal conversion employing miRNAs and motor neuron TFs may pave the way towards generating patient-specific MNs for disease modeling.
Star Methods Text
Contact for Reagent and Resource Sharing
Further information and requests for reagents may be directed to, and will be fulfilled by, the Lead Contact, Andrew S. Yoo (yooa@wustl.edu).
Experimental Model and Subject Details
Primary Cell Cultures
Primary fibroblasts utilized in this study: 1-year-old male (PCS-201-010, ATCC), 22-year-old female (GM02171, NIGMS Human Genetic Cell Repository at the Coriell Institute for Medical Research), 42-year-old female (F09-238, Washington University in St. Louis School of Medicine iPSC core facility), 56-year-old male (AG04148, NIA Aging Cell Repository at the Coriell Institute for Medical Research), and 68-year-old female (ND34769, NINDS Cell Line Repository at the Coriell Institute for Medical Research). Human skeletal myoblasts (HSMM) were obtained from a commercial source (Lonza, CC-2580). The sex of the human skeletal myoblasts was not provided; however, these cells were not used for neuronal conversion and therefore the sex of HSMM would not change the conclusions drawn from the current study.
Mice
Mouse lines Tg(Chat-EGFP/Rpl10a)DW167Htz (JAX: 030250) and Tg(Snap25-EGFP/Rpl10a)JD362Jdd (JAX: 030273) were purchased from Jackson Laboratory. All the mice were housed under pathogen-free conditions in the East McDonnell animal housing facility of Washington University in St. Louis under a 12 hr light-dark cycle. 21-day-old pooled male and female mice were used in the TRAP-seq studies; see Method Details for TRAP procedure. All the subjects were not involved in any previous procedures.
Ethics statement
The Washington University Animal Studies Committee approved all procedures used for the mouse experiments described in the present study. Overall care of the animals was consistent with The Guide for the Care and Use of Laboratory Animals from the National Research Council and the USDA Animal Care Resource Guide.
Cell Culture
Adult and neonatal human fibroblasts were maintained in fibroblast media comprised of Dulbecco’s Modified Eagle Medium (Invitrogen) supplemented with 15% fetal bovine serum (Life Technologies), 0.01% β- mercaptoethanol (Life Technologies), 1% non-essential amino acids, 1% sodium pyruvate, 1% GlutaMAX, 1% 1M HEPES buffer solution, and 1% penicillin/streptomycin solution (all from Invitrogen). Cells were never passaged more than 15 times.
Plasmid construction and virus production
Complementary cDNA was generated from adult human spinal cord (Clontech) from which individual motor neuron transcription factors (Figure S5A) were subcloned into the N174 and N106 lentiviral vectors using standard techniques. Lentivirus was produced in Lenti-X 293T (293LE; Clontech, cat. no. 632180) cells. 293LE cells plated in 10cm dishes (6.5 × 10^6 cells per dish) via polyethylineimine (48 μL of 2 mg/mL, Polysciences) assisted transfection of 2nd generation packaging vectors (1.5 μg pMD2.G and 4.5 μg psPAX2), and 6 μg of lentiviral backbone plasmid (e.g. pT-BCL-9/9*-124) 16 hours after initial plating. Media was changed the next day. After 2 days, media was collected, filtered through a 0.45 μm polyethersulfone (PES) syringe filter and concentrated by centrifugation at 70,000×G for 2 hours at 4°C. Virus collected from a single 10 cm dish was resuspended in 1 mL of sterile PBS then aliquoted and stored at −80°C. Before each transduction, virus aliquots were spun at 5,000×G for 5 minutes at 4°C to remove debris. Control vector expressing non-specific (NS) miRNA and BCL-XL was generated previously (Victor et al., 2014). Lentiviral BRG1 shRNA was generated by annealing then ligating the following sequences into the pLKO vector (Addgene, 8453), shBRG1 FWD 5′ CCGGGGTGCTCAACACGCACTATGTCTCGAGACATAGTGCGTGTTGAGCACCTTTTTG 3′, shBRG1 REV 5′ AATTCAAAAAGGTGCTCAACACGCACTATGTCTCGAGACATAGTGCGTGTTGAGCACC 3′.
Method Details
Direct Neuronal Conversion
To initiate direct conversion, 1.8×10^6 cells were seeded onto Costar 6-well cell culture plates (Corning; 300,000 cells/well). The following day, each plate was transduced with the following reprogramming cocktail: 750 uL of concentrated lentivirus containing the reverse tetracycline-controlled transactivator (rtTA; Addgene, 66810) and 500 μL of virus containing pT-BclXL-9/9*-124 or pT-BclXL-9/9*-124 plus 500 μl of each individual TF driven by the EF1α promoter in the presence of polybrene (8 μg/mL; Sigma-Aldrich) all diluted up to 18 mL (3 mL per well) then spinfected at 37°C for 30 minutes at 1,000×G using a swinging bucket rotor. The following day media was changed to fresh fibroblast media (2 mL per well) supplemented with doxycycline (Dox; Sigma Aldrich, 1 μg/mL). After 2 days, fresh fibroblast media was changed and supplemented with Dox and antibiotics for respective vectors (Puromycin, 3 μg/mL; Blasticidin 5 μg/mL; Geneticin, 400 ug/mL; all from Invitrogen). Five days post-transduction cells were replated on to poly-ornithine/laminin/fibrobnectin (PLF) coated glass coverslips. Before PLF coating, glass coverslips were acid treated as previously reported (Richner et al., 2015). To transfer cells, for each well of a 6 well plate, cells were first washed 2× with 1 mL sterile PBS. Then 320 μL of 0.25% Trypsin (Gibco) was added to each well then placed in an incubator. Cells were monitored every 2 minutes. As soon as cells began to detach (no more than 6 minutes), 1 ml of fibroblast media supplemented with 1 μg/mL Dox was added to each well. One by one, each well was gently triturated three times to remove remaining attached cells then transferred to a sterile 1.5 mL Eppendorf tube. Cells were then spun at 200×G for 5 minutes at 37°C. The supernatant was aspirated and cells were gently resuspended in 300 μL fibroblast media supplemented with Dox. Cells were then drop-plated onto either 18 mm (150 μL per coverslip; placed in 12 well plate) or 12mm (60 μL per coverslip; placed in 24 well plate) coverslips. Cells were left to settle for 15 minutes in an incubator then each well was flooded with fibroblast media supplemented with 1 μg/mL Dox. The following day media was then changed to Neuronal Media (ScienCell, 1521) supplemented with Dox, valproic acid (1 mM; EMD Millipore) dibutyryl cAMP (200 μM; Sigma-Aldrich), BDNF, NT-3, CNTF, GDNF (all 10 ng/mL, Peprotech), and Retinoic Acid (1 uM; Sigma-Aldrich) and antibiotics for each vector. Dox was replenished every two days and half the media was changed every 4 days. Drug selection was stopped 14 days into conversion. A diagram of the reprogramming protocol is available in Figure S1.
For time-course studies, the above reprogramming protocol was utilized with the following exception. In 3-day intervals starting on reprogramming day 9, a full media change excluding Dox was used to effectively remove Dox from the well at each timepoint.
For DNA methylation profiling, 1.8×10^6 human neonatal fibroblasts were seeded onto 10 cm plates (Corning). To achieve the cell number required for meDIP and MRE-seq human neonatal fibroblasts were utilized as adult fibroblasts were unable to expand to sufficient quantities. The following day, each plate was transduced with 10 ml of unconcentrated lentivirus containing media with a doxycycline inducible miR-9/9*-124 vector (Victor et al., 2014) and polybrene (8 μg/mL; Sigma-Aldrich). The following day media was changed to fresh fibroblast media (2 mL per well) supplemented with Dox. After 2 days, fresh fibroblast media was changed and supplemented with Dox and antibiotics for respective vectors (see Table 1). Seven days post-transduction, cells were first washed 2× with 3 mL sterile PBS. Then 1 ml of 0.25% Trypsin (Gibco) was added to each plate then placed in a 37°C tissue culture incubator. Cells were monitored every 2 minutes and as soon as cells began to detach (no more than 6 minutes), 4 ml of fibroblast media supplemented with 1 μg/mL Dox was added to each plate. Cells were transferred to Primaria modified 10 cm plates (Corning) and 5 ml fresh fibroblast media supplemented with 1 μg/mL Dox was added to a final volume of 10 ml. The following day media was changed to Neuronal Media (Sciencell) supplemented with Dox, valproic acid (1 mM; EMD Millipore) dibutyryl cAMP (200 μM; Sigma-Aldrich), BDNF, and NT-3 (all 10 ng/mL, Peprotech), Retinoic Acid (1 uM; Sigma-Aldrich), and 4% FBS. Dox was replenished every two days and half the media was changed every 4 days.
Myotube Differentiation
Human myotubes were generated by differentiating human myoblasts using defined culture conditions (Steinbeck et al., 2016). Briefly, human skeletal myoblasts were cultured according to manufacturers recommendations (HSMM; Lonza, CC-2580) then were plated on matrigel (0.1mg/mL) coated 12mm glass coverslips at a density of 80,000 cells/well. The following day HSMM’s were differentiated by switching media to skeletal muscle differentiation media comprised of a 1:1 mixture of DMEM F12 (Gibco) and Complete Neuronal Media + 2% Horse Serum (Gibco). Every 2 days 75% of the media was replaced with fresh differentiation media. After 10–14 days of differentiation, Moto-miNs 14 days into conversion and labeled with synapsin-eGFP via lentiviral transduction were replated onto the established myotubes at a 1:1 ratio (i.e. one 12mm Moto-miN coverslip was replated on top of a 12mm myotube coverslip). The following day media was changed to complete neuronal media and cells were cultures for 2 weeks. Dox was replenished every two days and half the media was changed every 4 days. After two weeks cells were fixed with 4% paraformaldehyde and processed for immunocytochemistry and α-Bungarotoxin staining.
Immunocytochemistry
Cells were fixed using 4% formaldehyde for 18 minutes at room temperature (RT) then blocked and permeabilized for one hour at room temperature in PBS containing 0.3% Triton-X100, 5% bovine serum albumin (Sigma-Aldrich), and 2% of either goat or donkey serum (Sigma-Aldrich). Primary antibodies were incubated overnight at 4°C in blocking buffer. Cells were then washed 3× and incubated with secondary antibodies conjugated to either Alexa-488, −594 or −647, for one hour at room temperature. α-Bungarotoxin was incubated with secondary antibodies at a concentration of 1:200. Images were obtained on a Leica SP-2 Confocal Microscope.
Electrophysiology
Whole-cell patch-clamp recordings were performed 35–40 days post-transduction. Data was acquired using pCLAMP 10 software with multiclamp 700B amplifier and Digidata 1550 digitizer (Molecular Devices). Electrode pipettes were pulled from borosilicate glass (World Precision Instruments) and typically ranged between 5–8 M resistance. Intrinsic neuronal properties were studied using the following solutions (in mM): Extracellular: 140 NaCl, 3 KCl, 10 Glucose, 10 HEPES, 2 CaCl2 and 1 MgCl2 (pH adjusted to 7.25 with NaOH). Intracellular: 130 K- Gluconate, 4 NaCl, 2 MgCl2, 1 EGTA, 10 HEPES, 2 Na-ATP, 0.3 Na-GTP, 5 Creatine phosphate (pH adjusted to 7.5 with KOH). Membrane potentials were typically kept at −65 mV. In voltage-clamp mode, currents were recorded with voltage steps ranging from −20 mV to +90 mV. In current-clamp mode, action potentials were elicited by injection of step currents that modulated membrane potential from −10 mV to +35 mV. Data was collected in Clampex and initially analyzed in Clampfit (Molecular Devices). Further analysis was done in GraphPad Prism 7 (GraphPad Software). Liquid junction potential was calculated to be 15.0 mV and corrected in calculating resting membrane potential according to previously published methods (Barry, 1994).
RNA-Sequencing
Total RNA from day 30 miNs and starting human adult fibroblasts (22 yr old) were extracted by RNeasy plus micro kit (Qiagen). The RNA samples with > 9.5 of RIN based on a 2100 Bioanalyzer were used for RNA-Seq library preparation. Library preparation and sequencing were performed by Genome Technology Access Center in Washington University School in St. Louis. Briefly mRNA was isolated by using SMARTer Ultra Low RNA Kit for Illumina sequencing (Clontech). All cDNA libraries, based on two biological replicates for each condition, were sequenced on Illumina Hi-Seq 2500 with single-end 50 bp read length.
For RNA-seq time series data in Figure 3, total RNA was extracted from starting human adult fibroblasts (22 yr old) and day 3, 6, 10, and 20 miNs by RNeasy plus micro kit (Qiagen). The RNA samples with > 9.5 of RIN based on a 2100 Bioanalyzer were used for RNA-Seq library preparation. Total RNA was processed for library construction by Cofactor Genomics (http://cofactorgenomics.com, St. Louis, MO) according to the following procedure: Briefly, total RNA was reverse-transcribed using an Oligo(dT) primer, and limited cDNA amplification was performed using the SMARTer® Ultra® Low Input RNA Kit for Sequencing – v4 (Takara Bio USA, Inc., Mountain View, CA). The resulting full-length cDNA was fragmented and tagged, followed by limited PCR enrichment to generate the final cDNA sequencing library (Nextera® XT DNA Library Prep, Illumina, San Diego, CA). Libraries were sequenced as single-end 75 base pair reads on an Illumina NextSeq500 following the manufacturer’s instructions by Cofactor Genomics.
DREM Analysis
The Dynamic Regulatory Events Miner (DREM) and cDREM were used to integrate time series gene expression data with predicted TF-gene binding interactions (top 100 genes per PWM from Ernst et al., 2010 to identify patterns of temporal gene expression patterns and the associated regulators. The log fold change of 7310 DE genes (fold-change > 10; q-value < 0.1) was used to generate all paths in Figure 3.
MicroArray
Total RNA was extracted from miNs and Moto-miNs derived from 22 yr old donor fibroblasts alongside corresponding starting fibroblast controls using TRIzol (Thermo Fisher Scientific, Waltham, MA) according to the manufacturer’s instruction followed by extraction using chloroform and then ethanol precipitation. RNA quality was determined by the ratio of absorbance at 260 nm and 280 nm to be approximately 2.0. Samples for RNA microarray were then standardly prepped and labeled with Illumina TotalPrep kits (Thermo Fisher Scientific, Waltham, MA) for Agilent Human 4×44Kv1. Standard hybridization and imagine scanning procedure were performed according to the manufacturer’s protocol at Genome Technology Access Center at Washington University School of Medicine, St. Louis.
Methylated DNA immunoprecipitation sequencing
MeDIP-seq was performed as in Maunakea et al. (Maunakea et al., 2010). Five micrograms of genomic DNA was sonicated to a fragment size of ~100–400 bp using the Bioruptor sonicator (Diagenode). End-repair, addition of 3′-A bases and PE adapter ligation with 2 μg of sonicated DNA was performed according to the Illumina Genomic DNA Sample Prep Kit protocol. Adapter-ligated DNA fragments were size selected to 166–366 bp and purified by gel electrophoresis. DNA was heat denatured and then immunoprecipitated with 5-methylcytidine antibody (Eurogentec; 1 μg of antibody per 1 μg of DNA) in 500 μl of immunoprecipitation buffer (10 μM sodium phosphate, pH 7.0, 140 mM sodium chloride and 0.05% Triton X-100) overnight at 4 °C. Antibody/DNA complexes were isolated by addition of 1 μl of rabbit anti-mouse IgG secondary antibody (2.4 mg ml−1, Jackson Immunoresearch) and 100 μl protein A/G agarose beads (Pierce Biotechnology) for 2 h at 4 °C. Beads were washed nine times with immunoprecipitation buffer and then DNA was eluted in TE buffer with 0.25% SDS and 0.25 mg/mL of proteinase K for 2 h at 50 °C. DNA was then purified with the Qiagen QIAquick kit and eluted in 30 μl EB buffer. Ten microliters of DNA was used for a PCR-enrichment reaction with PCR PE Primers 1.0 and 2.0. PCR products were size selected (220–420 bp) and purified by gel electrophoresis. Methylated DNA enrichment was confirmed by PCR on known methylated (SNRPN and MAGEA1 promoters) and unmethylated (a CpG-less sequence on chromosome 15 and glyceraldehyde 3-phosphate dehydrogenase promoter) sequences. DNA libraries were checked for quality by Nanodrop (Thermo Scientific) and Agilent DNA Bioanalyzer (Agilent). Reads were aligned to hg19 using BWA and pre-processed using methylQA (an unpublished C program; available at http://methylqa.sourceforge.net/). Detailed library construction protocols for MRE-seq and MeDIP-seq are publically available at the NIH Roadmap Epigenomics project website (http://www.roadmapepigenomics.org/protocols/type/experimental/).
Me-sensitive restriction enzyme sequencing
Methylation (Me)-sensitive enzyme sequencing (MRE-seq) was performed as in Maunakea et al. (Maunakea et al., 2010), with modifications as detailed below. Five parallel restriction enzyme digestions (HpaII, Bsh1236I, SsiI(AciI) and Hin6I (Fermentas), and HpyCH4IV (NEB)) were performed, each using 1 μg of DNA per digest for each of the samples. Five units of enzyme were initially incubated with DNA for 3 h and then an additional five units of enzyme were added to the digestion for a total of 6 h of digestion time. DNA was purified by phenol/chloroform/isoamyl alcohol extraction, followed by chloroform extraction using phase lock gels. Digested DNA from the different reactions was combined and precipitated with one-tenth volume of 3 M sodium acetate (pH 5.2) and 2.5 volumes of ethanol. The purified DNA was size selected and purified (50–300 bp) by gel electrophoresis and Qiagen MinElute extraction. Library construction was performed as per the Illumina Genomic DNA Sample Prep Kit protocol with the following modifications. During the end-repair reaction, T4 DNA polymerase and T4 PNK were excluded and 1 μl of 1:5 diluted Klenow DNA polymerase was used. For the adapter ligation reaction, 1 μl of 1:10 diluted PE adapter oligo mix was used. Ten microliters from the 30 μl of purified adapter ligated DNA was used for the PCR enrichment reaction with PCR PE Primers 1.0 and 2.0. PCR products were size selected and purified (170–420 bp) by gel electrophoresis and Qiagen QIAquick extraction. DNA libraries were checked for quality by Nanodrop (Thermo Scientific) and Agilent DNA Bioanalyzer (Agilent). Reads were aligned to hg19 using BWA and pre-processed using methylQA. MRE reads were normalized to account for differing enzyme efficiencies and methylation values were determined by counting reads with CpGs at fragment ends (Maunakea et al., 2010).
Genomic features
DMRs from day 30 (miN day 30 vs. Ctrl day 30) were segregated into exons, introns, intergenic regions, 3′ UTRs, 5′ UTRs, non-coding regions, promoter-TSSs, and TTSs by using the annotatePeaks program provided by HOMER (Heinz et al., 2010).
ATAC-sequencing
ATAC-seq was performed as previously described (Buenrostro et al., 2013). Briefly, 50,000 cells were collected for ATAC-seq library preparation at Ctrl day 10, miNs day 10, miNs day 20, shBRG1 day 20 and shCTRL day 20. Transposition reaction was carried out with Nextera Tn5 Transposase for 30 min at 37 °C. Library fragments were amplified for optimal amplification condition. Final libraries were purified using AMPure XP beads (Ampure) and sequenced with 50 bp paired-end reads on Illumina HiSeq 2500.
Translating ribosome affinity purification
Translating ribosome affinity purification (TRAP) (Heiman et al., 2014) was performed on spinal cord dissections pooled from 3–4 mice 21 days post birth that were positive for the eGFP-L10A fusion ribosomal marker protein under either the Chat promoter (Tg(Chat-EGFP/Rpl10a)DW167Htz) or the Snap25 promoter (Tg(Snap25-EGFP/Rpl10a)JD362Jdd). TRAP samples underwent immunopurification for four hours at 4°C. Both TRAP and pre-immunopurification control RNA samples were extracted through TRIzol purification, DNase treatment, and Qiagen RNeasy Mini columns (74104). Quality and quantity of RNA was assessed using a Bioanalyzer 2100 RNA Pico Chip. Sequencing libraries were amplified using Nugen Amplification Kit Ovation® RNA Seq System V2 (7102). Genome Technology Access Center at Washington University in St. Louis performed adapter ligation and sequencing of the libraries on the Illumina Hiseq2500. Three replicates of this procedure were analyzed.
Immunoblot analysis
Human fibroblasts (ATCC) expressing shBRG1 or shCtrl were lysed 7 days post-transduction in RIPA buffer (Thermo Scientific) supplemented with protease inhibitors (Roche). The concentrations of whole cell lysates were measured using the Pierce BCA protein assay kit (Thermo Scientific). Equal amounts of whole cell lysates were resolved by SDS-PAGE and transferred to a nitrocellulose membrane (GE Healthcare Life Sciences) using a transfer apparatus according to the manufacturer’s protocols (Bio-rad). After incubation with 5% BSA in TBS containing 0.1% Tween-20 (TBST) for 30 min, the membrane was incubated with primary antibodies at 4°C overnight. Following incubation, membranes were incubated with a horseradish peroxidase-conjugated anti-mouse or anti-rabbit antibody for 1 hr. Blots were developed with the ECL system (Thermo Scientific) according to the manufacturer’s protocols.
Quantitative PCR
Total RNA was extracted using TRIzol (Invitrogen, USA) according to the manufacturer’s instruction. Reverse-transcribed complementary DNA (cDNA) was synthesized from 500ng of RNA with SuperScript III First-Strand Synthesis SuperMix (Invitrogen, USA) or from 10 ng of RNA for microRNA expression analyses using specific stem-loop primer probes from TaqMan MicroRNA Assays (Invitrogen, USA). Subsequently, the cDNA was analyzed on a StepOnePlus Real-Time PCR System (AB Applied Biosystems, Germany). The following primers were utilized:
miRNA qRT-PCR primers
hsa-miR-218 (Thermo Fisher Cat. # 4427975)
RNU-44 (Thermo Fisher Cat. # 4427975)
For primers utilized for mRNA qRT PCR see Table S1.
Overlap with ISL1/LHX3 ChIP Seq
To identify the genes regulated by LHX3 and ISL1 in motor neurons, ISL1- and LHX3-ChIP sequencing data (Mazzoni et al., 2013) were used. We selected the regions co-occupied by ISL and LHX3 during ES to motor neuron differentiation, accounting for 84.2% of peak regions called in each ChIP-seq data. Based on the peaks co-occupied by ISL1 and LHX3, we annotated 3,486 closest genes with peaks located within 5Kb upstream of TSS and intragenic regions. Comparing those annotated genes with genes selectively enriched in Moto-miNs vs miNs (log2 fold change ≥ 2.5, p < 0.01), identified 323 genes co-occupied by ISL1 and LHX3 that are also upregulated when miR-9/9*-124 is co-expressed with ISL1/LHX3.
Experimental Design
For all experiments performed on miNs and Moto-miNs including molecular and functional characterizations of these cells, we do not specifically include or exclude samples or data. At minimum, biological duplicates were utilized for each experiment except DNA methylation profiling, where day 20 and day 30 conditions were treated as replicates to identify final DMRs. No statistical methods were used to predetermine sample size. Further specifics about the replicates (experimental n number) and performing procedures for each experiment are available in the Figure Legends and Star Methods.
QUANTIFICATION AND STATISTICAL ANALYSIS
Analysis of convered cells
The quantification of TUBB3, MAP2, NCAM and NEUN-positive cells over total number of cells (DAPI) shown in Figure 1C, Figure 6C, Figure S1F, and Figure S4C was done as follows: for TUBB3, MAP2, and NCAM only cells with processes at least three times the length of the soma were counted. For NEUN, only cells with proper nuclear localization were counted. Figure 1C data are represented as mean ± SEM. N = number of cells analyzed in at least 6 random fields of view from biological replicates. 22 Yr Female N = 238 cells, 42 Yr Female, N = 100 cells, 56 Yr Male N = 171 cells, and 68 Yr Female N = 216 cells. Figure 6C data are represented as mean ± SEM. Cells (N) analyzed: 22 yr old N=TUBB3 325, MAP2 219, NCAM 275; 42 yr old N=TUBB3 304, MAP2 236, NCAM 129; 56 yr old N=TUBB3 275, MAP2 279, NCAM 213; 68 yr old N=TUBB3 282, MAP2 234, NCAM 190. Quantification shown in Figure 6E represents the total percentage of MNX1, CHAT and SMI-32-positive cells over TUBB3-positive cells. Data are represented as mean ± SEM. Cells (N) analyzed: 22 yr old N=MNX1 256, CHAT 256, SMI-32 113; 42 yr old N= MNX1 151, CHAT 151, SMI-32 283; 56 yr old N= MNX1 207, CHAT 207, SMI-32 174; 68 yr old N= MNX1 151, CHAT 151, SMI-32 96. Figure S1F data are represented as mean ± SEM. Cells (N) analyzed: Starting Fibroblasts N= DAPI 155, FSP1 155, MAP2 0; Day 9 N= DAPI 96, FSP1 26, MAP2 20; Day 12 N= DAPI 290, FSP1 106, MAP2 29; Day 15 N= DAPI 313, FSP1 88, MAP2 56; Day 18 N= DAPI 88, FSP1 27, MAP2 26; Day 21 N= DAPI 175, FSP1 31, MAP2 62; Day 24 N= DAPI 230, FSP1 27, MAP2 95; Day 27 N= DAPI 290, FSP1 5, MAP2 143; Day 30 N= DAPI 203, FSP1 0, MAP2 155. Figure S4C data are represented as mean ± SEM. Cells (N) analyzed: Day 20 shBRG1 N= DAPI 155, FSP1 32, MAP2 11; Day 20 sh CTRL N= DAPI 173, FSP1 22, MAP2 117.
RNA-Seq data analyses
More than 35 million reads of each RNA-seq sample were aligned to human genome assembly GRCh 37. For differential expression analysis, edgeR and limma were used. Genes with low read counts, regarded as genes not expressed at a biologically meaningful level were filtered out before read normalization. The cut-off for low read count was counts per million (CPM) < 1 in at least any two samples across the experiment. Reads for each sample were normalized by the edgeR method of trimmed mean of M-values (TMM). The quantitative difference of read counts between miNs and starting fibroblast samples were evaluated by carrying out limma and graphically represented by Glimma. Gene enrichment analysis for differentially expressed genes was performed using Metascape Gene Annotation and Analysis Resource tool.
For RNA-seq time series data in Figure 3, quality control, alignment, clustering, normalization, and expression comparison were performed by Cofactor Genomics (http://cofactorgenomics.com, Saint Louis, Missouri, USA). Raw sequence data in FASTQ format were assessed for quality (FastQC, http://www.bioinformatics.babraham.ac.uk/projects/fastqc/) and ribosomal RNA content (sortmeRNA, http://bioinfo.lifl.fr/RNA/sortmerna/). NovoAlign (Novocraft, http://novocraft.com) was used to align reads to a set of transcript sequences. NovoAlign parameters were set to allow multiple alignments to the transcriptome set to allow for isoforms. Alignments to the genome were performed using STAR (https://github.com/alexdobin/STAR). Only unique alignments to the genome were allowed. The genome alignment loci from all samples were combined and clustered to generate genomic loci (“patches”) with contiguous read coverage. Patches overlapping reference genome annotation loci were labelled as such. For each transcript or patch, the RPKM expression value was calculated for each sample. These RPKM values are the basis for expression comparison and statistics generation. For each replicate group, the mean and coefficient of variation for each transcript or patch were calculated across the expression values for the samples in that group. These means were considered to be the expression values for the replicate group. Adjusted P-values were calculated between the means of each pair of replicate groups using a Welch’s t-test corrected for fase discovery rate (FDR) by the method of Benjamini-Hochberg.
MicroArray analyses
The intensity of the probes was imported into Partek and quantile normalized. Differentially expressed genes were identified using Partek with a cut-off of adjusted p-value < 0.05 and over 2.5 log2 fold expression change.
Quantitative-PCR analyses
Expression data were normalized to housekeeping genes HPRT1 and RNU44 for coding genes and microRNAs, respectively, and analyzed using the 2−ΔΔCT relative quantification method. Data are represented as mean +/− S.E.M. from 3 biological replicates each individually performed in technical triplicates. For primers utilized for mRNA qRT PCR see Table S1.
Differential DNA-methylated region analysis
The M&M statistical model (Zhang et al., 2013), which integrates MeDIP-seq and MRE-seq data to identify differentially methylated regions between two samples was implemented with a window size of 500 bp and a q-value (FDR-corrected P-value) cutoff of 5e-2. This cutoff was determined from Figure 3C, where only 1 DMR was detected at day 10 (miN day 10 vs. Ctrl day 10). For Figure 3B, only regions that were considered DMRs (q-value < 1e-5) at both day 20 (miN day 20 vs. Ctrl day 20) and day 30 (miN day 30 vs. Ctrl day 30) are displayed.
GO enrichment analyses
DNA methylation GO analyses of MGI (Mouse Genome Informatics) expression (Smith et al., 2014) presented in Figure 3D were performed using the GREAT package (McLean et al., 2010). Gene regulatory domains were defined by default as the regions spanning 5 kb upstream and 1 kb downstream of the TSS (regardless of other nearby genes). Gene regulatory domains were extended in both directions to the nearest gene’s basal domain, but no more than a maximum extension in one direction. The top 100 most significant overlapping DMRs from day 20 (miN day 20 vs. Ctrl day 20) and day 30 (miN day 30 vs. Ctrl day 30) were used as input. For Figure 3G, GO analyses were performed using Metascape (Tripathi et al., 2015) with a minimum enrichment of 1.5, a minimum overlap of 3, and a p-value cutoff of 0.01 using all demethylated or methylated DMRs at day 30 (miN day 30 vs. Ctrl day 30) that were either up- or down-regulated, respectively, by RNA-seq at day 35 using a cutoff of 2.5 logFC.
ATAC-Seq analyses
More than 50 million ATAC-seq reads per sample were trimmed for Nextera adapter sequences using TrimGalore and aligned to hg19 human genome assembly using bowtie2 with parameters –very-sensitive –maxins 2000 –no-discordant —no-mixed. Duplicate reads were discarded with Picard and uniquely mapped reads were used for downstream analysis. Peaks were called using Homer with parameters findPeaks -region -size 150 -minDist 300. Peaks called from all the samples were combined and raw reads mapped on the combined peaks were counted using HTSeq-count.
Differential peaks between any two different samples of Ctrl day 10, miNs day 10, miNs day 20 were identified using edgeR with a cut-off of fold-change > 1.5 and FDR < 0.01. Differential peaks were regarded as peaks gained or lost at each time point. Gained peaks at miNs day 10 and day 20 were combined and defined as open chromatin regions. Conversely, all lost peaks at miNs day 10 and day 20 were defined as close chromatin regions. The genomic features in the differential open and closed chromatin regions were distributed by CEAS software (Shin et al., 2009). Differential peaks between shBRG1 day 20 and shEGFP day 20 were defined using an independent cut-off (log2-fold-change ≥ 2, FDR < 0.05).
We annotated Ref-seq genes nearest differential peaks with Homer annotatePeaks command. Based on the genomic distributions and peak annotations, we defined the promotor regions (−/+ 2 kb from TSS) and distal regions (all peak positions except the promoter regions). GO enrichment analyses were performed by Metascape or the Gene Ontology. All heatmaps were made based on normalized signal intensity values (i.e. log2CPM) of each sample on relevant specific regions.
All histone mark ChIP-seq data were obtained from Roadmap Epigenome database of human fibroblasts (Roadmap Epigenomics et al., 2015). To identify histone mark-occupied chromatin accessibility during reprogramming, we compared each histone ChIP-seq data with open and closed chromatin regions based on ATAC-seq. We confirmed that most open and closed chromatin peaks overlapped with histone mark-ChIP peaks were found outside promoter regions (+/− 2 kb from TSS). Open and closed chromatin regions excluding promoter regions were then compared with histone ChIP-seq data and analyzed for GO enrichment.
Analysis of TRAP RNA-Seq data
RNA-Seq reads were mapped to Ensembl release 76 using STAR (analysis performed by Genome Technology Access Center at Washington University in St. Louis). For downstream analyses, only those genes with CPM > 1 in at least 3 samples, with an Ensembl gene biotype of “protein_coding,” were retained. For gene symbols mapping to multiple Ensembl gene IDs, only the ID with the highest number of mapped reads was retained, resulting in a total of 14,009 genes used for downstream analyses. Using edgeR, read counts were fit to a negative binomial generalized log-linear model, and a likelihood ratio test was done to determine differential expression.
Comparative analysis of RNA-Seq and microarray data
For comparative analysis, only probes with a detected call in at least 1 of 6 samples was retained, resulting in 23,775 probes mapping to a gene symbol. Expression level was then averaged over all probes for each gene, resulting in a total of 15,333 genes that were used for comparative analysis, 10,736 of which were also present in the gene set retained from the RNA-seq dataset (described above) after CPM filtering. Within the genes retained in both datasets, the top differentially expressed genes between motor neurons and controls - CHAT IP vs. SNAP25 IP (logFC > 1 and p < 0.05) in the RNA-seq dataset, and Moto-miN vs. miN (logFC > 2.5 and adjusted p < 0.05) in the microarray dataset - were assessed for significant contingency using a one-tailed Fisher’s exact test.
DATA AVAILABILITY
The RNA-seq, ATAC-seq, MeDIP and MRE-seq, and microarray data generated in this study are: 14 samples, single-end RNA-seq libraries from starting fibroblasts and miNs throughout direct conversion (Days 3, 6, 10, 20 and 30), 2 replicates per timepoint; 10 paired-end ATAC-seq libraries from day 10 Ctrl, day 10 and day 20 miNs, day 20 miNs with shBRG1 and day 20 miNs with an shCtrl, 2 replicates for each timepoint; 6 microarrays from starting fibroblasts, day 35 miNs, and day 35 moto-miNs, 2 replicates per condition; 6 samples of paired-end MeDIP libraries and 6 samples of MRE single-end libraries from day 10, 20, 30 miNs and corresponding Ctrls. The GEO accession number for the RNA-seq, ATAC-seq, MeDIP and MRE-seq, and microarray data data reported in this paper is GSE102035, The GEO accession number for the TRAP-seq data is GSE93412.
Supplementary Material
Acknowledgments
DGA is supported by the Philip and Sima Needleman Graduate Student Fellowship. MJM and RO are supported by the NIH-funded Ruth L. Kirschstein National Research Service Award (NRSA) Institutional Predoctoral Fellowship (T32GM081739; Barch, PI). J.D. and R.O.H. are supported by the Children’s Discovery Institute and J.D. is supported by NIH 1U01MH1091330. ASY is supported by NIH Director’s Innovator Award (DP2NS083372-01), Missouri Spinal Cord Injury/Disease Research Program (SCIDRP), Cure Alzheimer’s Fund (CAF) and Presidential Early Career Award for Scientists and Engineers (PECASE).
Footnotes
Publisher's Disclaimer: This is a PDF file of an unedited manuscript that has been accepted for publication. As a service to our customers we are providing this early version of the manuscript. The manuscript will undergo copyediting, typesetting, and review of the resulting proof before it is published in its final citable form. Please note that during the production process errors may be discovered which could affect the content, and all legal disclaimers that apply to the journal pertain.
AUTHOR CONTRIBUTIONS
ASY, DGA, MJM and WK conceived the concept for this study. ASY and DGA designed and performed experiments determining the neurogenic potential of miR-9/9*-124. DGA and WK designed and performed gene expression studies. MJM performed timecourse RNA-seq analyses. ASY, TW, HL and MJM designed DNA-methylation studies, and MJM generated and analyzed DNA-methylation data with assistance from XX and DL. ASY, DGA and WK designed and performed ATAC-Seq experiments and analyses. ASY and DGA designed and performed motor neuron experiments. JDD, ROH, AL and RO designed and analyzed TRAP-Seq experiments. ASY and DGA wrote the manuscript with input from all authors.
References
- Amin ND, Bai G, Klug JR, Bonanomi D, Pankratz MT, Gifford WD, Hinckley CA, Sternfeld MJ, Driscoll SP, Dominguez B, et al. Loss of motoneuron-specific microRNA-218 causes systemic neuromuscular failure. Science. 2015;350:1525–1529. doi: 10.1126/science.aad2509. [DOI] [PMC free article] [PubMed] [Google Scholar]
- Anders S, Pyl PT, Huber W. HTSeq–a Python framework to work with high-throughput sequencing data. Bioinformatics. 2015;31:166–169. doi: 10.1093/bioinformatics/btu638. [DOI] [PMC free article] [PubMed] [Google Scholar]
- Boudreau RL, Jiang P, Gilmore BL, Spengler RM, Tirabassi R, Nelson JA, Ross CA, Xing Y, Davidson BL. Transcriptome-wide discovery of microRNA binding sites in human brain. Neuron. 2014;81:294–305. doi: 10.1016/j.neuron.2013.10.062. [DOI] [PMC free article] [PubMed] [Google Scholar]
- Cantone I, Fisher AG. Epigenetic programming and reprogramming during development. Nat Struct Mol Biol. 2013;20:282–289. doi: 10.1038/nsmb.2489. [DOI] [PubMed] [Google Scholar]
- Chi SW, Zang JB, Mele A, Darnell RB. Argonaute HITS-CLIP decodes microRNA-mRNA interaction maps. Nature. 2009;460:479–486. doi: 10.1038/nature08170. [DOI] [PMC free article] [PubMed] [Google Scholar]
- Conaco C, Otto S, Han JJ, Mandel G. Reciprocal actions of REST and a microRNA promote neuronal identity. Proc Natl Acad Sci U S A. 2006;103:2422–2427. doi: 10.1073/pnas.0511041103. [DOI] [PMC free article] [PubMed] [Google Scholar]
- Dobin A, Davis CA, Schlesinger F, Drenkow J, Zaleski C, Jha S, Batut P, Chaisson M, Gingeras TR. STAR: ultrafast universal RNA-seq aligner. Bioinformatics. 2013;29:15–21. doi: 10.1093/bioinformatics/bts635. [DOI] [PMC free article] [PubMed] [Google Scholar]
- Egan CM, Nyman U, Skotte J, Streubel G, Turner S, O’Connell DJ, Rraklli V, Dolan MJ, Chadderton N, Hansen K, et al. CHD5 is required for neurogenesis and has a dual role in facilitating gene expression and polycomb gene repression. Dev Cell. 2013;26:223–236. doi: 10.1016/j.devcel.2013.07.008. [DOI] [PubMed] [Google Scholar]
- Ernst J, Plasterer HL, Simon I, Bar-Joseph Z. Integrating multiple evidence sources to predict transcription factor binding in the human genome. Genome Res. 2010;20:526–536. doi: 10.1101/gr.096305.109. [DOI] [PMC free article] [PubMed] [Google Scholar]
- Feng W, Khan MA, Bellvis P, Zhu Z, Bernhardt O, Herold-Mende C, Liu HK. The chromatin remodeler CHD7 regulates adult neurogenesis via activation of SoxC transcription factors. Cell Stem Cell. 2013;13:62–72. doi: 10.1016/j.stem.2013.05.002. [DOI] [PubMed] [Google Scholar]
- Fonnum F. Recent developments in biochemical investigations of cholinergic transmission. Brain Res. 1973;62:497–507. doi: 10.1016/0006-8993(73)90714-2. [DOI] [PubMed] [Google Scholar]
- Gehrke S, Imai Y, Sokol N, Lu B. Pathogenic LRRK2 negatively regulates microRNA-mediated translational repression. Nature. 2010;466:637–641. doi: 10.1038/nature09191. [DOI] [PMC free article] [PubMed] [Google Scholar]
- Heiman M, Kulicke R, Fenster RJ, Greengard P, Heintz N. Cell type-specific mRNA purification by translating ribosome affinity purification (TRAP) Nat Protoc. 2014;9:1282–1291. doi: 10.1038/nprot.2014.085. [DOI] [PMC free article] [PubMed] [Google Scholar]
- Heinz S, Benner C, Spann N, Bertolino E, Lin YC, Laslo P, Cheng JX, Murre C, Singh H, Glass CK. Simple combinations of lineage-determining transcription factors prime cis-regulatory elements required for macrophage and B cell identities. Mol Cell. 2010;38:576–589. doi: 10.1016/j.molcel.2010.05.004. [DOI] [PMC free article] [PubMed] [Google Scholar]
- Horvath S. DNA methylation age of human tissues and cell types. Genome Biol. 2013;14:R115. doi: 10.1186/gb-2013-14-10-r115. [DOI] [PMC free article] [PubMed] [Google Scholar]
- Huh CJ, Zhang B, Victor MB, Dahiya S, Batista LF, Horvath S, Yoo AS. Maintenance of age in human neurons generated by microRNA-based neuronal conversion of fibroblasts. Elife. 2016;5 doi: 10.7554/eLife.18648. [DOI] [PMC free article] [PubMed] [Google Scholar]
- Jaenisch R, Young R. Stem cells, the molecular circuitry of pluripotency and nuclear reprogramming. Cell. 2008;132:567–582. doi: 10.1016/j.cell.2008.01.015. [DOI] [PMC free article] [PubMed] [Google Scholar]
- Jiang C, Pugh BF. Nucleosome positioning and gene regulation: advances through genomics. Nat Rev Genet. 2009;10:161–172. doi: 10.1038/nrg2522. [DOI] [PMC free article] [PubMed] [Google Scholar]
- Kadoch C, Williams RT, Calarco JP, Miller EL, Weber CM, Braun SM, Pulice JL, Chory EJ, Crabtree GR. Dynamics of BAF-Polycomb complex opposition on heterochromatin in normal and oncogenic states. Nat Genet. 2017;49:213–222. doi: 10.1038/ng.3734. [DOI] [PMC free article] [PubMed] [Google Scholar]
- Kohli RM, Zhang Y. TET enzymes, TDG and the dynamics of DNA demethylation. Nature. 2013;502:472–479. doi: 10.1038/nature12750. [DOI] [PMC free article] [PubMed] [Google Scholar]
- Langmead B, Salzberg SL. Fast gapped-read alignment with Bowtie 2. Nat Methods. 2012;9:357–359. doi: 10.1038/nmeth.1923. [DOI] [PMC free article] [PubMed] [Google Scholar]
- Lessard J, Wu JI, Ranish JA, Wan M, Winslow MM, Staahl BT, Wu H, Aebersold R, Graef IA, Crabtree GR. An essential switch in subunit composition of a chromatin remodeling complex during neural development. Neuron. 2007;55:201–215. doi: 10.1016/j.neuron.2007.06.019. [DOI] [PMC free article] [PubMed] [Google Scholar]
- Lister R, Mukamel EA, Nery JR, Urich M, Puddifoot CA, Johnson ND, Lucero J, Huang Y, Dwork AJ, Schultz MD, et al. Global epigenomic reconfiguration during mammalian brain development. Science. 2013;341:1237905. doi: 10.1126/science.1237905. [DOI] [PMC free article] [PubMed] [Google Scholar]
- Makeyev EV, Zhang J, Carrasco MA, Maniatis T. The MicroRNA miR-124 promotes neuronal differentiation by triggering brain-specific alternative pre-mRNA splicing. Mol Cell. 2007;27:435–448. doi: 10.1016/j.molcel.2007.07.015. [DOI] [PMC free article] [PubMed] [Google Scholar]
- Maunakea AK, Nagarajan RP, Bilenky M, Ballinger TJ, D’Souza C, Fouse SD, Johnson BE, Hong C, Nielsen C, Zhao Y, et al. Conserved role of intragenic DNA methylation in regulating alternative promoters. Nature. 2010;466:253–257. doi: 10.1038/nature09165. [DOI] [PMC free article] [PubMed] [Google Scholar]
- Mazzoni EO, Mahony S, Closser M, Morrison CA, Nedelec S, Williams DJ, An D, Gifford DK, Wichterle H. Synergistic binding of transcription factors to cell-specific enhancers programs motor neuron identity. Nat Neurosci. 2013;16:1219–1227. doi: 10.1038/nn.3467. [DOI] [PMC free article] [PubMed] [Google Scholar]
- McLean CY, Bristor D, Hiller M, Clarke SL, Schaar BT, Lowe CB, Wenger AM, Bejerano G. GREAT improves functional interpretation of cis-regulatory regions. Nat Biotechnol. 2010;28:495–501. doi: 10.1038/nbt.1630. [DOI] [PMC free article] [PubMed] [Google Scholar]
- Mertens J, Marchetto MC, Bardy C, Gage FH. Evaluating cell reprogramming, differentiation and conversion technologies in neuroscience. Nat Rev Neurosci. 2016;17:424–437. doi: 10.1038/nrn.2016.46. [DOI] [PMC free article] [PubMed] [Google Scholar]
- Mertens J, Paquola AC, Ku M, Hatch E, Bohnke L, Ladjevardi S, McGrath S, Campbell B, Lee H, Herdy JR, et al. Directly Reprogrammed Human Neurons Retain Aging-Associated Transcriptomic Signatures and Reveal Age-Related Nucleocytoplasmic Defects. Cell Stem Cell. 2015;17:705–718. doi: 10.1016/j.stem.2015.09.001. [DOI] [PMC free article] [PubMed] [Google Scholar]
- Miller JD, Ganat YM, Kishinevsky S, Bowman RL, Liu B, Tu EY, Mandal PK, Vera E, Shim JW, Kriks S, et al. Human iPSC-based modeling of late-onset disease via progerin-induced aging. Cell Stem Cell. 2013;13:691–705. doi: 10.1016/j.stem.2013.11.006. [DOI] [PMC free article] [PubMed] [Google Scholar]
- Niu W, Zang T, Zou Y, Fang S, Smith DK, Bachoo R, Zhang CL. In vivo reprogramming of astrocytes to neuroblasts in the adult brain. Nat Cell Biol. 2013;15:1164–1175. doi: 10.1038/ncb2843. [DOI] [PMC free article] [PubMed] [Google Scholar]
- Okano M, Bell DW, Haber DA, Li E. DNA methyltransferases Dnmt3a and Dnmt3b are essential for de novo methylation and mammalian development. Cell. 1999;99:247–257. doi: 10.1016/s0092-8674(00)81656-6. [DOI] [PubMed] [Google Scholar]
- Packer AN, Xing Y, Harper SQ, Jones L, Davidson BL. The bifunctional microRNA miR-9/miR-9* regulates REST and CoREST and is downregulated in Huntington’s disease. J Neurosci. 2008;28:14341–14346. doi: 10.1523/JNEUROSCI.2390-08.2008. [DOI] [PMC free article] [PubMed] [Google Scholar]
- Pang ZP, Yang N, Vierbuchen T, Ostermeier A, Fuentes DR, Yang TQ, Citri A, Sebastiano V, Marro S, Sudhof TC, et al. Induction of human neuronal cells by defined transcription factors. Nature. 2011;476:220–223. doi: 10.1038/nature10202. [DOI] [PMC free article] [PubMed] [Google Scholar]
- Pasquinelli AE. MicroRNAs and their targets: recognition, regulation and an emerging reciprocal relationship. Nat Rev Genet. 2012;13:271–282. doi: 10.1038/nrg3162. [DOI] [PubMed] [Google Scholar]
- Perrier AL, Tabar V, Barberi T, Rubio ME, Bruses J, Topf N, Harrison NL, Studer L. Derivation of midbrain dopamine neurons from human embryonic stem cells. Proc Natl Acad Sci U S A. 2004;101:12543–12548. doi: 10.1073/pnas.0404700101. [DOI] [PMC free article] [PubMed] [Google Scholar]
- Richner M, Victor MB, Liu Y, Abernathy D, Yoo AS. MicroRNA-based conversion of human fibroblasts into striatal medium spiny neurons. Nat Protoc. 2015;10:1543–1555. doi: 10.1038/nprot.2015.102. [DOI] [PMC free article] [PubMed] [Google Scholar]
- Ritchie ME, Phipson B, Wu D, Hu Y, Law CW, Shi W, Smyth GK. limma powers differential expression analyses for RNA-sequencing and microarray studies. Nucleic Acids Res. 2015;43:e47. doi: 10.1093/nar/gkv007. [DOI] [PMC free article] [PubMed] [Google Scholar]
- Roadmap Epigenomics, C. Kundaje A, Meuleman W, Ernst J, Bilenky M, Yen A, Heravi-Moussavi A, Kheradpour P, Zhang Z, Wang J, et al. Integrative analysis of 111 reference human epigenomes. Nature. 2015;518:317–330. doi: 10.1038/nature14248. [DOI] [PMC free article] [PubMed] [Google Scholar]
- Robinson MD, McCarthy DJ, Smyth GK. edgeR: a Bioconductor package for differential expression analysis of digital gene expression data. Bioinformatics. 2010;26:139–140. doi: 10.1093/bioinformatics/btp616. [DOI] [PMC free article] [PubMed] [Google Scholar]
- Schulz MH, Devanny WE, Gitter A, Zhong S, Ernst J, Bar-Joseph Z. DREM 2.0: Improved reconstruction of dynamic regulatory networks from time-series expression data. BMC Syst Biol. 2012;6:104. doi: 10.1186/1752-0509-6-104. [DOI] [PMC free article] [PubMed] [Google Scholar]
- Shibata M, Kurokawa D, Nakao H, Ohmura T, Aizawa S. MicroRNA-9 modulates Cajal-Retzius cell differentiation by suppressing Foxg1 expression in mouse medial pallium. J Neurosci. 2008;28:10415–10421. doi: 10.1523/JNEUROSCI.3219-08.2008. [DOI] [PMC free article] [PubMed] [Google Scholar]
- Shin H, Liu T, Manrai AK, Liu XS. CEAS: cis-regulatory element annotation system. Bioinformatics. 2009;25:2605–2606. doi: 10.1093/bioinformatics/btp479. [DOI] [PubMed] [Google Scholar]
- Smith CM, Finger JH, Hayamizu TF, McCright IJ, Xu J, Berghout J, Campbell J, Corbani LE, Forthofer KL, Frost PJ, et al. The mouse Gene Expression Database (GXD): 2014 update. Nucleic Acids Res. 2014;42:D818–824. doi: 10.1093/nar/gkt954. [DOI] [PMC free article] [PubMed] [Google Scholar]
- Soufi A, Donahue G, Zaret KS. Facilitators and impediments of the pluripotency reprogramming factors’ initial engagement with the genome. Cell. 2012;151:994–1004. doi: 10.1016/j.cell.2012.09.045. [DOI] [PMC free article] [PubMed] [Google Scholar]
- Staahl BT, Tang J, Wu W, Sun A, Gitler AD, Yoo AS, Crabtree GR. Kinetic analysis of npBAF to nBAF switching reveals exchange of SS18 with CREST and integration with neural developmental pathways. J Neurosci. 2013;33:10348–10361. doi: 10.1523/JNEUROSCI.1258-13.2013. [DOI] [PMC free article] [PubMed] [Google Scholar]
- Stefanakis N, Carrera I, Hobert O. Regulatory Logic of Pan-Neuronal Gene Expression in C. elegans. Neuron. 2015;87:733–750. doi: 10.1016/j.neuron.2015.07.031. [DOI] [PMC free article] [PubMed] [Google Scholar]
- Steinbeck JA, Jaiswal MK, Calder EL, Kishinevsky S, Weishaupt A, Toyka KV, Goldstein PA, Studer L. Functional Connectivity under Optogenetic Control Allows Modeling of Human Neuromuscular Disease. Cell Stem Cell. 2016;18:134–143. doi: 10.1016/j.stem.2015.10.002. [DOI] [PMC free article] [PubMed] [Google Scholar]
- Takahashi K, Yamanaka S. A decade of transcription factor-mediated reprogramming to pluripotency. Nat Rev Mol Cell Biol. 2016;17:183–193. doi: 10.1038/nrm.2016.8. [DOI] [PubMed] [Google Scholar]
- Tanabe Y, William C, Jessell TM. Specification of motor neuron identity by the MNR2 homeodomain protein. Cell. 1998;95:67–80. doi: 10.1016/s0092-8674(00)81783-3. [DOI] [PubMed] [Google Scholar]
- Thiebes KP, Nam H, Cambronne XA, Shen R, Glasgow SM, Cho HH, Kwon JS, Goodman RH, Lee JW, Lee S, et al. miR-218 is essential to establish motor neuron fate as a downstream effector of Isl1-Lhx3. Nat Commun. 2015;6:7718. doi: 10.1038/ncomms8718. [DOI] [PMC free article] [PubMed] [Google Scholar]
- Tiwari VK, Burger L, Nikoletopoulou V, Deogracias R, Thakurela S, Wirbelauer C, Kaut J, Terranova R, Hoerner L, Mielke C, et al. Target genes of Topoisomerase IIbeta regulate neuronal survival and are defined by their chromatin state. Proc Natl Acad Sci U S A. 2012;109:E934–943. doi: 10.1073/pnas.1119798109. [DOI] [PMC free article] [PubMed] [Google Scholar]
- Tripathi S, Pohl MO, Zhou Y, Rodriguez-Frandsen A, Wang G, Stein DA, Moulton HM, DeJesus P, Che J, Mulder LC, et al. Meta- and Orthogonal Integration of Influenza “OMICs” Data Defines a Role for UBR4 in Virus Budding. Cell Host Microbe. 2015;18:723–735. doi: 10.1016/j.chom.2015.11.002. [DOI] [PMC free article] [PubMed] [Google Scholar]
- Vadhvani M, Schwedhelm-Domeyer N, Mukherjee C, Stegmuller J. The centrosomal E3 ubiquitin ligase FBXO31-SCF regulates neuronal morphogenesis and migration. PLoS One. 2013;8:e57530. doi: 10.1371/journal.pone.0057530. [DOI] [PMC free article] [PubMed] [Google Scholar]
- Victor MB, Richner M, Hermanstyne TO, Ransdell JL, Sobieski C, Deng PY, Klyachko VA, Nerbonne JM, Yoo AS. Generation of human striatal neurons by microRNA-dependent direct conversion of fibroblasts. Neuron. 2014;84:311–323. doi: 10.1016/j.neuron.2014.10.016. [DOI] [PMC free article] [PubMed] [Google Scholar]
- Vierbuchen T, Wernig M. Molecular roadblocks for cellular reprogramming. Mol Cell. 2012;47:827–838. doi: 10.1016/j.molcel.2012.09.008. [DOI] [PMC free article] [PubMed] [Google Scholar]
- Visvanathan J, Lee S, Lee B, Lee JW, Lee SK. The microRNA miR-124 antagonizes the anti-neural REST/SCP1 pathway during embryonic CNS development. Genes Dev. 2007;21:744–749. doi: 10.1101/gad.1519107. [DOI] [PMC free article] [PubMed] [Google Scholar]
- Wapinski OL, Vierbuchen T, Qu K, Lee QY, Chanda S, Fuentes DR, Giresi PG, Ng YH, Marro S, Neff NF, et al. Hierarchical mechanisms for direct reprogramming of fibroblasts to neurons. Cell. 2013;155:621–635. doi: 10.1016/j.cell.2013.09.028. [DOI] [PMC free article] [PubMed] [Google Scholar]
- Wichterle H, Lieberam I, Porter JA, Jessell TM. Directed differentiation of embryonic stem cells into motor neurons. Cell. 2002;110:385–397. doi: 10.1016/s0092-8674(02)00835-8. [DOI] [PubMed] [Google Scholar]
- Wise A, Bar-Joseph Z. cDREM: inferring dynamic combinatorial gene regulation. J Comput Biol. 2015;22:324–333. doi: 10.1089/cmb.2015.0010. [DOI] [PMC free article] [PubMed] [Google Scholar]
- Wu H, Zhang Y. Mechanisms and functions of Tet protein-mediated 5-methylcytosine oxidation. Genes Dev. 2011;25:2436–2452. doi: 10.1101/gad.179184.111. [DOI] [PMC free article] [PubMed] [Google Scholar]
- Wu S, Huang S, Ding J, Zhao Y, Liang L, Liu T, Zhan R, He X. Multiple microRNAs modulate p21Cip1/Waf1 expression by directly targeting its 3′ untranslated region. Oncogene. 2010;29:2302–2308. doi: 10.1038/onc.2010.34. [DOI] [PubMed] [Google Scholar]
- Xu X, Wells AB, O’Brien DR, Nehorai A, Dougherty JD. Cell type-specific expression analysis to identify putative cellular mechanisms for neurogenetic disorders. J Neurosci. 2014;34:1420–1431. doi: 10.1523/JNEUROSCI.4488-13.2014. [DOI] [PMC free article] [PubMed] [Google Scholar]
- Yoo AS, Staahl BT, Chen L, Crabtree GR. MicroRNA-mediated switching of chromatin-remodelling complexes in neural development. Nature. 2009;460:642–646. doi: 10.1038/nature08139. [DOI] [PMC free article] [PubMed] [Google Scholar]
- Yoo AS, Sun AX, Li L, Shcheglovitov A, Portmann T, Li Y, Lee-Messer C, Dolmetsch RE, Tsien RW, Crabtree GR. MicroRNA-mediated conversion of human fibroblasts to neurons. Nature. 2011;476:228–231. doi: 10.1038/nature10323. [DOI] [PMC free article] [PubMed] [Google Scholar]
- Zhang B, Zhou Y, Lin N, Lowdon RF, Hong C, Nagarajan RP, Cheng JB, Li D, Stevens M, Lee HJ, et al. Functional DNA methylation differences between tissues, cell types, and across individuals discovered using the M&M algorithm. Genome Res. 2013;23:1522–1540. doi: 10.1101/gr.156539.113. [DOI] [PMC free article] [PubMed] [Google Scholar]
Associated Data
This section collects any data citations, data availability statements, or supplementary materials included in this article.
Supplementary Materials
Data Availability Statement
The RNA-seq, ATAC-seq, MeDIP and MRE-seq, and microarray data generated in this study are: 14 samples, single-end RNA-seq libraries from starting fibroblasts and miNs throughout direct conversion (Days 3, 6, 10, 20 and 30), 2 replicates per timepoint; 10 paired-end ATAC-seq libraries from day 10 Ctrl, day 10 and day 20 miNs, day 20 miNs with shBRG1 and day 20 miNs with an shCtrl, 2 replicates for each timepoint; 6 microarrays from starting fibroblasts, day 35 miNs, and day 35 moto-miNs, 2 replicates per condition; 6 samples of paired-end MeDIP libraries and 6 samples of MRE single-end libraries from day 10, 20, 30 miNs and corresponding Ctrls. The GEO accession number for the RNA-seq, ATAC-seq, MeDIP and MRE-seq, and microarray data data reported in this paper is GSE102035, The GEO accession number for the TRAP-seq data is GSE93412.