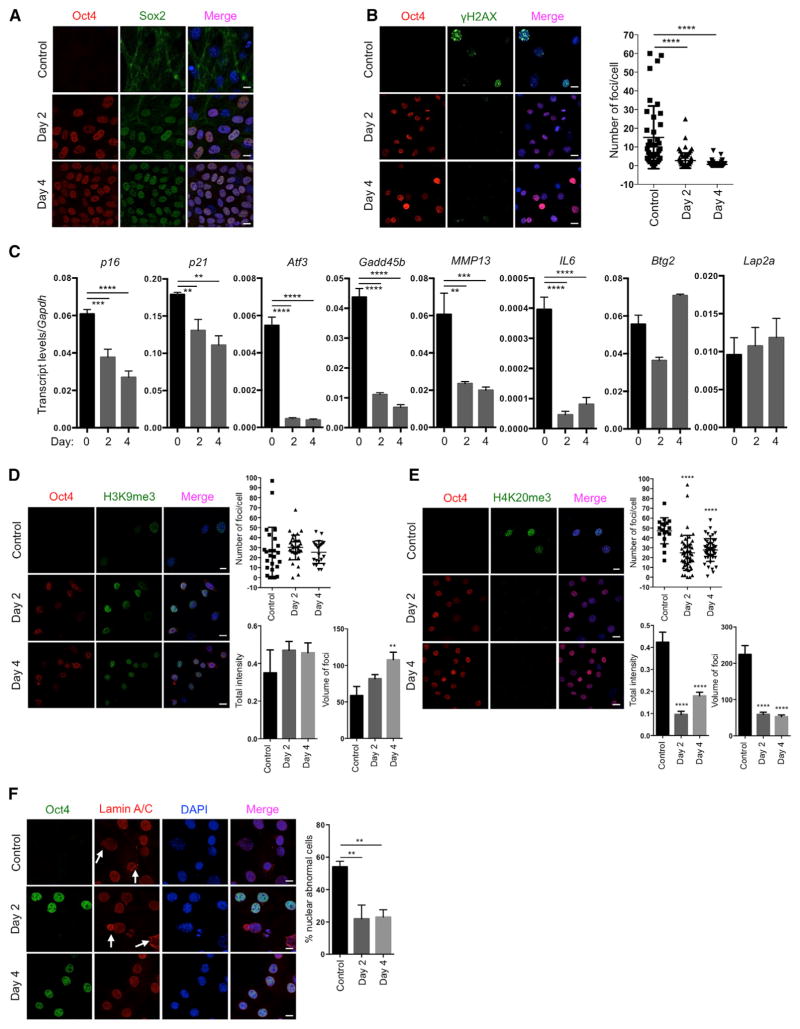
Figure 1. Amelioration of Cellular Markers of Aging by Short-Term In Vitro Induction of Oct4, Sox2, Klf4, and c-Myc.
(A) Immunofluorescence of Oct4 and Sox2 in LAKI 4F TTFs. Scale bar, 10 μm.
(B) Immunofluorescence and quantification of γH2AX foci in LAKI 4F TTFs. Scale bar, 10 μm. **** p < 0.0001, according to one-way ANOVA with Bonferroni correction.
(C) qPCR analysis of stress response genes in the p53 pathway, senescence-associated metalloprotease MMP13 and interleukin-6 in LAKI 4F TTFs. **p < 0.01, ***p < 0.001, and ****p < 0.0001 according to one-way ANOVA with Bonferroni correction.
(D and E) Immunofluorescence of H3K9me3 and H4K20me3 in LAKI 4F TTFs. Scale bar, 10 μm. **p < 0.005 and ****p < 0.0001 according to one-way ANOVA with Bonferroni correction.
(F) Immunofluorescence of Lamin A/C and quantification of nuclear abnormality in LAKI 4F TTFs. Arrows indicate blebbing in the nuclear envelope in Oct4 negative cells. Scale bar, 10 μm. **p < 0.005 according to one-way ANOVA with Bonferroni correction.
Data are presented as mean ± SEM. See also Figures S1 and S2.

